

Section 06
Importing into India
Seven setup steps, duty and licences for the goods small importers bring in most, where India buys them from, and how to pay a supplier abroad safely.
- India’s imports, 2025-26
- US$ 775.7 bn
- Change from 2024-25
- +7.6%
- Import guides
- 76
Start importing
Seven steps before your first container
Do them in order. Most are online; the licences for your product take the longest.
 01Get your IEC (and GST registration)
No business can import into India without an Importer-Exporter Code from DGFT. It costs ₹500 and is issued online.
 02Register on ICEGATE
ICEGATE is Customs’ online portal. Registering your IEC there lets you see your bills of entry, pay duty online and upload documents.
 03Check the import policy and duty for your HS code
Find the 8-digit HS code, then check DGFT’s ITC(HS) Schedule 1 for the policy and CBIC/ICEGATE for the duty — before you agree a price.
 04Get the product licences before you order
BIS, FSSAI, plant quarantine, CDSCO, WPC, Legal Metrology and EPR registrations must be in place before the goods leave the supplier.
 05Check the supplier and sign a clear contract
Verify the supplier, test a sample, fix the Incoterm, and write specifications, inspection and documents into the purchase order.
 06Pay the supplier through your AD bank
Import payments go through an Authorised Dealer bank under RBI’s 2026 regulations. The bank tracks every bill of entry until it is paid.
- 07Clear the goods: bill of entry to out of charge
File the bill of entry, let Customs assess it, pay duty online, get out of charge, then claim the IGST as input credit.
Goods
What small importers bring in
Each guide gives the HS code, the duty you pay, the licences you need, anti-dumping duties, and where India buys it from.
Food and farm goods
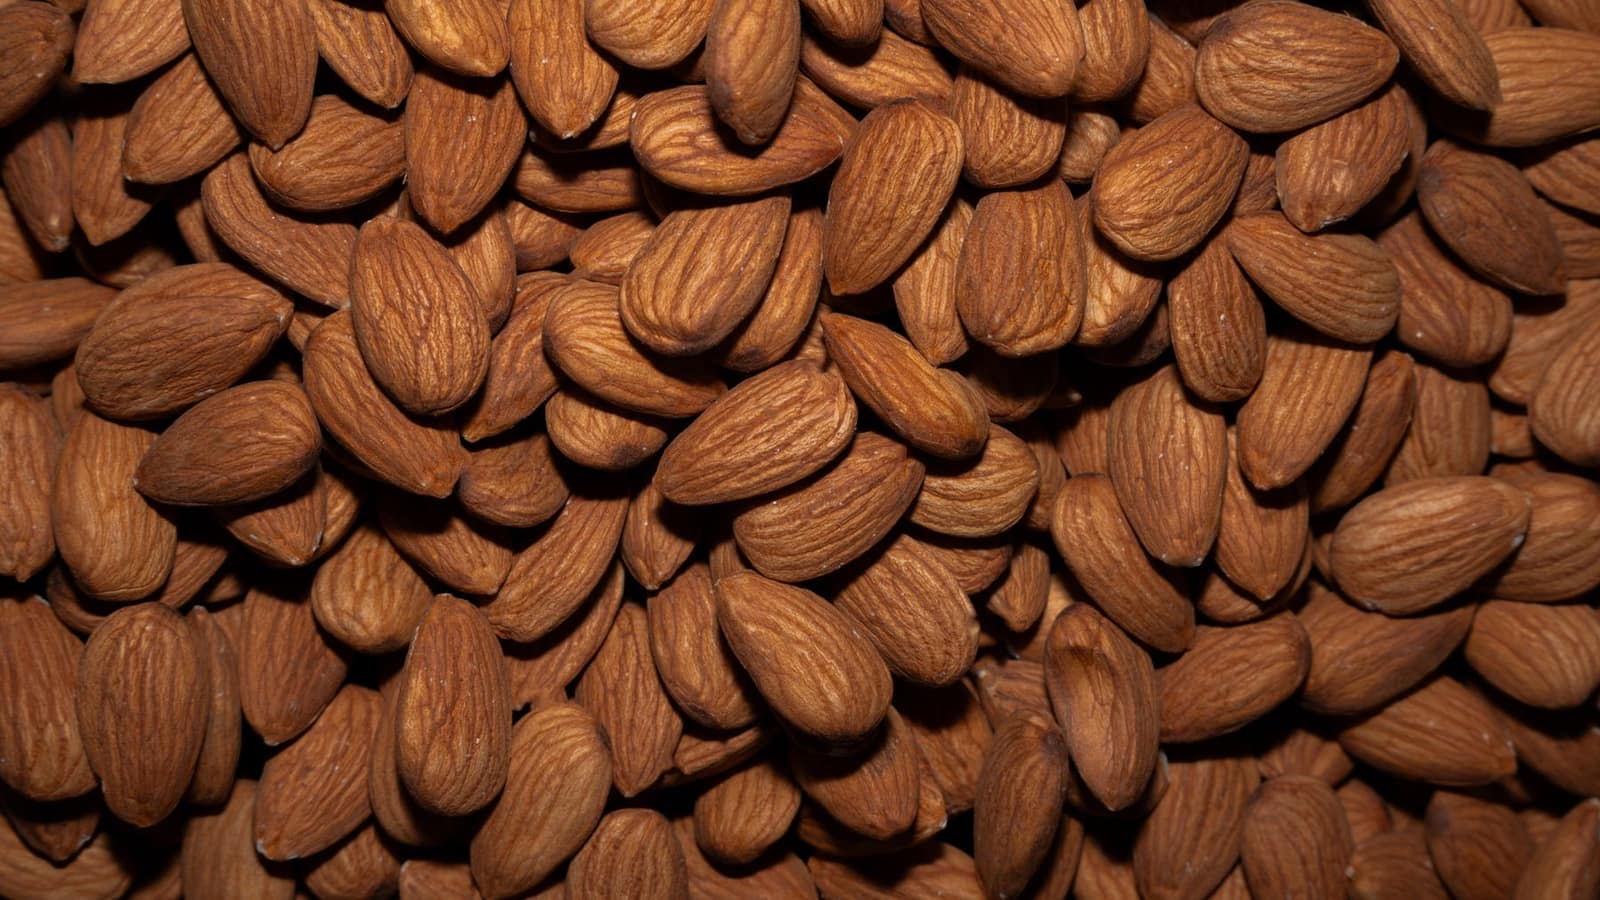 Free to importFood and farm goodsAlmondsIndia’s largest dry-fruit import. Fixed duty per kg, FSSAI clearance at the port, almost all of it from the USA.Basic duty₹35/kgIGST5%India imported 2025-26US$ 1.43 bn
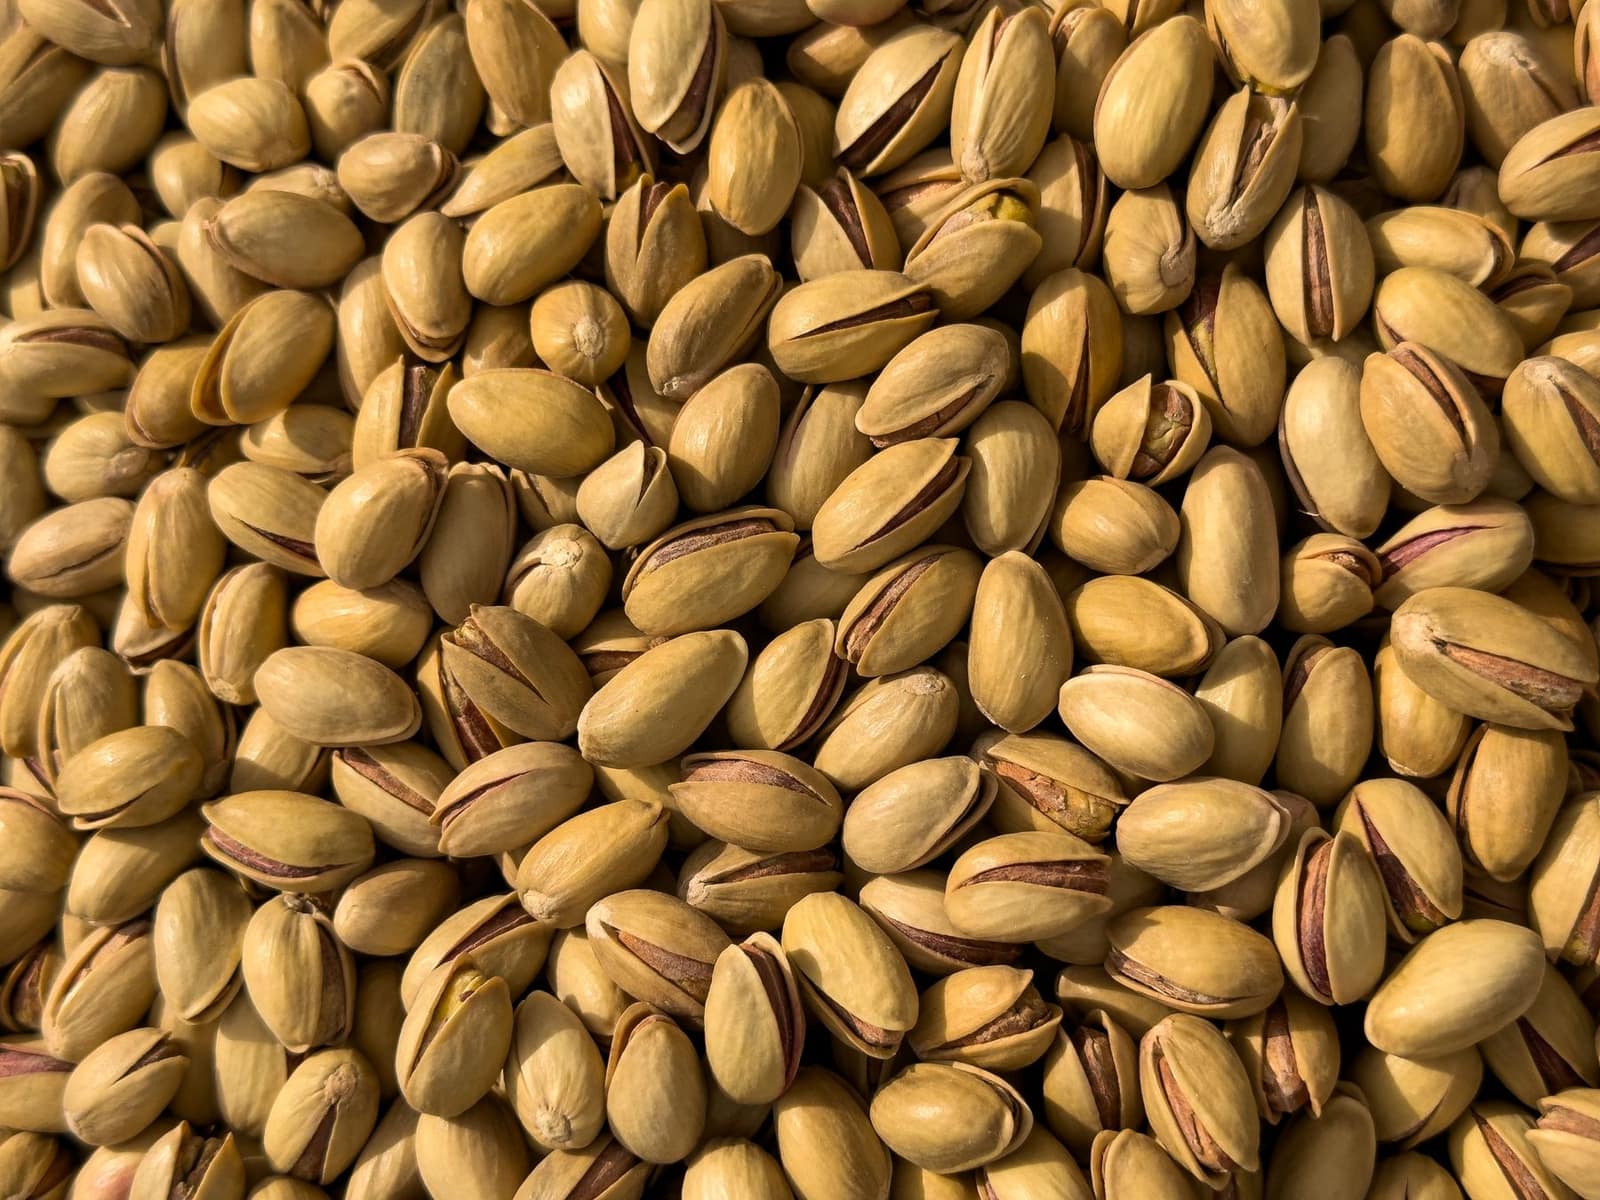 Free to importFood and farm goodsPistachios10% basic duty, FSSAI clearance, supply from the USA, Iran, the UAE and Afghanistan.Basic duty10%IGST5%India imported 2025-26US$ 262 mn
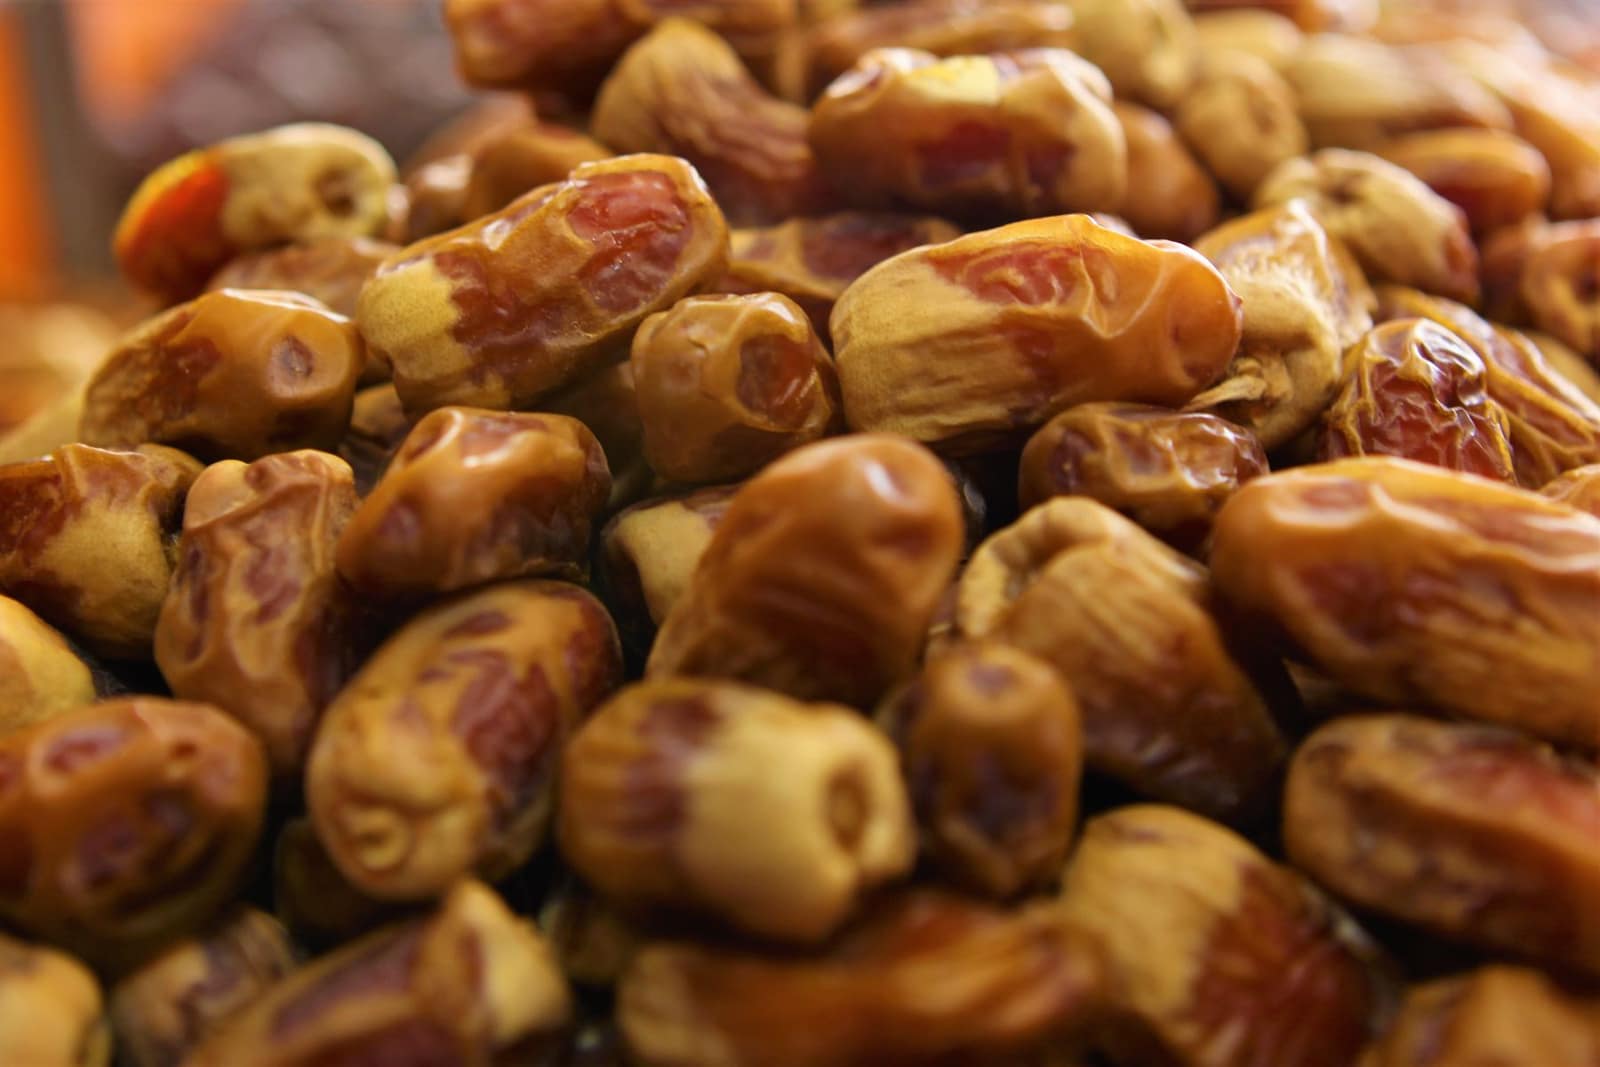 Free to importFood and farm goodsDates20% duty on soft and hard dates, 30% on fresh. The UAE and Iraq are the main suppliers.Basic duty20–30%IGST5%India imported 2025-26US$ 341 mn
 Free to importFood and farm goodsRaw cashew nuts (in shell)Raw material for India’s cashew processing units. 2.5% duty; most comes from West Africa and Tanzania.Basic duty2.5%IGST5%India imported 2025-26US$ 2.29 bn
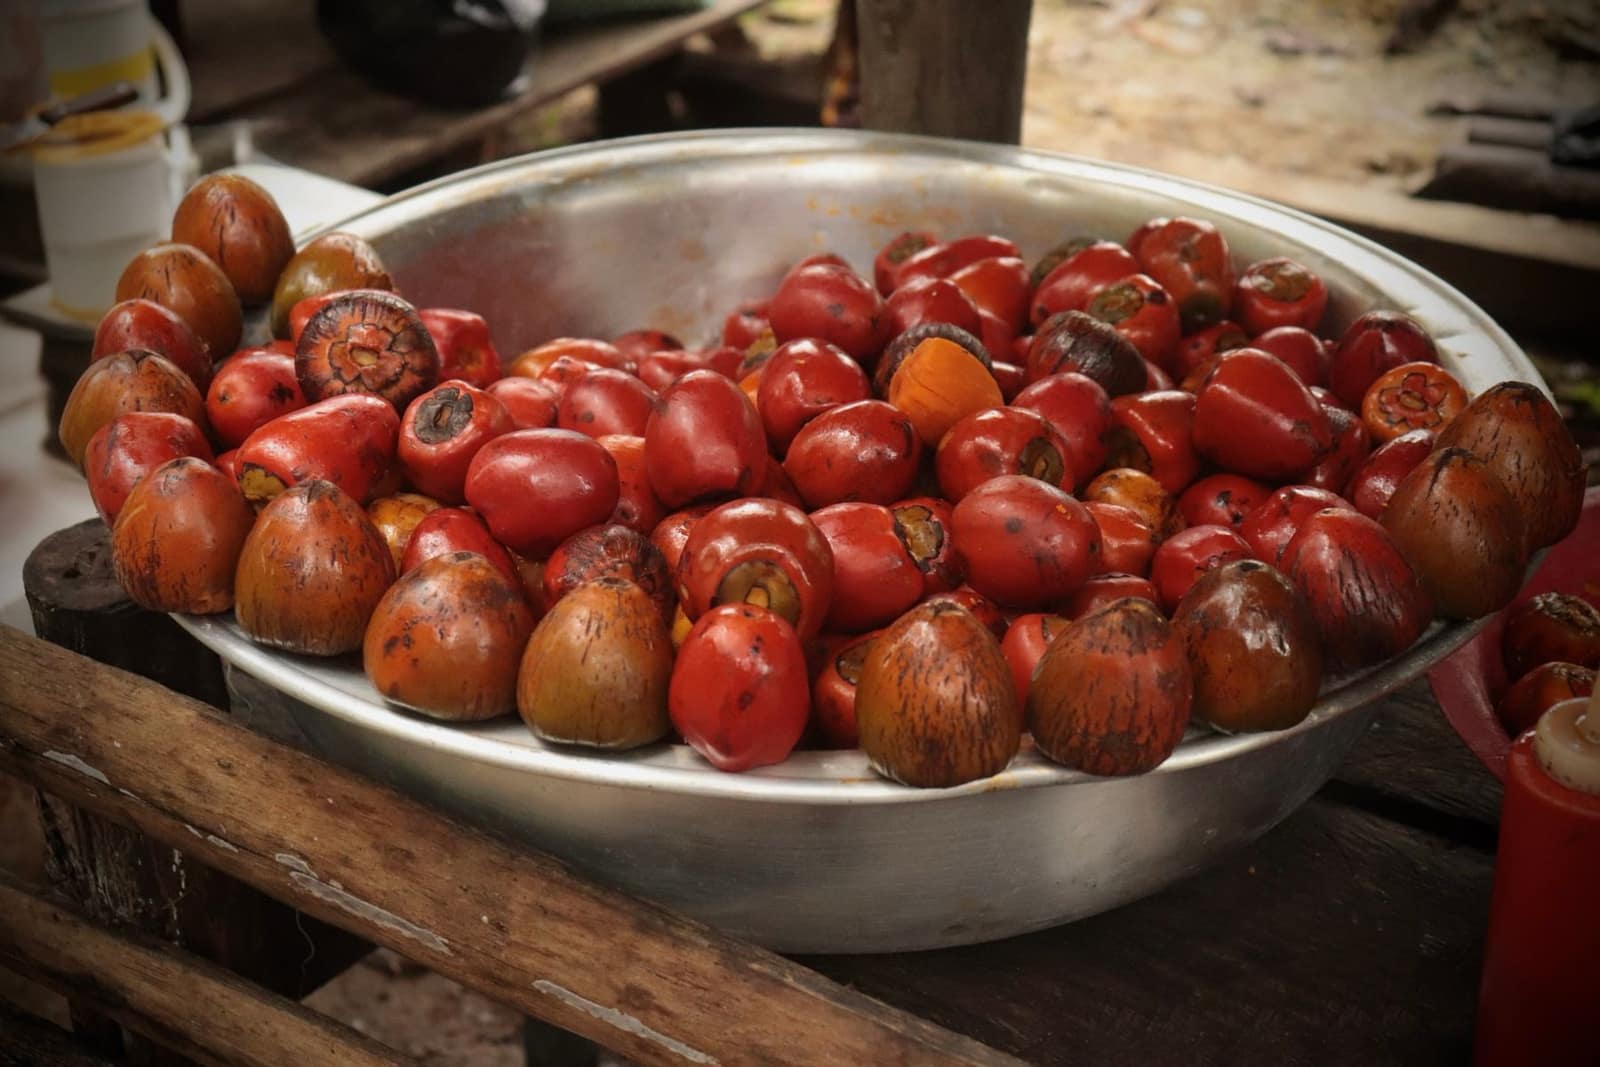 Free to importFood and farm goodsEdible oils (palm, soybean, sunflower)India’s biggest food import. Duty on crude oils was cut on 24 Sep 2026: 5% on crude palm and soybean, nil on crude sunflower.Basic duty5–27.5%IGST5%India imported 2025-26US$ 19.1 bn
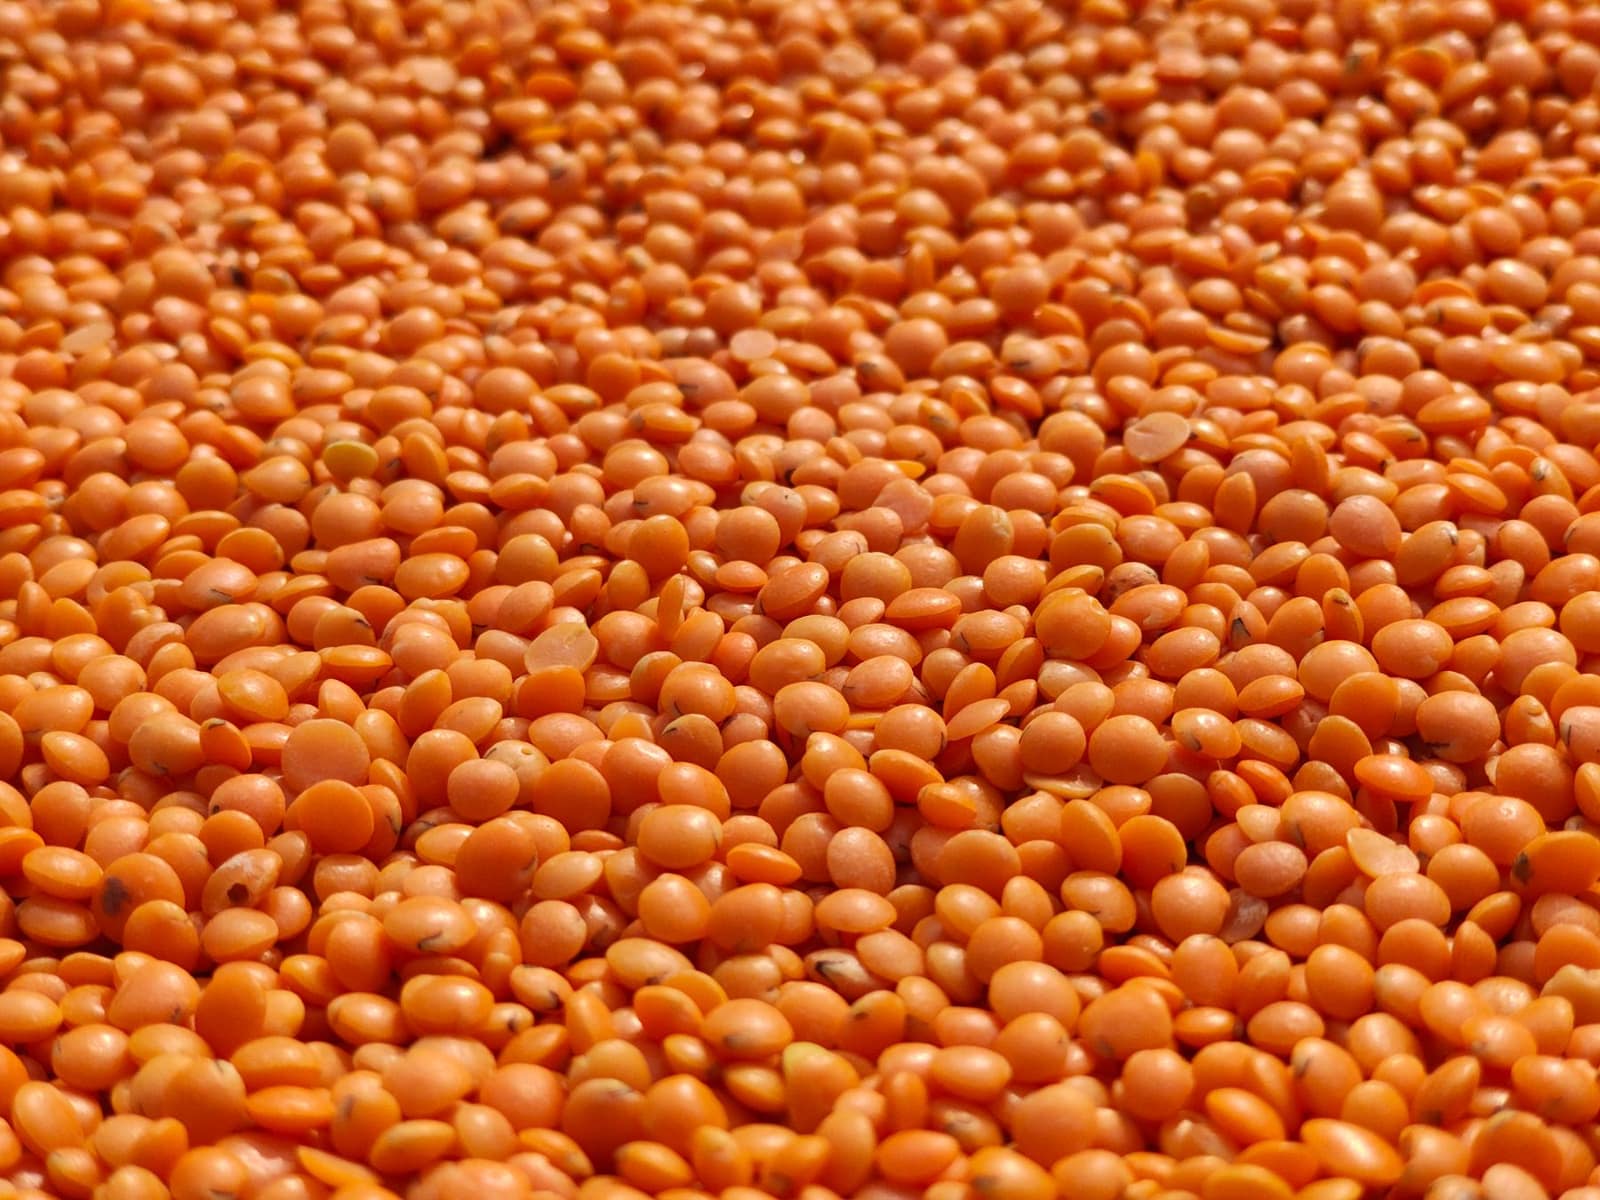 Free, with conditionsFood and farm goodsPulses (dals)Duty and policy differ by pulse: tur and urad are free and duty-free to Mar 2027; yellow peas pay 10% plus 20% AIDC.Basic duty0–5%IGST0–5%India imported 2025-26US$ 3.63 bn
 Free, with conditionsFood and farm goodsApples (fresh)15% basic duty plus 35% AIDC, and a minimum import price of Rs 50 per kg CIF.Basic duty15–50%IGSTNilIndia imported 2025-26US$ 317 mn
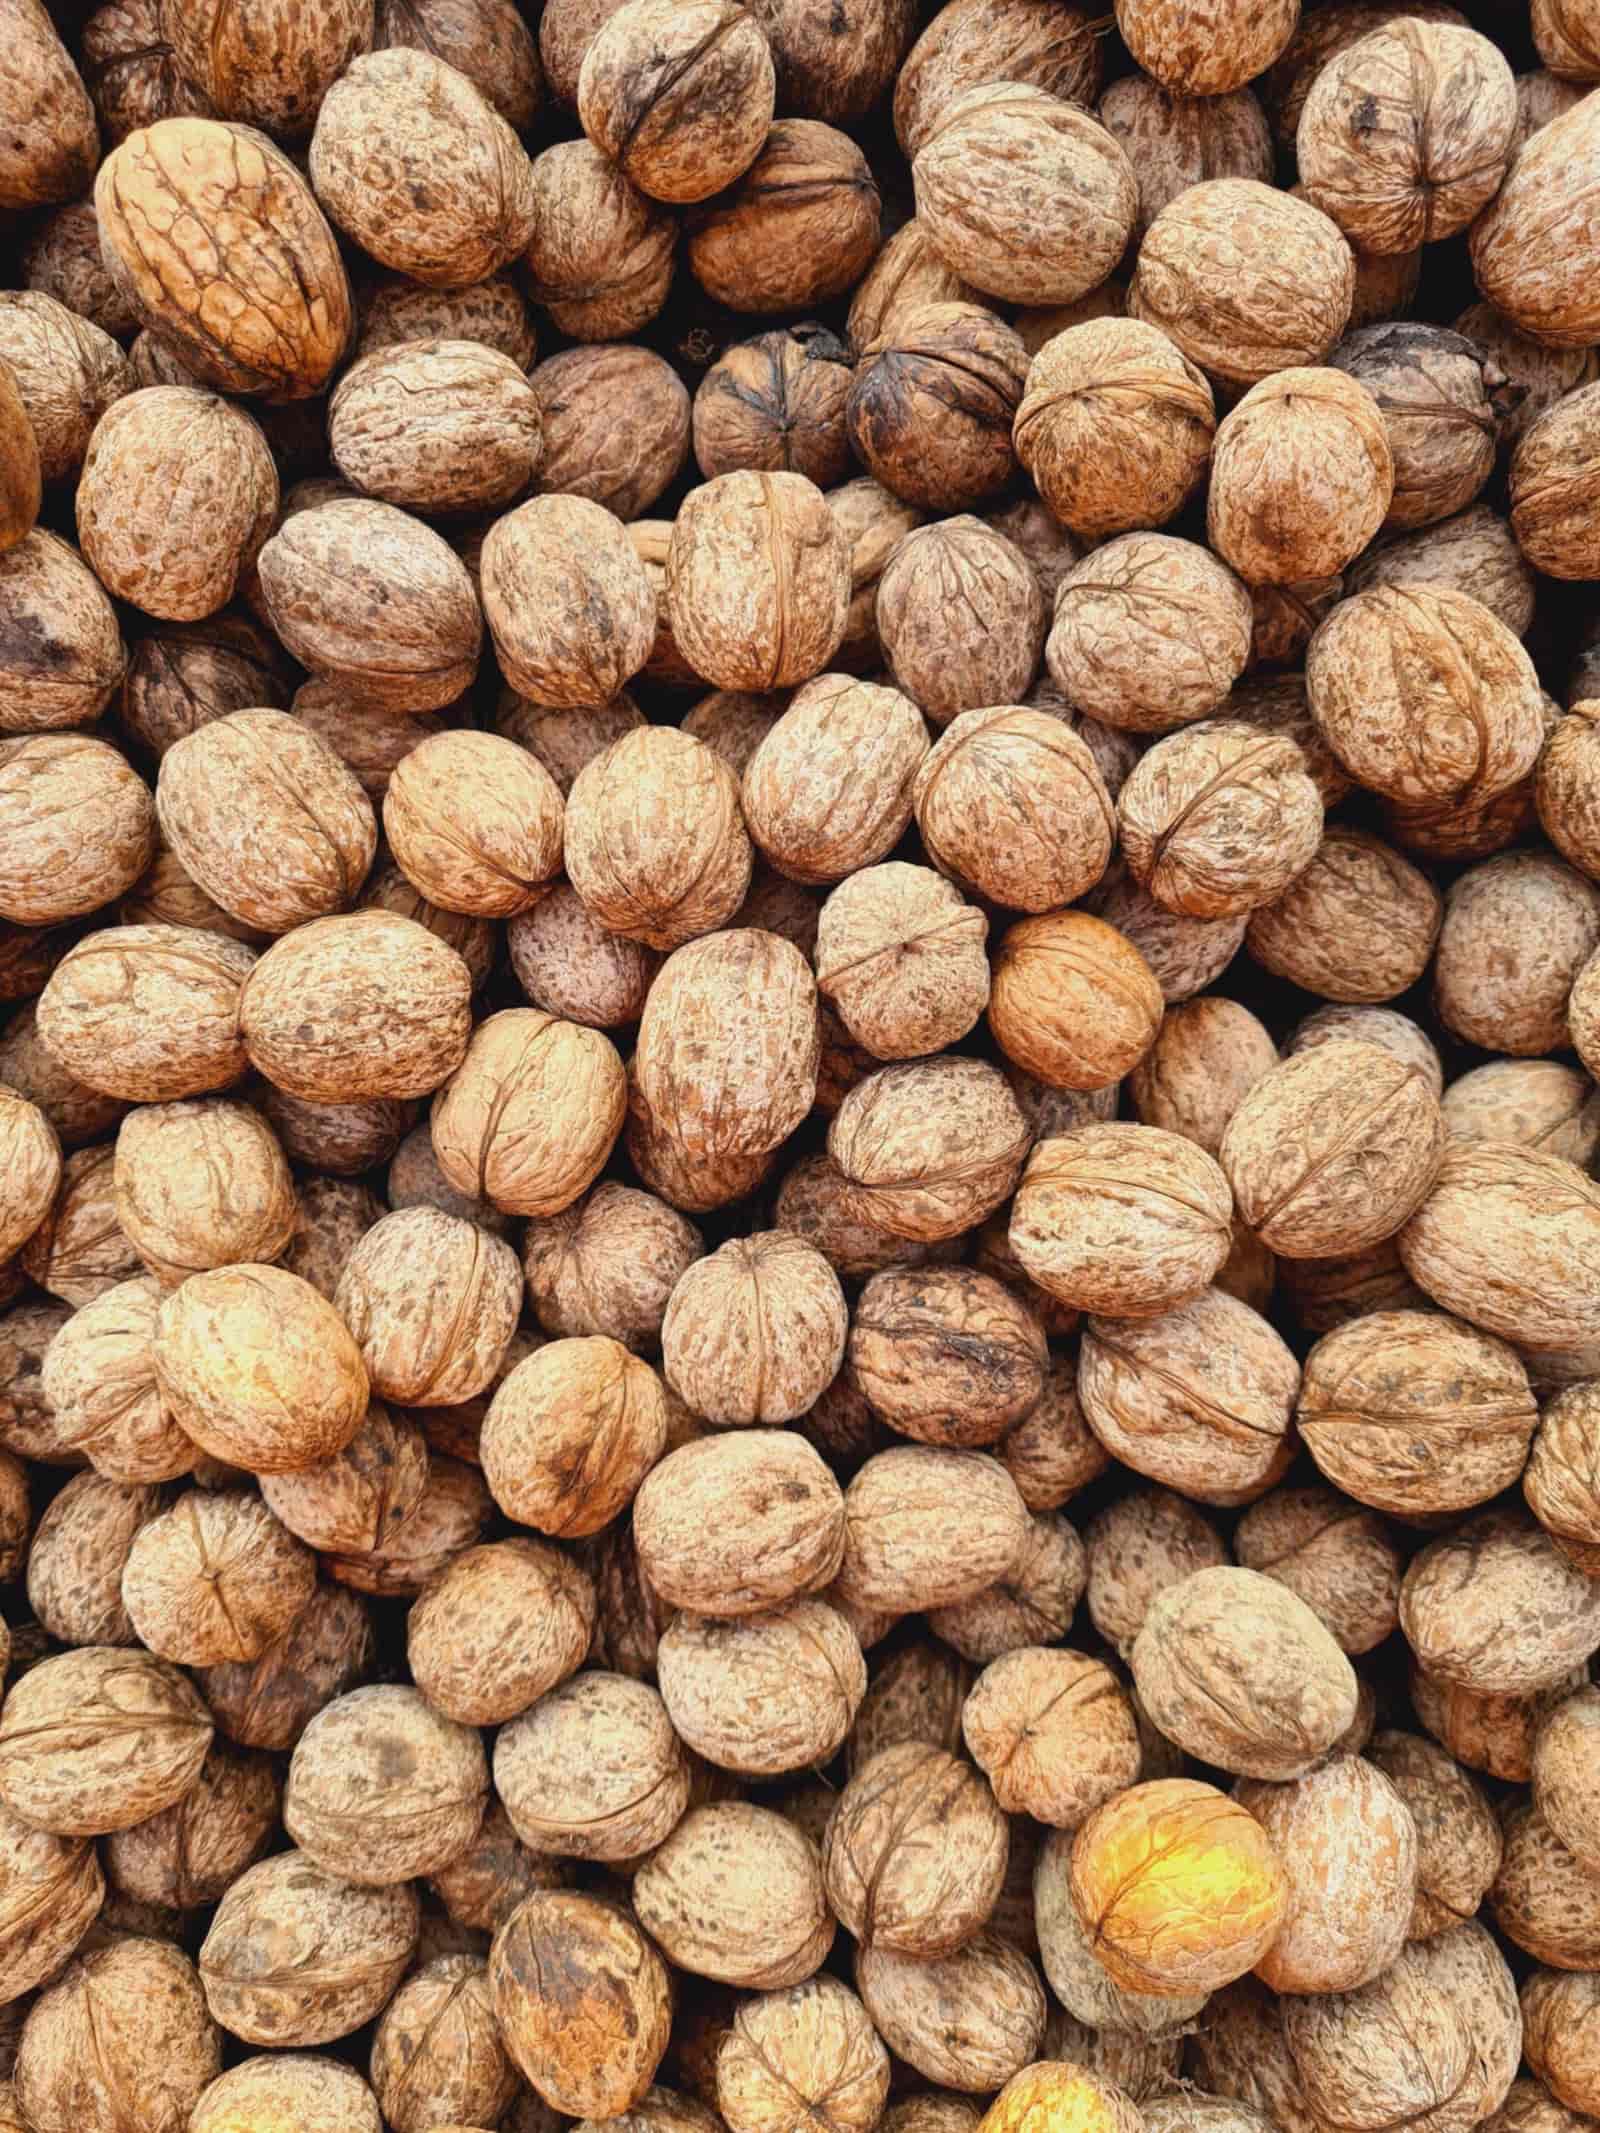 Free to importFood and farm goodsWalnuts100% basic duty, FSSAI and plant quarantine at the port. In-shell walnuts come mostly from Chile; kernels from Afghanistan.Basic duty100%IGST5%India imported 2025-26US$ 173 mn
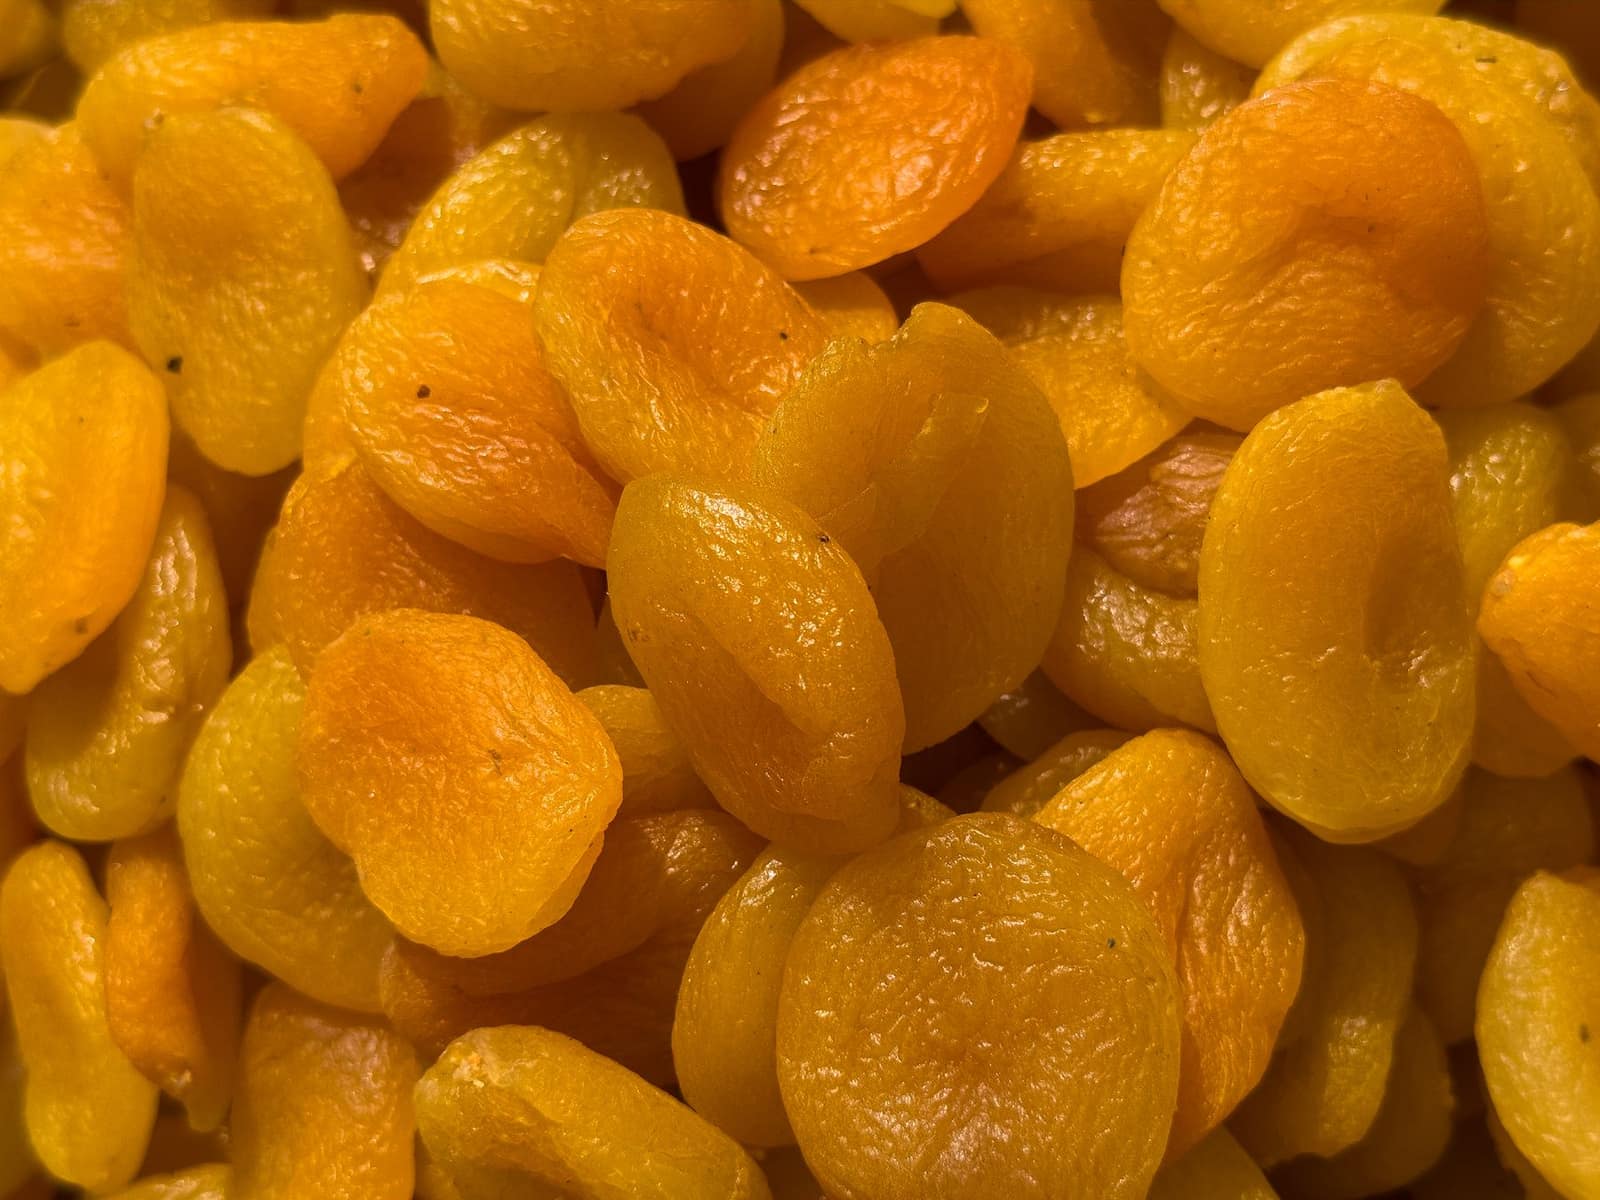 Free to importFood and farm goodsDried figs and apricots30% tariff duty, FSSAI and plant quarantine. Afghanistan supplies most of India’s dried figs and apricots.Basic duty30%IGST5%India imported 2025-26US$ 249 mn
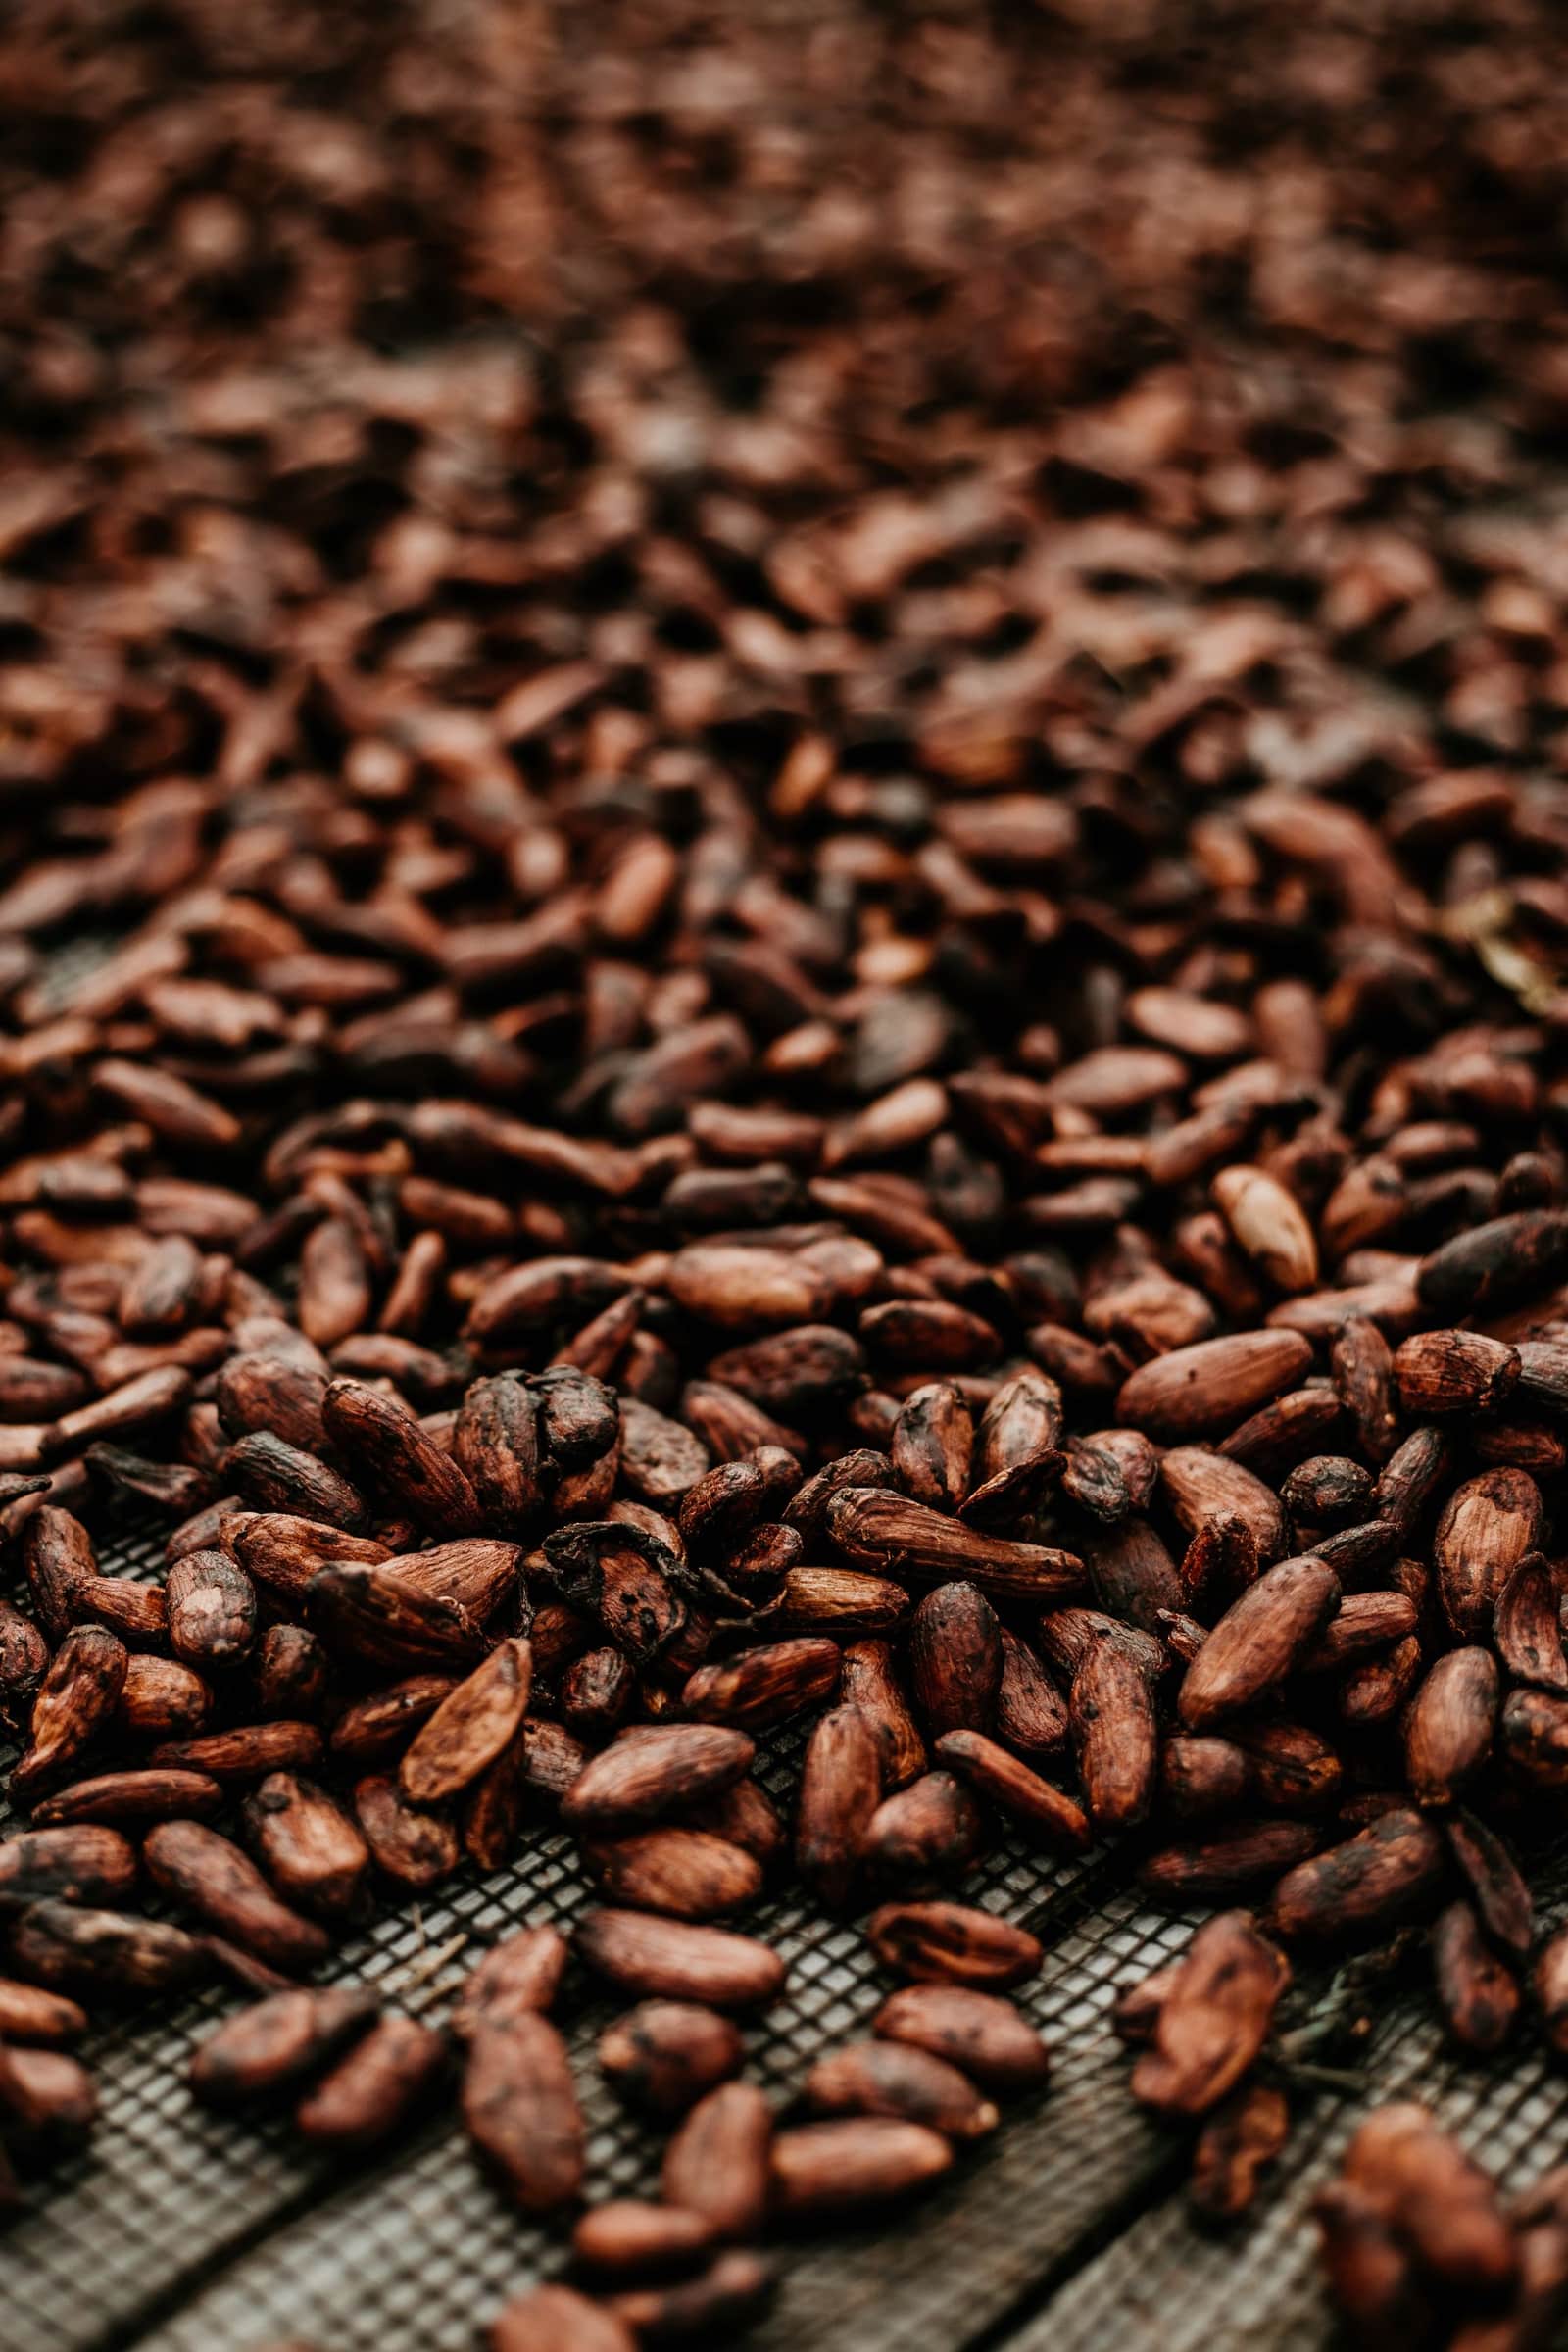 Free to importFood and farm goodsCocoa beans15% tariff duty and 5% IGST. Chocolate makers import beans from DR Congo, the Dominican Republic and Ecuador.Basic duty15%IGST5%India imported 2025-26US$ 118 mn
 Free to importFood and farm goodsWine150% total customs duty for most origins, no IGST but state excise, FSSAI labelling and state label registration.Basic duty50%IGSTNot levied (ouIndia imported 2025-26US$ 30.8 mn
 Free to importFood and farm goodsWhisky and spiritsAbout 150% customs duty for most origins; UK whisky now 75% under the India–UK CETA. No IGST, but state excise.Basic duty50–75%IGSTNot levied (ouIndia imported 2025-26US$ 691 mn
 Free to importFood and farm goodsCheeseLivestock-product permit from DAHD plus FSSAI clearance. Imports doubled in FY 2025-26, mainly from the EU.Basic dutyCheck on ICEGAIGST5%India imported 2025-26US$ 20.9 mn
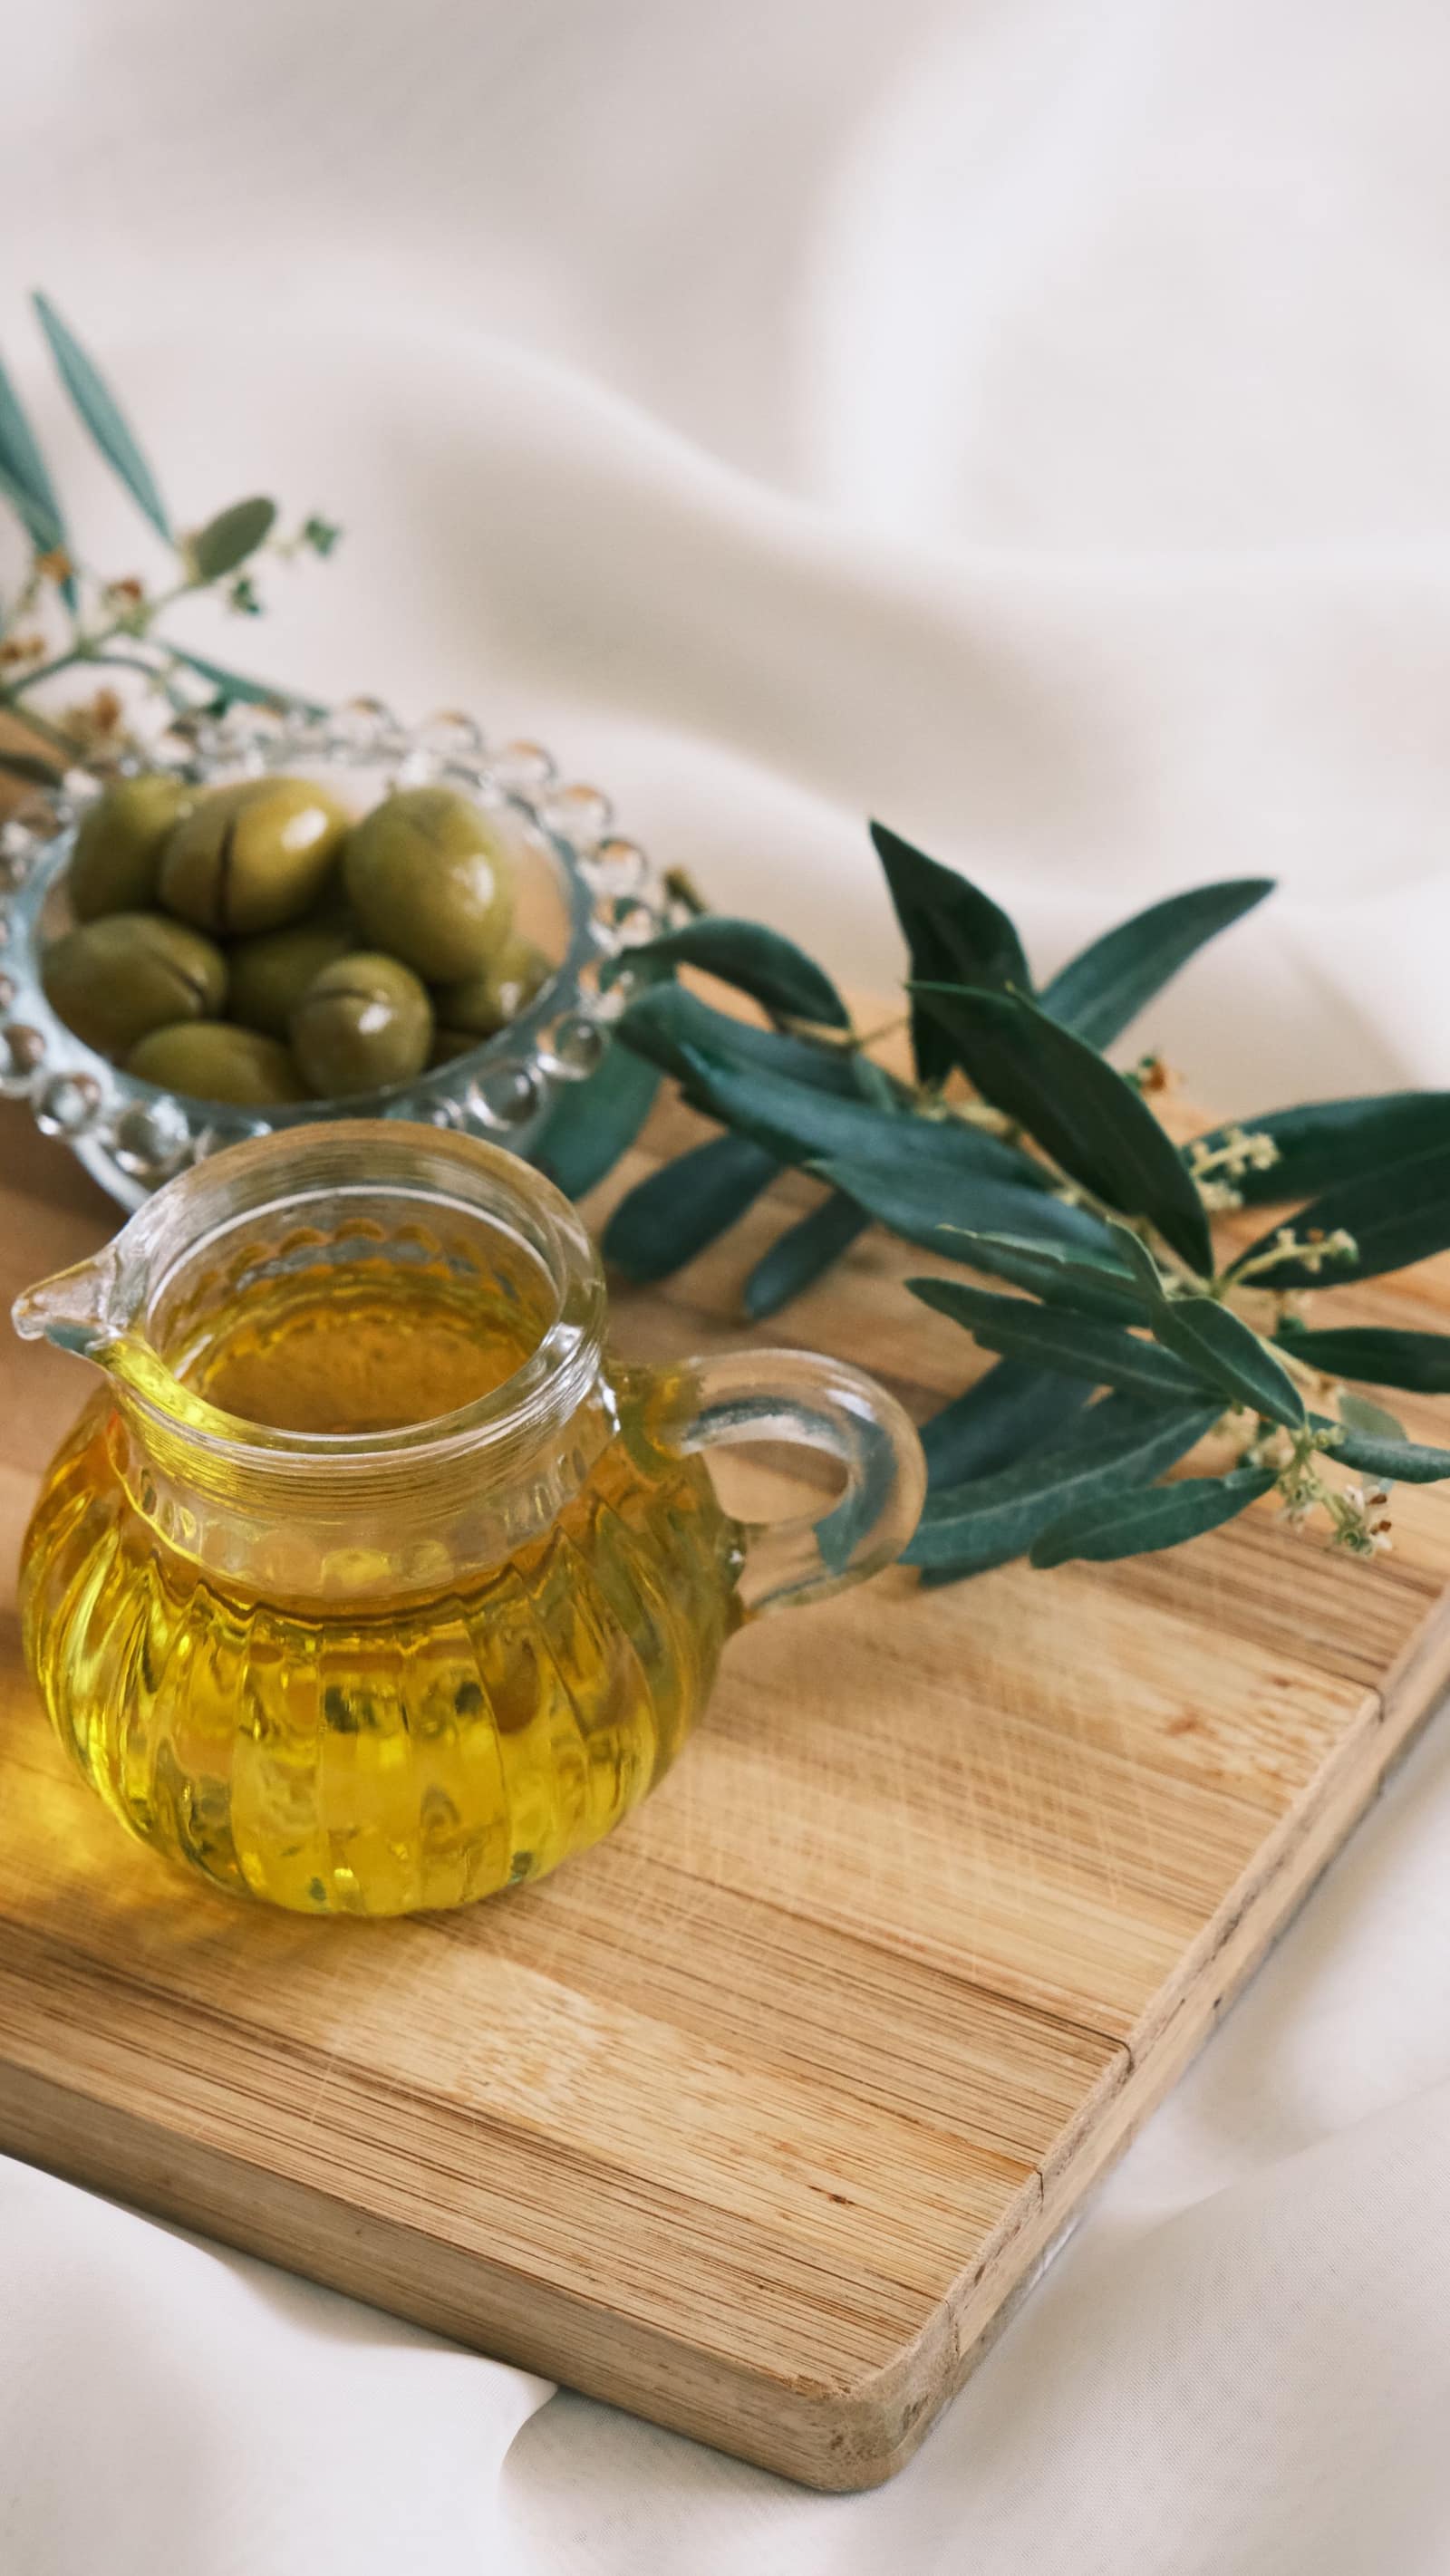 Free to importFood and farm goodsOlive oilEffective duty 35% (crude) or 40% (refined), 5% IGST, FSSAI clearance. Spain supplies almost 90%.Basic duty35–40%IGST5%India imported 2025-26US$ 36.9 mn
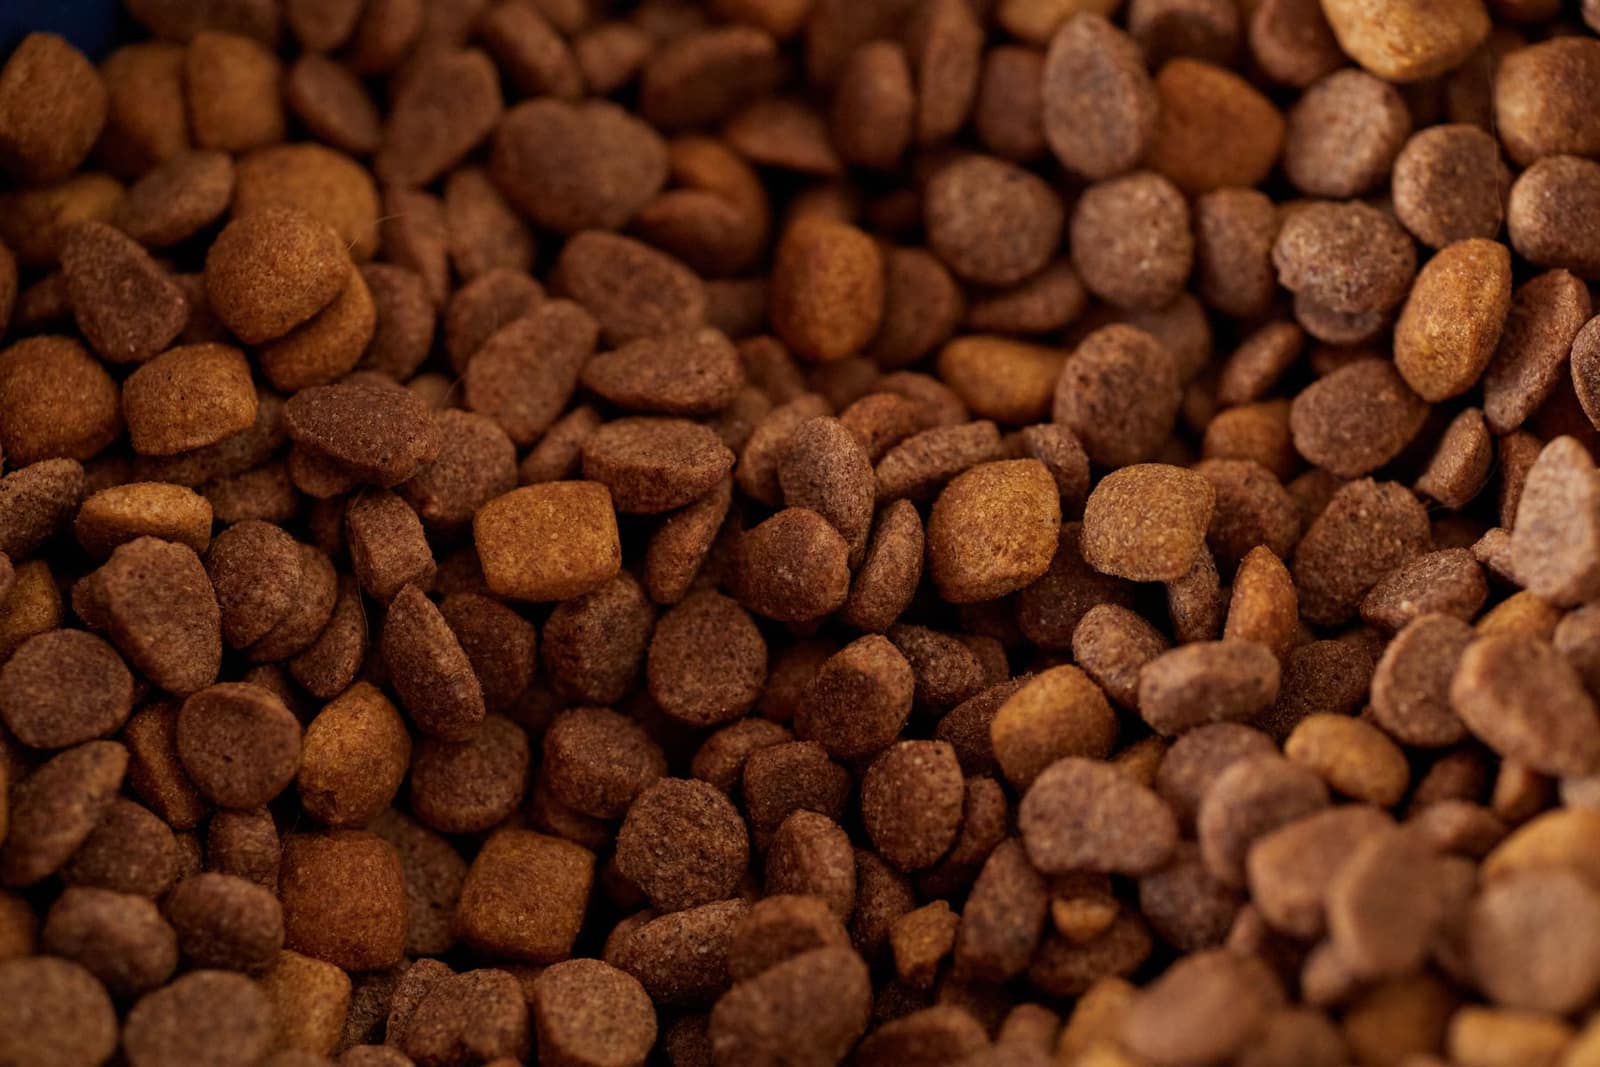 Free to importFood and farm goodsPet food20% duty, 18% IGST, and a DAHD sanitary permit for foods with animal ingredients. Thailand supplies two-thirds.Basic duty20%IGST18%India imported 2025-26US$ 141 mn
Raw materials
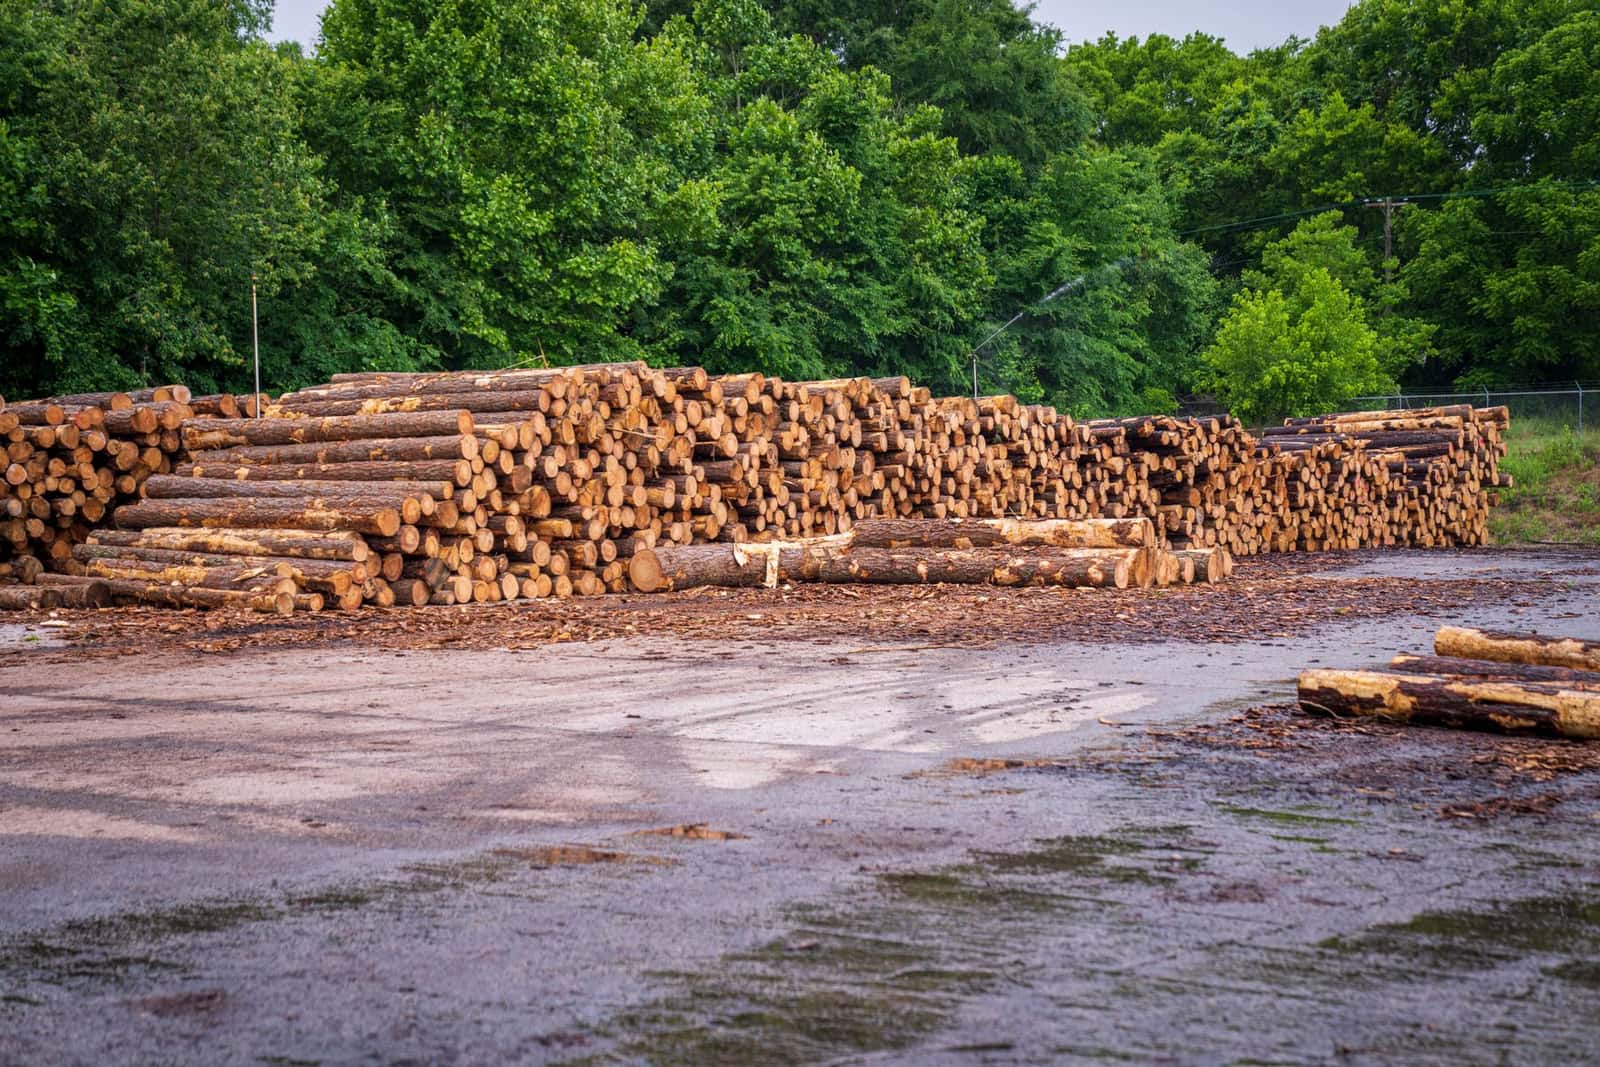 Free, with conditionsRaw materialsTimber logs5% basic duty. Plant quarantine permit and fumigation are the main hurdles. Australia, Malaysia and South America lead supply.Basic duty5%IGSTCheck on ICEGAIndia imported 2025-26US$ 1.01 bn
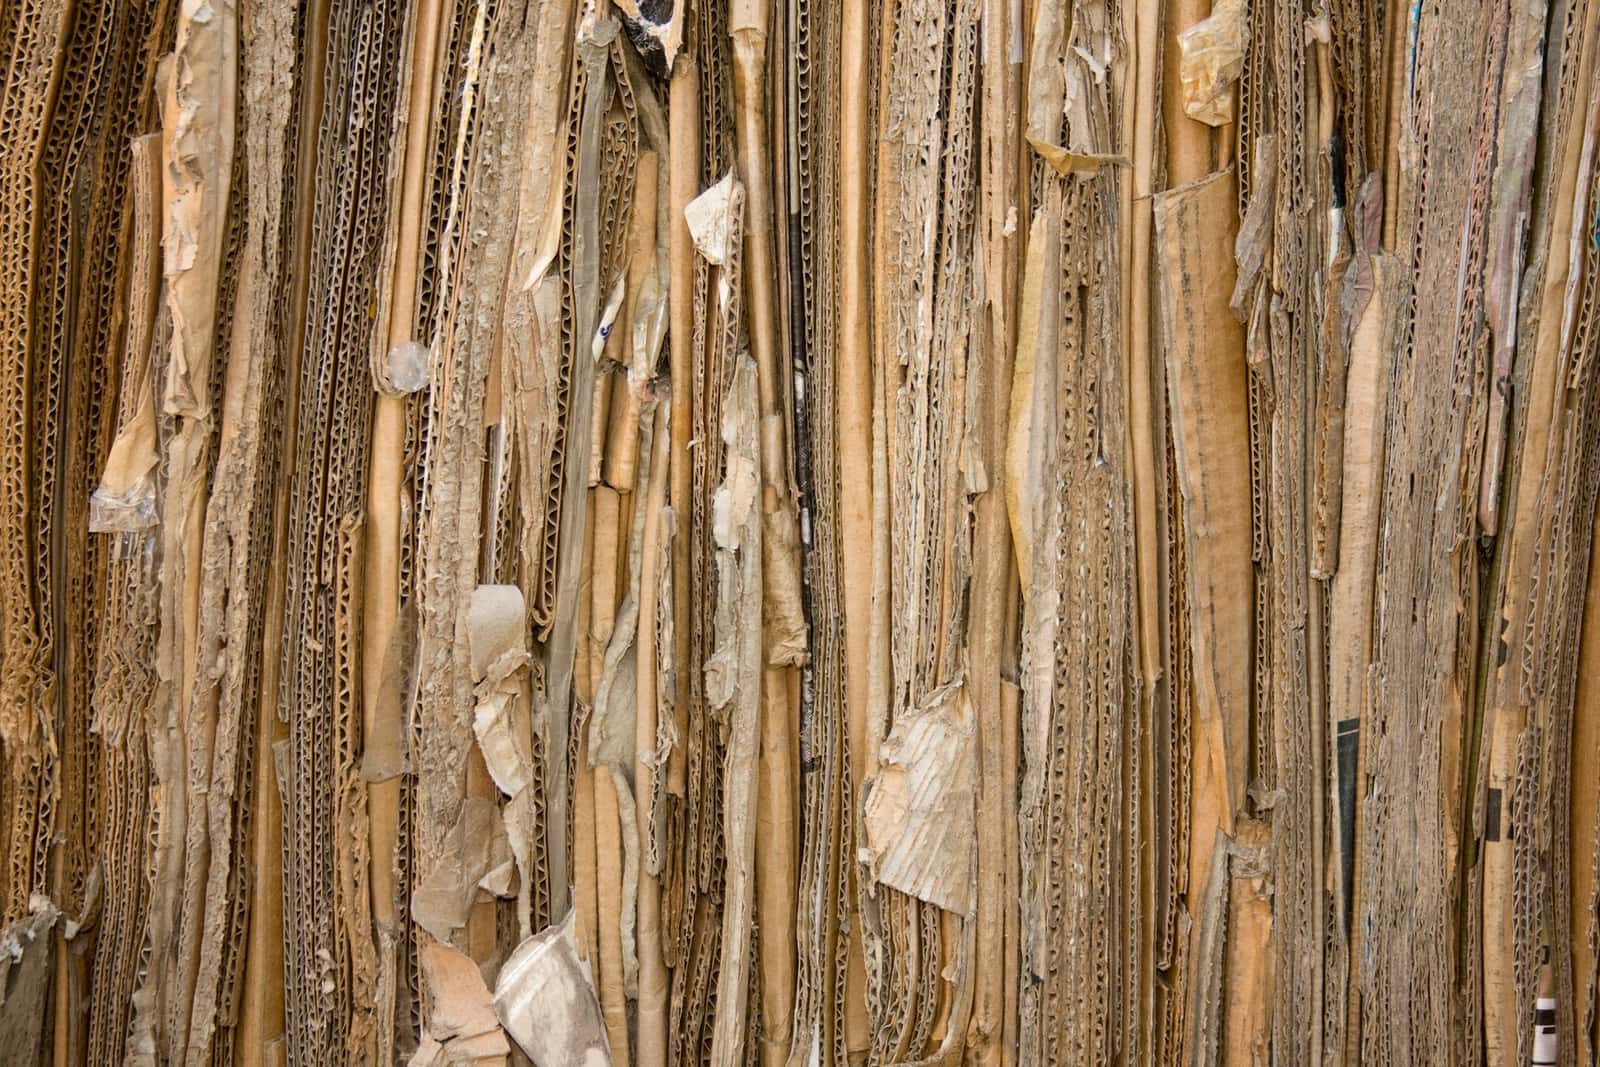 Free, with conditionsRaw materialsWaste paper (recovered paper)Raw material for paper mills. 10% tariff duty, 2.5% for paper and newsprint mills under end-use conditions.Basic duty2.5–10%IGSTCheck on ICEGAIndia imported 2025-26US$ 1.39 bn
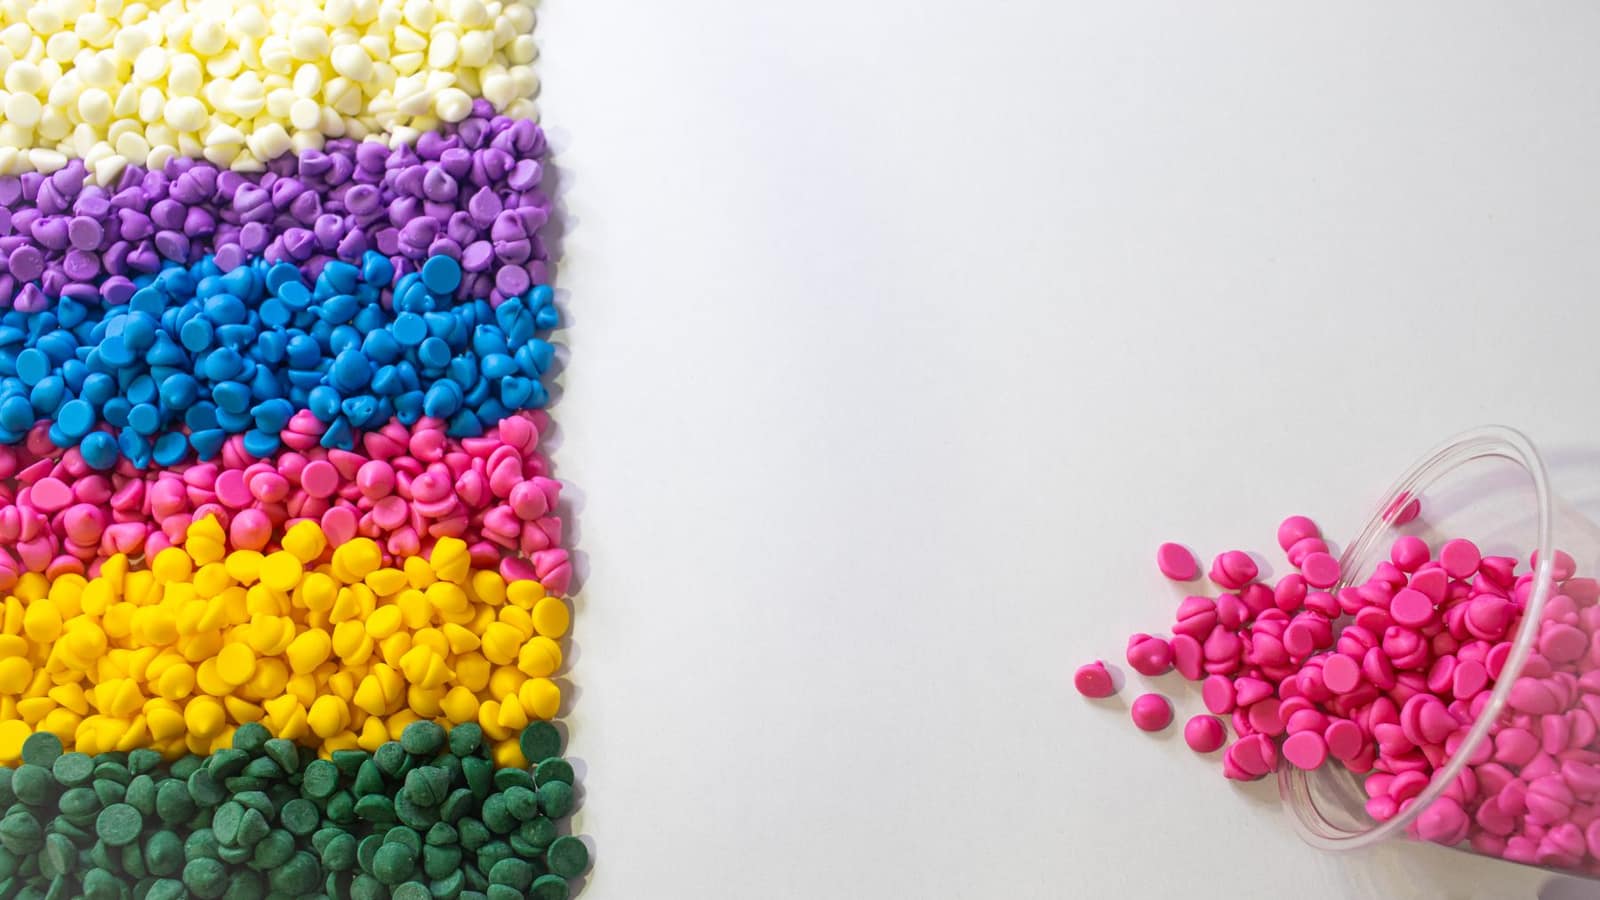 Free to importRaw materialsPlastic granules (polymers in primary forms)Mostly 7.5% basic duty. BIS quality control orders on PE, PP and PVC were withdrawn in Nov 2025. Anti-dumping duty on bottle-grade PET from China.Basic duty5–7.5%IGST18%India imported 2025-26US$ 11.6 bn
 Free, with conditionsRaw materialsSteel sheets and coils (flat-rolled)7.5% basic duty plus an 11.5% safeguard duty until 20 Apr 2027. BIS licence and SIMS registration are compulsory.Basic duty7.5–15%IGST18%India imported 2025-26US$ 2.78 bn
 Free to importRaw materialsSynthetic woven and knitted fabricsDuty is usually “20% or a fixed rupee amount, whichever is higher”. China supplies more than half.Basic duty10–20%IGST5%India imported 2025-26US$ 757 mn
 Free, with conditionsRaw materialsCoal2.5% basic duty, 18% IGST, compulsory CIMS registration. India imported about US$ 26.7 billion of coal in FY 2025-26.Basic duty2.5%IGST18%India imported 2025-26US$ 26.7 bn
 Free, with conditionsRaw materialsCopper scrap2.5% basic duty, 18% IGST, NFMIMS registration and a pre-shipment inspection certificate. USA and Saudi Arabia lead.Basic duty2.5%IGST18%India imported 2025-26US$ 3.43 bn
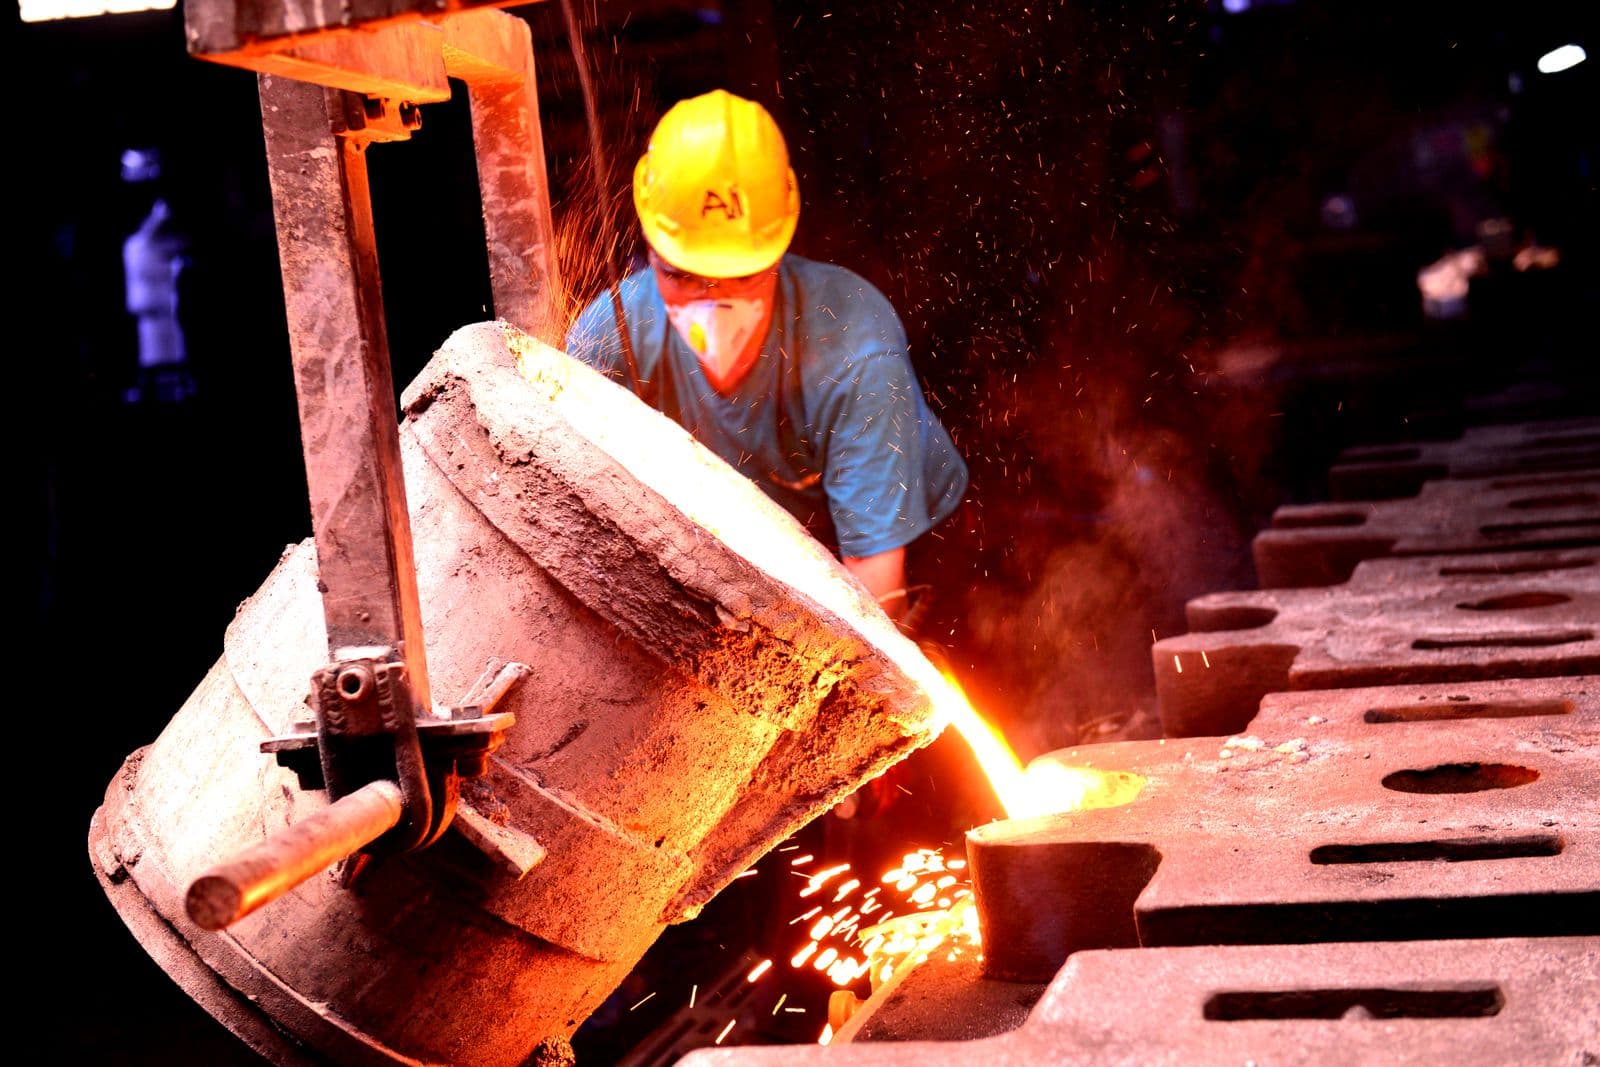 Free, with conditionsRaw materialsAluminium scrap2.5% basic duty, 18% IGST, pre-shipment inspection. India imported about US$ 4.6 billion in FY 2025-26.Basic duty2.5%IGST18%India imported 2025-26US$ 4.55 bn
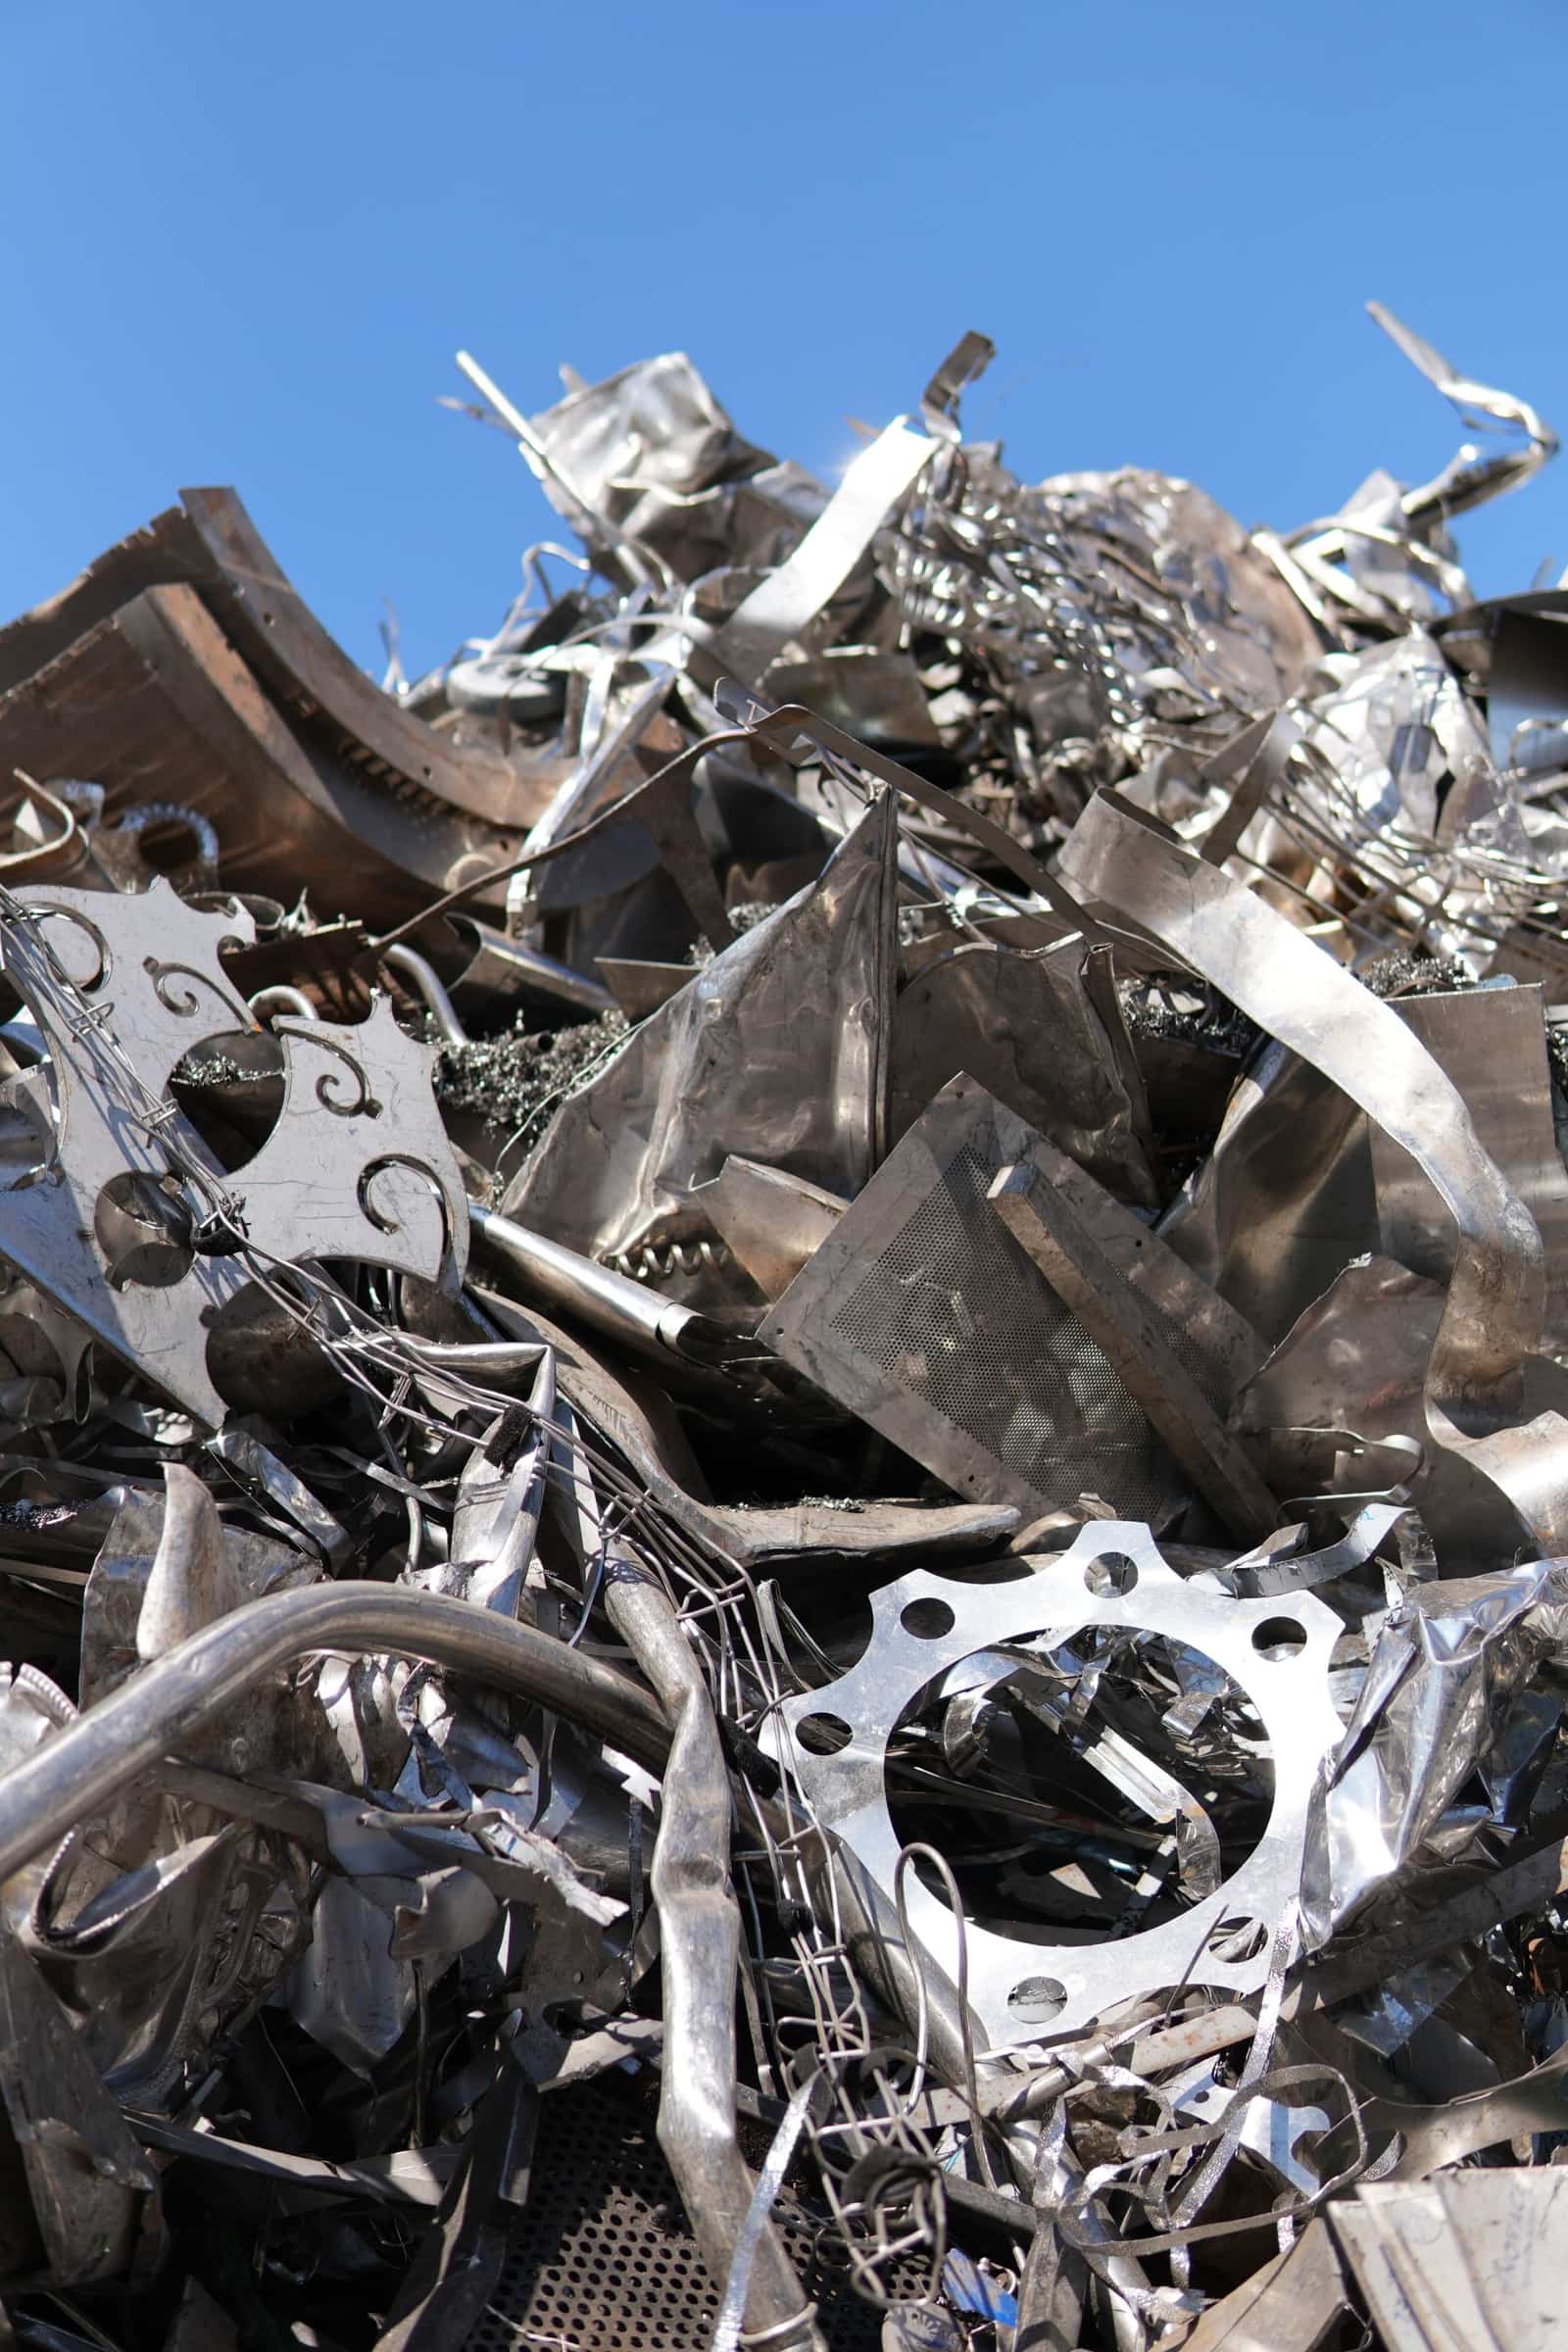 Free, with conditionsRaw materialsSteel scrapNil basic duty until 31 Mar 2028, 18% IGST, pre-shipment inspection certificate. About US$ 4.6 billion imported in FY 2025-26.Basic dutyNilIGST18%India imported 2025-26US$ 4.56 bn
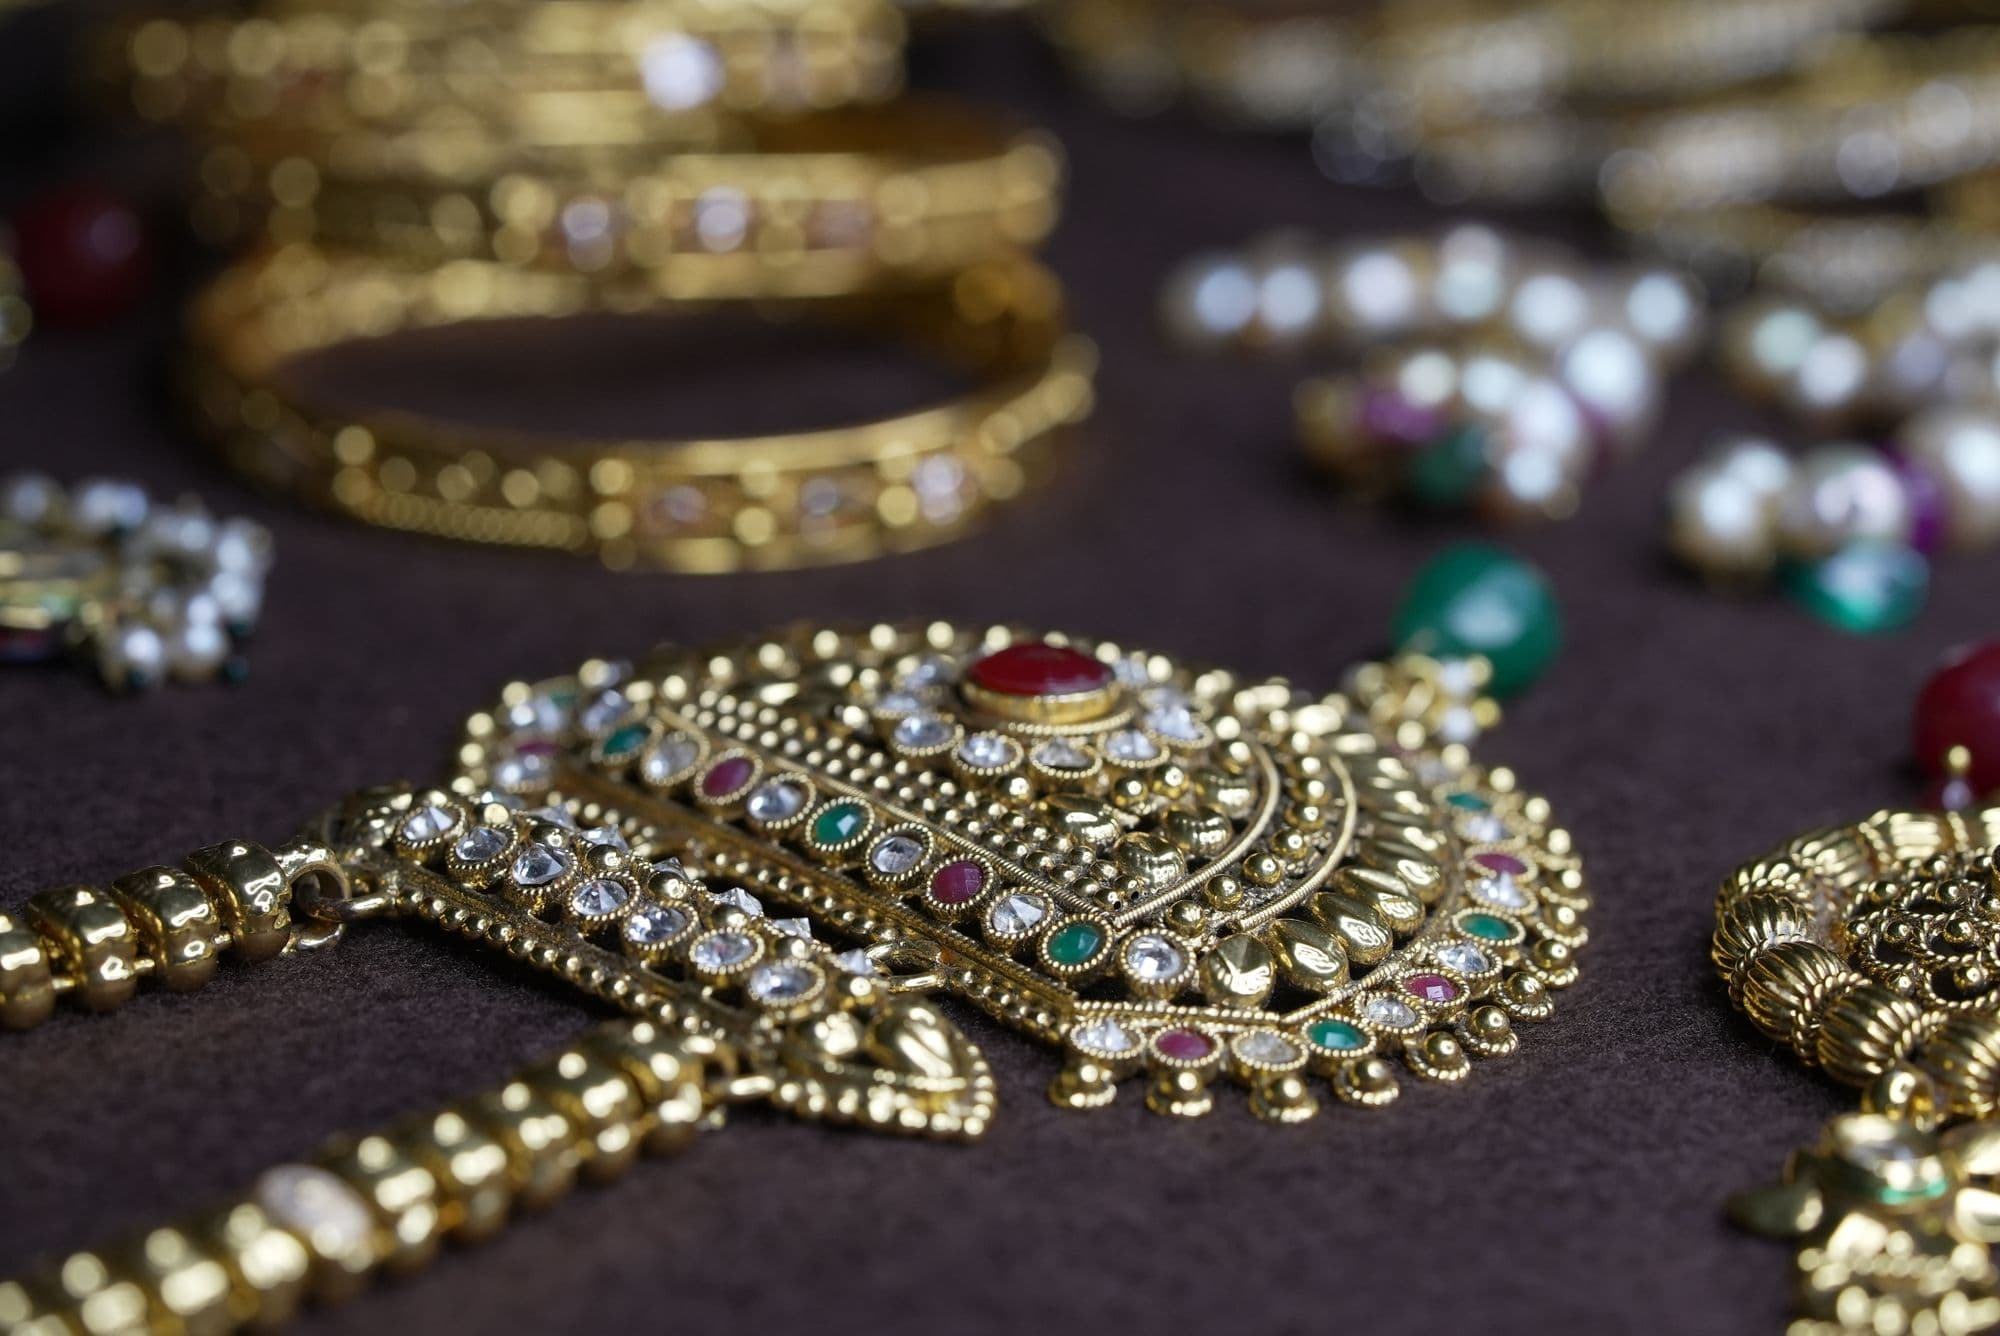 Free, with conditionsRaw materialsRough diamondsNil customs duty, 0.25% IGST, and a Kimberley Process certificate with every parcel. About US$ 10.6 billion imported in FY 2025-26.Basic dutyNilIGST0.25%India imported 2025-26US$ 10.6 bn
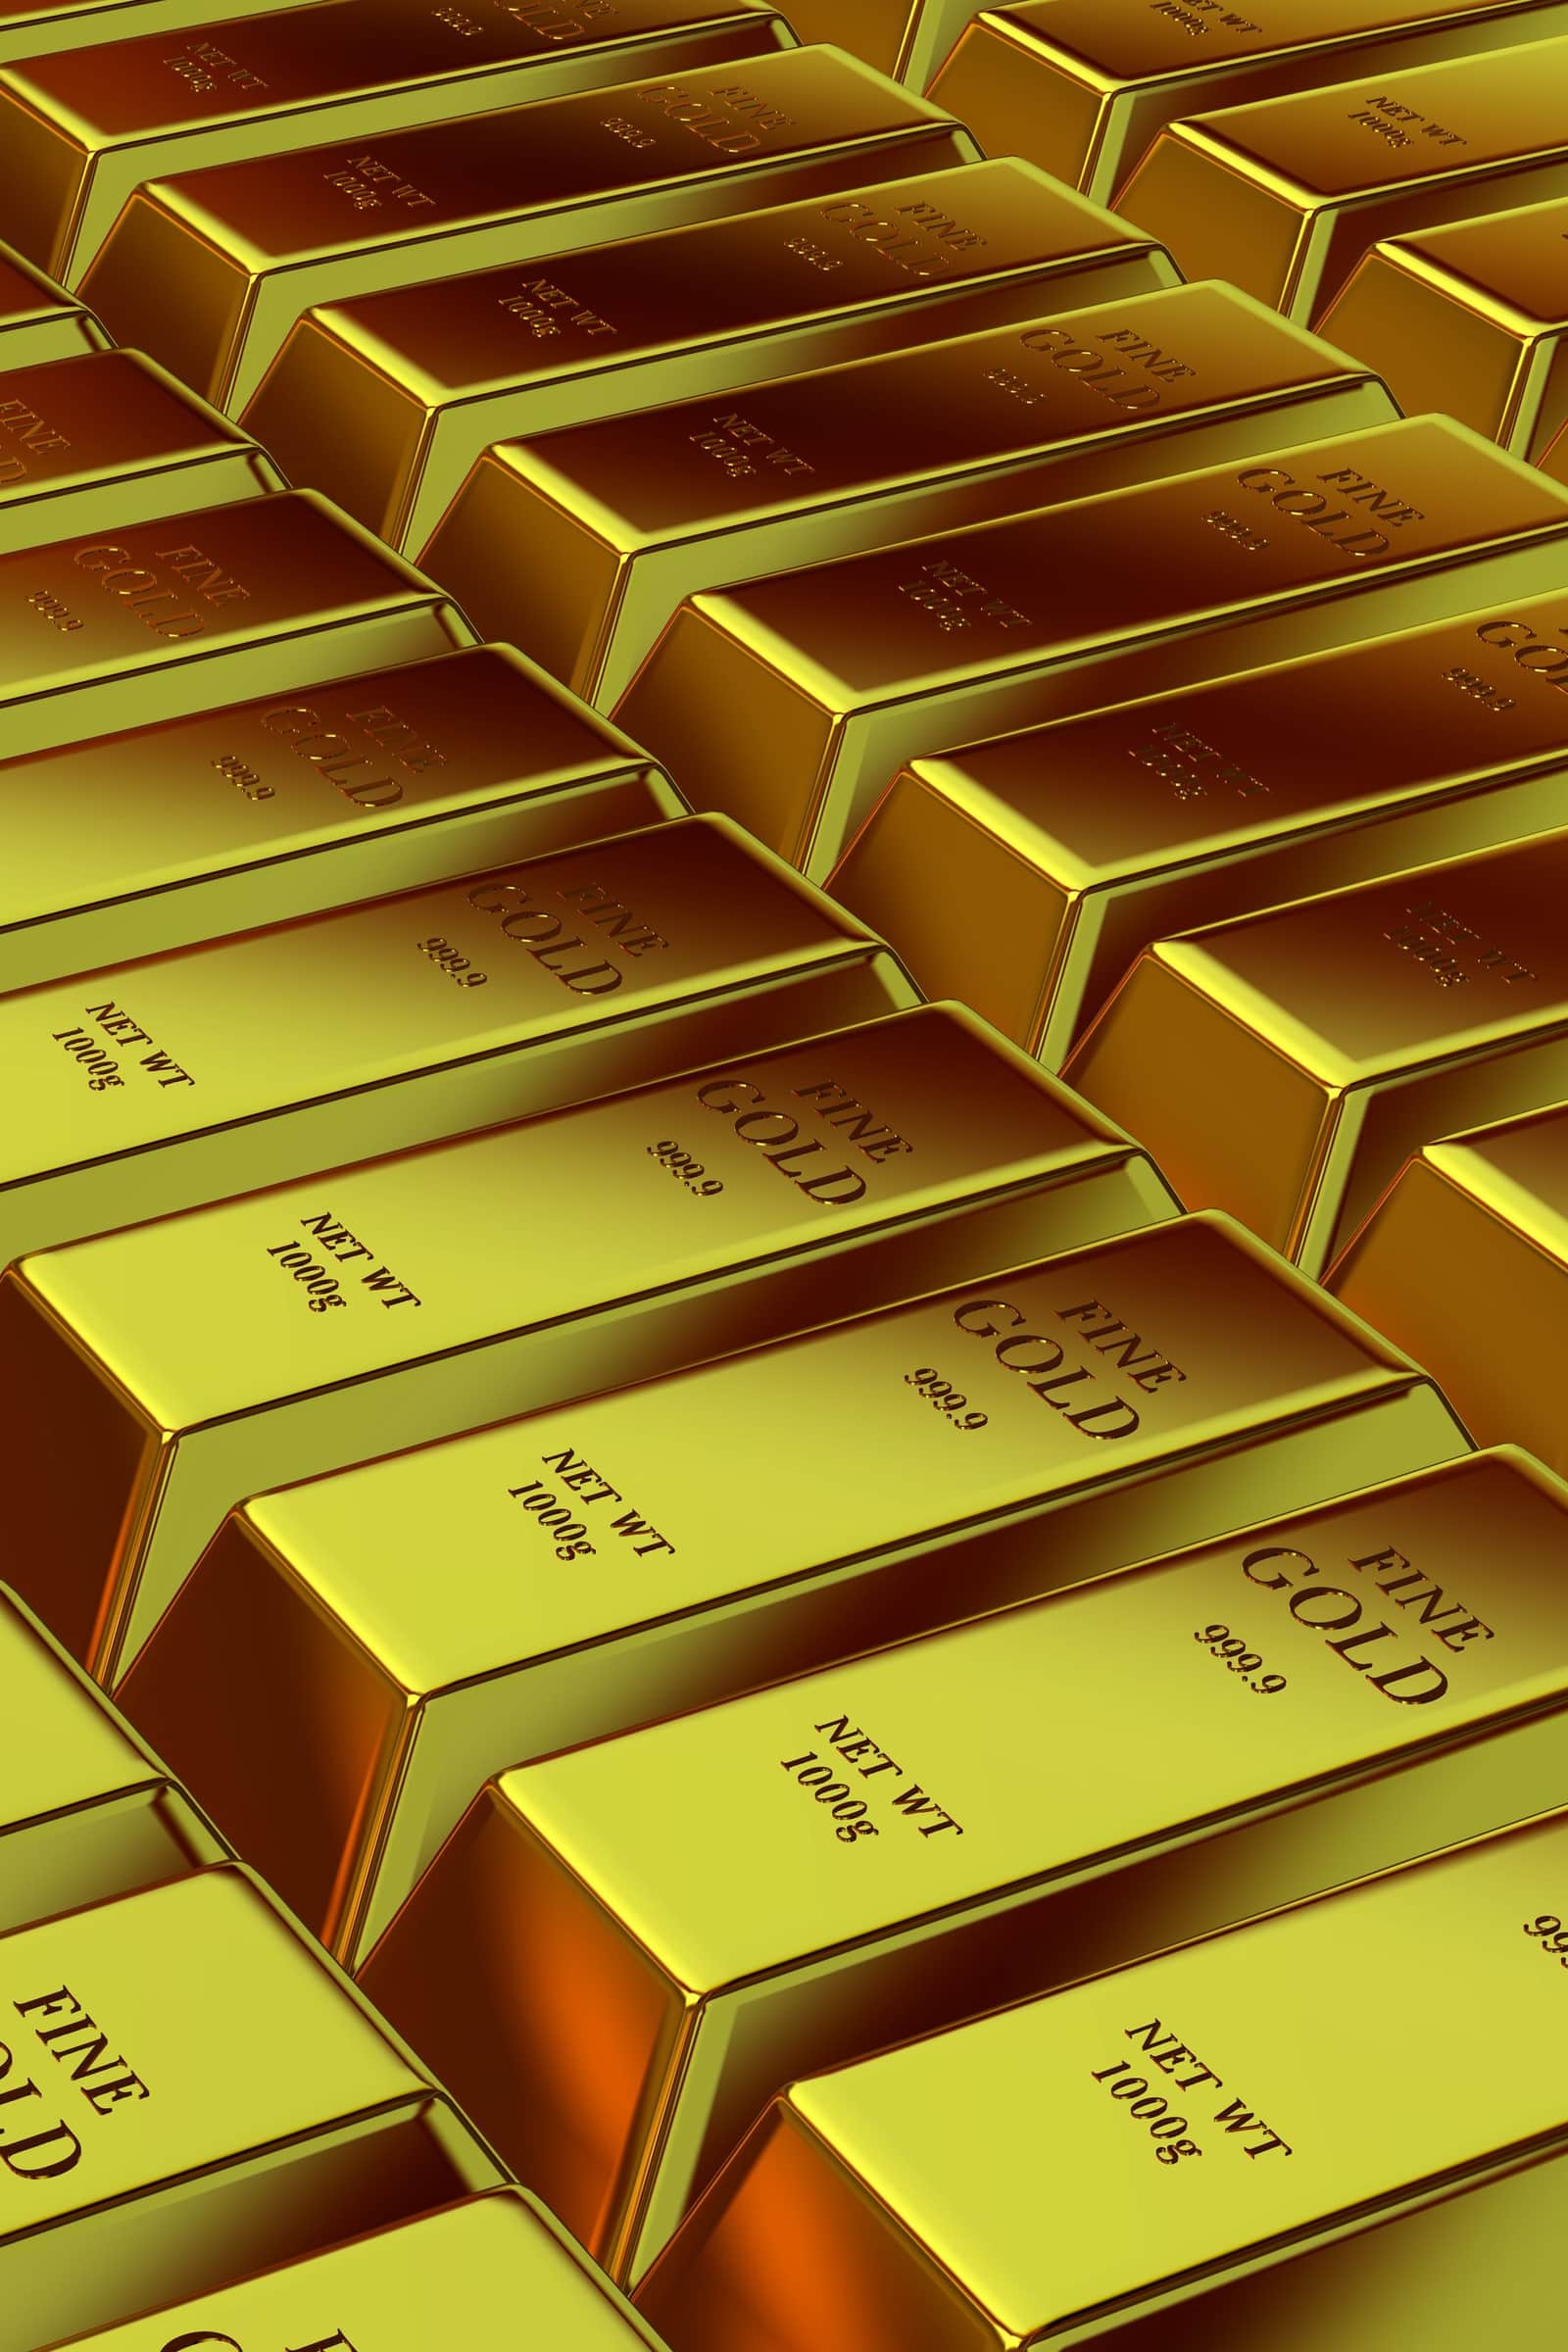 Restricted — authorisation neededRaw materialsGoldRestricted: only nominated agencies, banks and IFSCA-qualified jewellers can import. 5% BCD + 1% AIDC, 3% IGST.Basic duty5%IGST3%India imported 2025-26US$ 72 bn
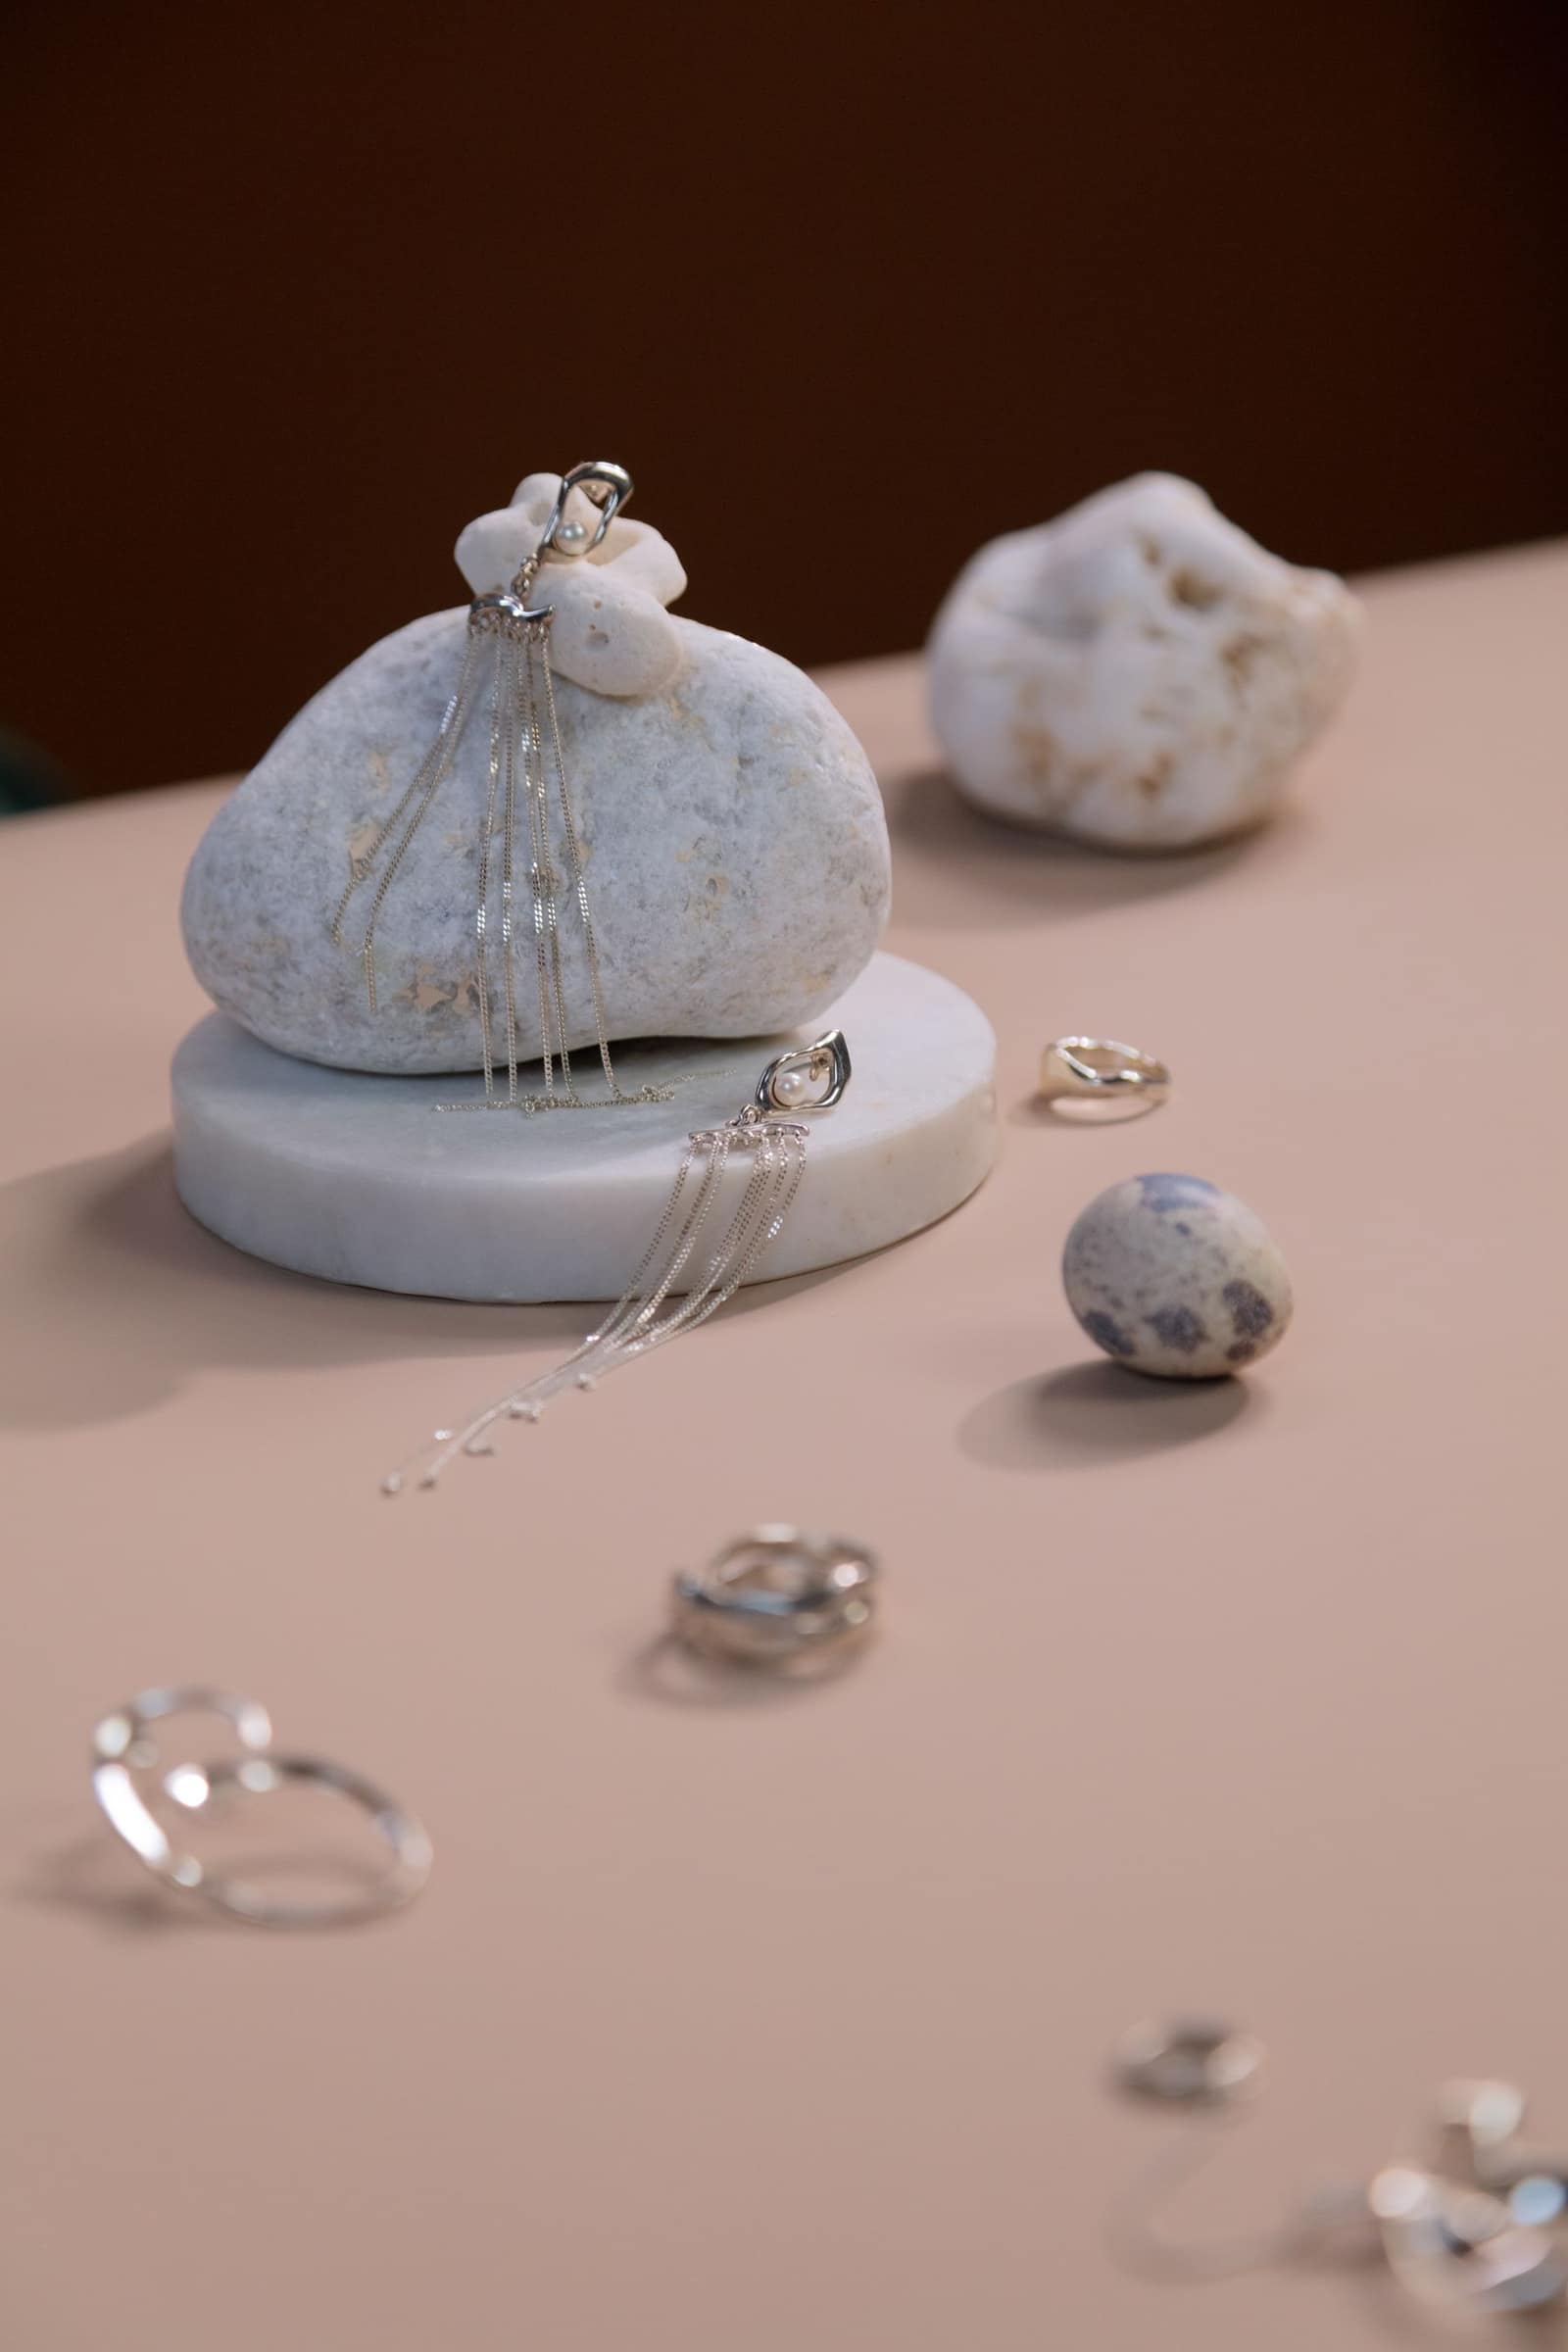 Free, with conditionsRaw materialsSilver5% BCD + 1% AIDC, 3% IGST. Imports jumped to about US$ 12 billion in FY 2025-26, mainly from the UK and Hong Kong.Basic duty5%IGST3%India imported 2025-26US$ 12.1 bn
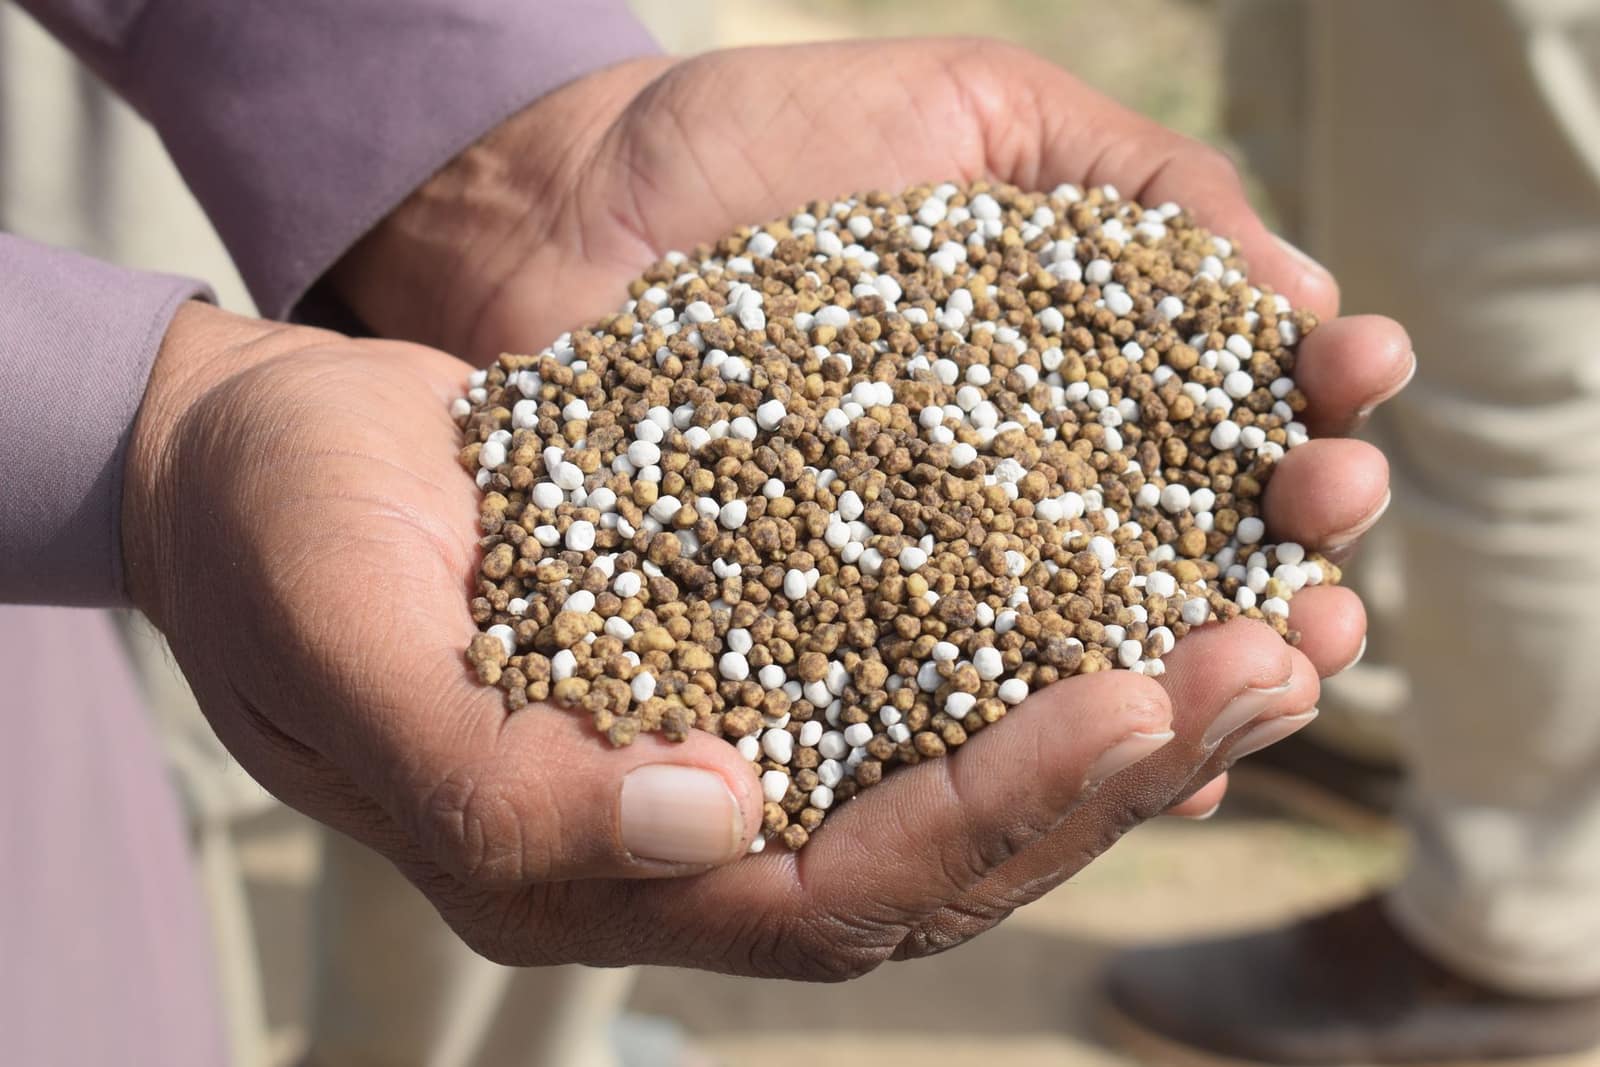 Through a state trading bodyRaw materialsFertilisers (urea, DAP, NPK)Urea is imported only through state trading enterprises; DAP and NPK are free. Nil or low duty, 5% IGST.Basic duty2.5–5%IGST5%India imported 2025-26US$ 12.6 bn
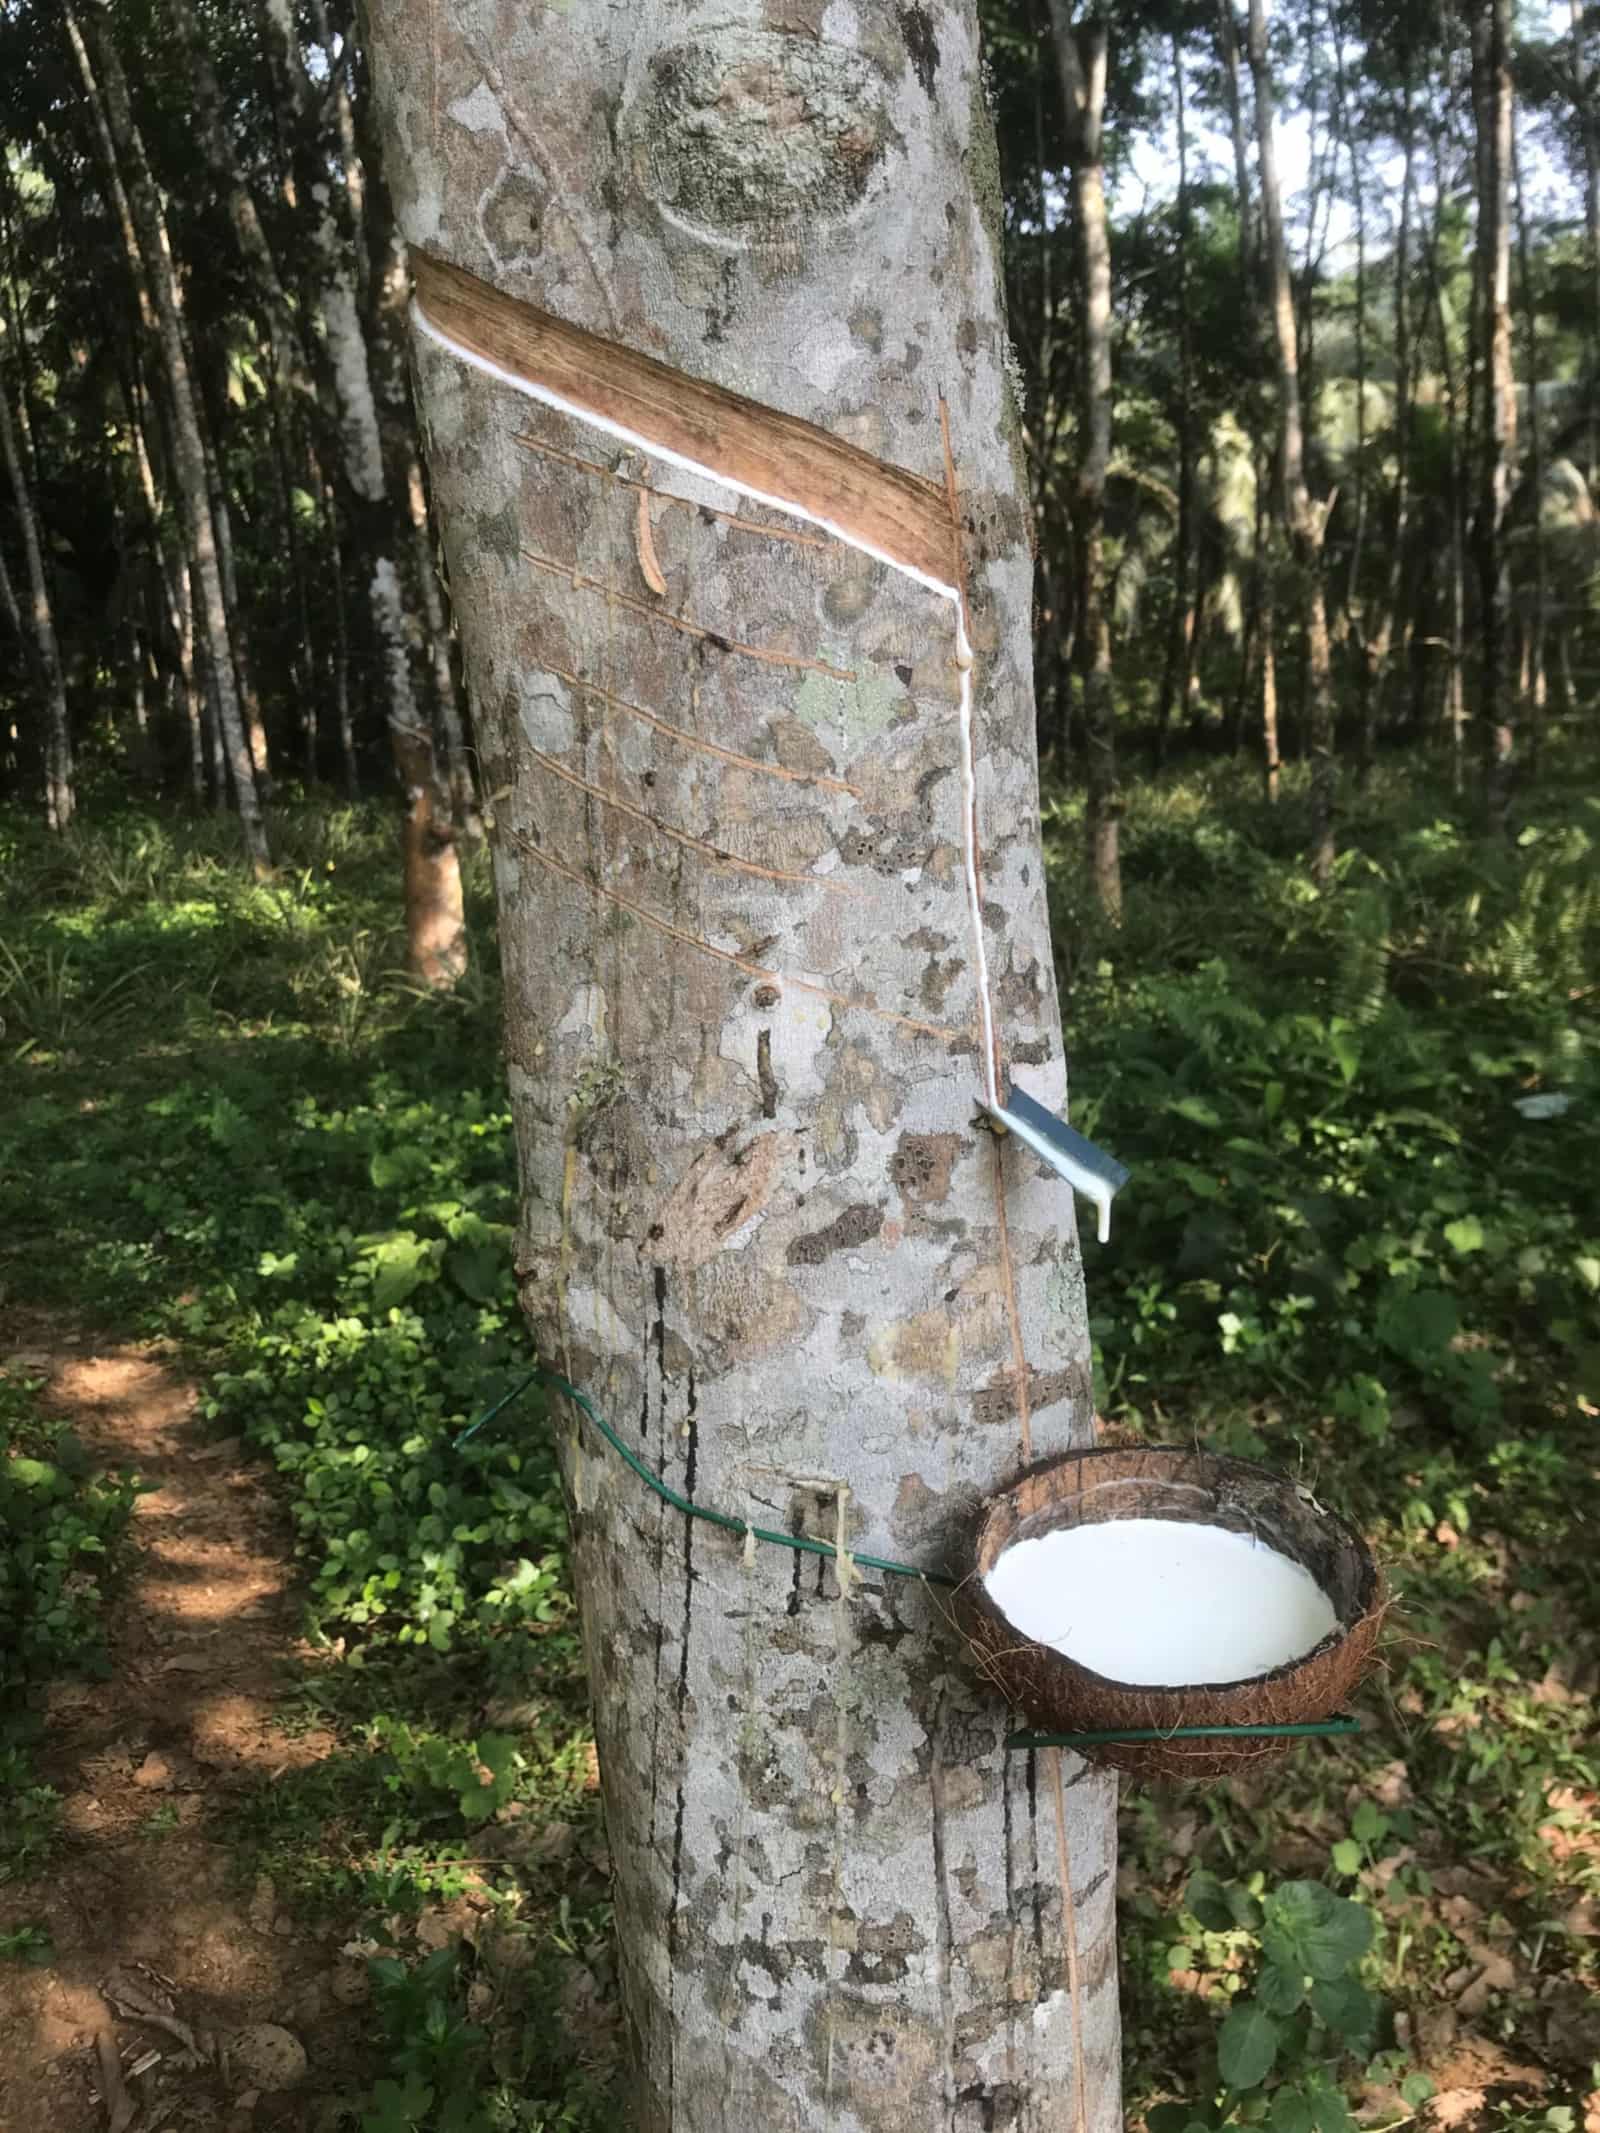 Free to importRaw materialsNatural rubberDry rubber pays 25% or Rs 30 per kg, whichever is lower; latex 70%. 5% IGST. Côte d’Ivoire and Indonesia lead supply.Basic duty25–70%IGST5%India imported 2025-26US$ 893 mn
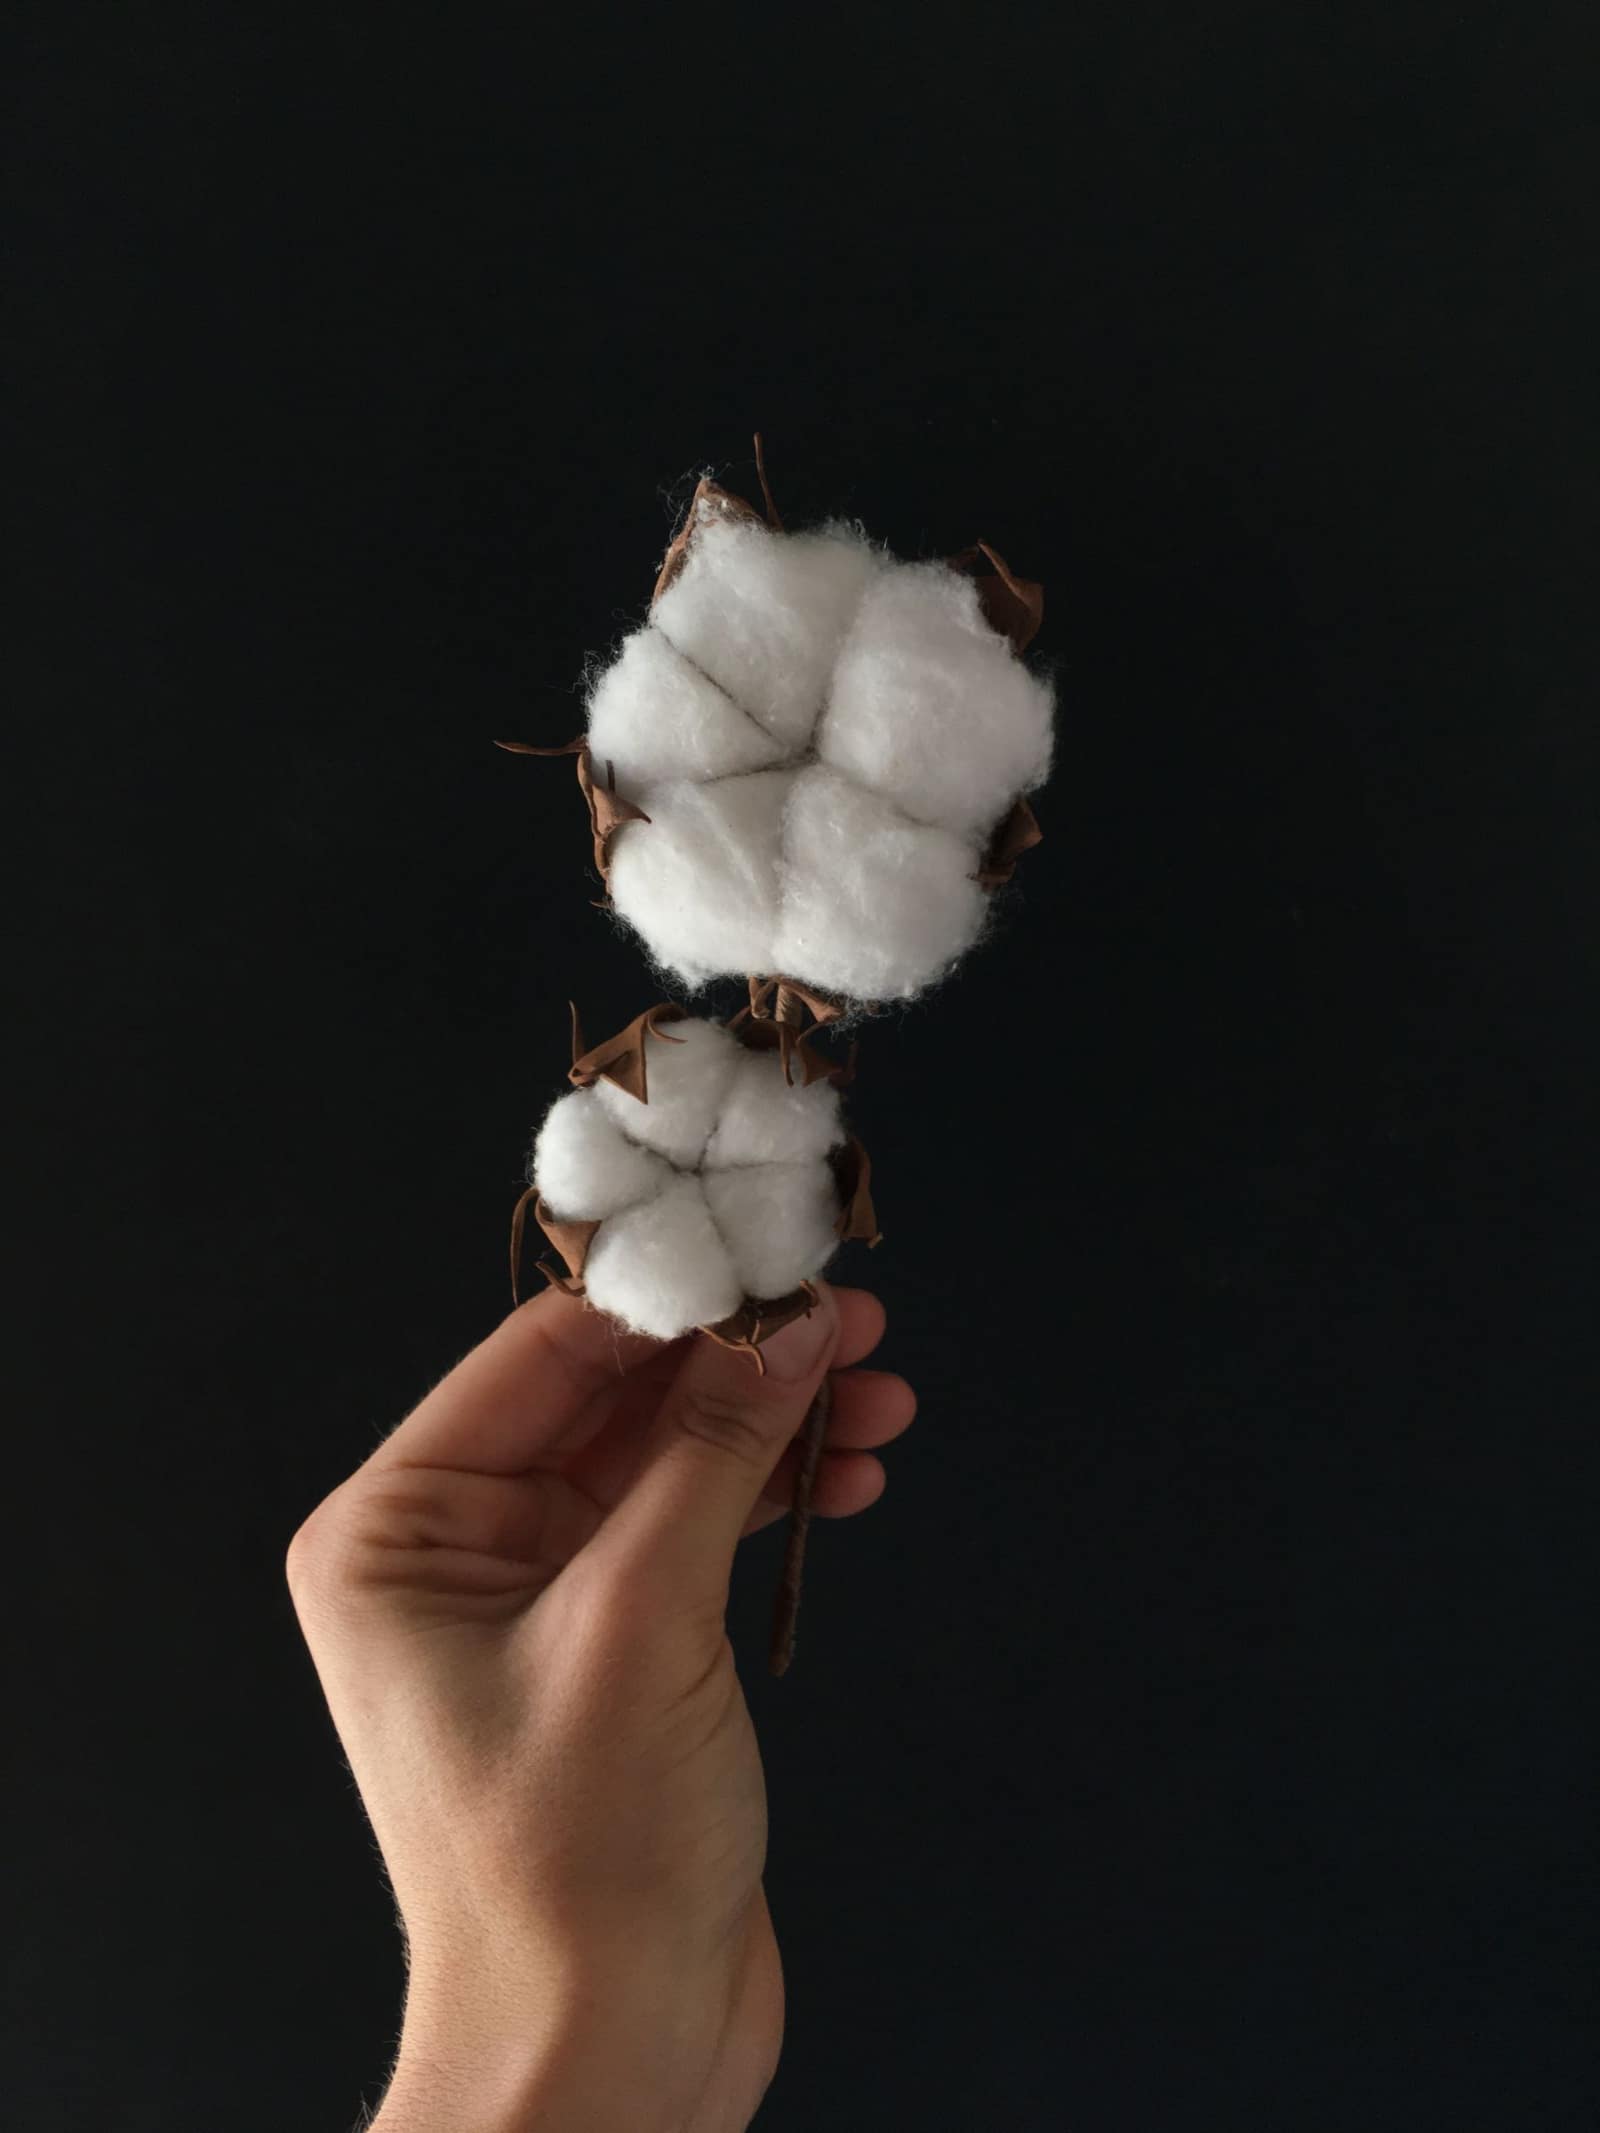 Free to importRaw materialsRaw cottonSpinning mills import long-staple cotton; duty is 5% BCD plus 5% AIDC, apart from temporary exemption windows.Basic duty5%IGST5%India imported 2025-26US$ 1.86 bn
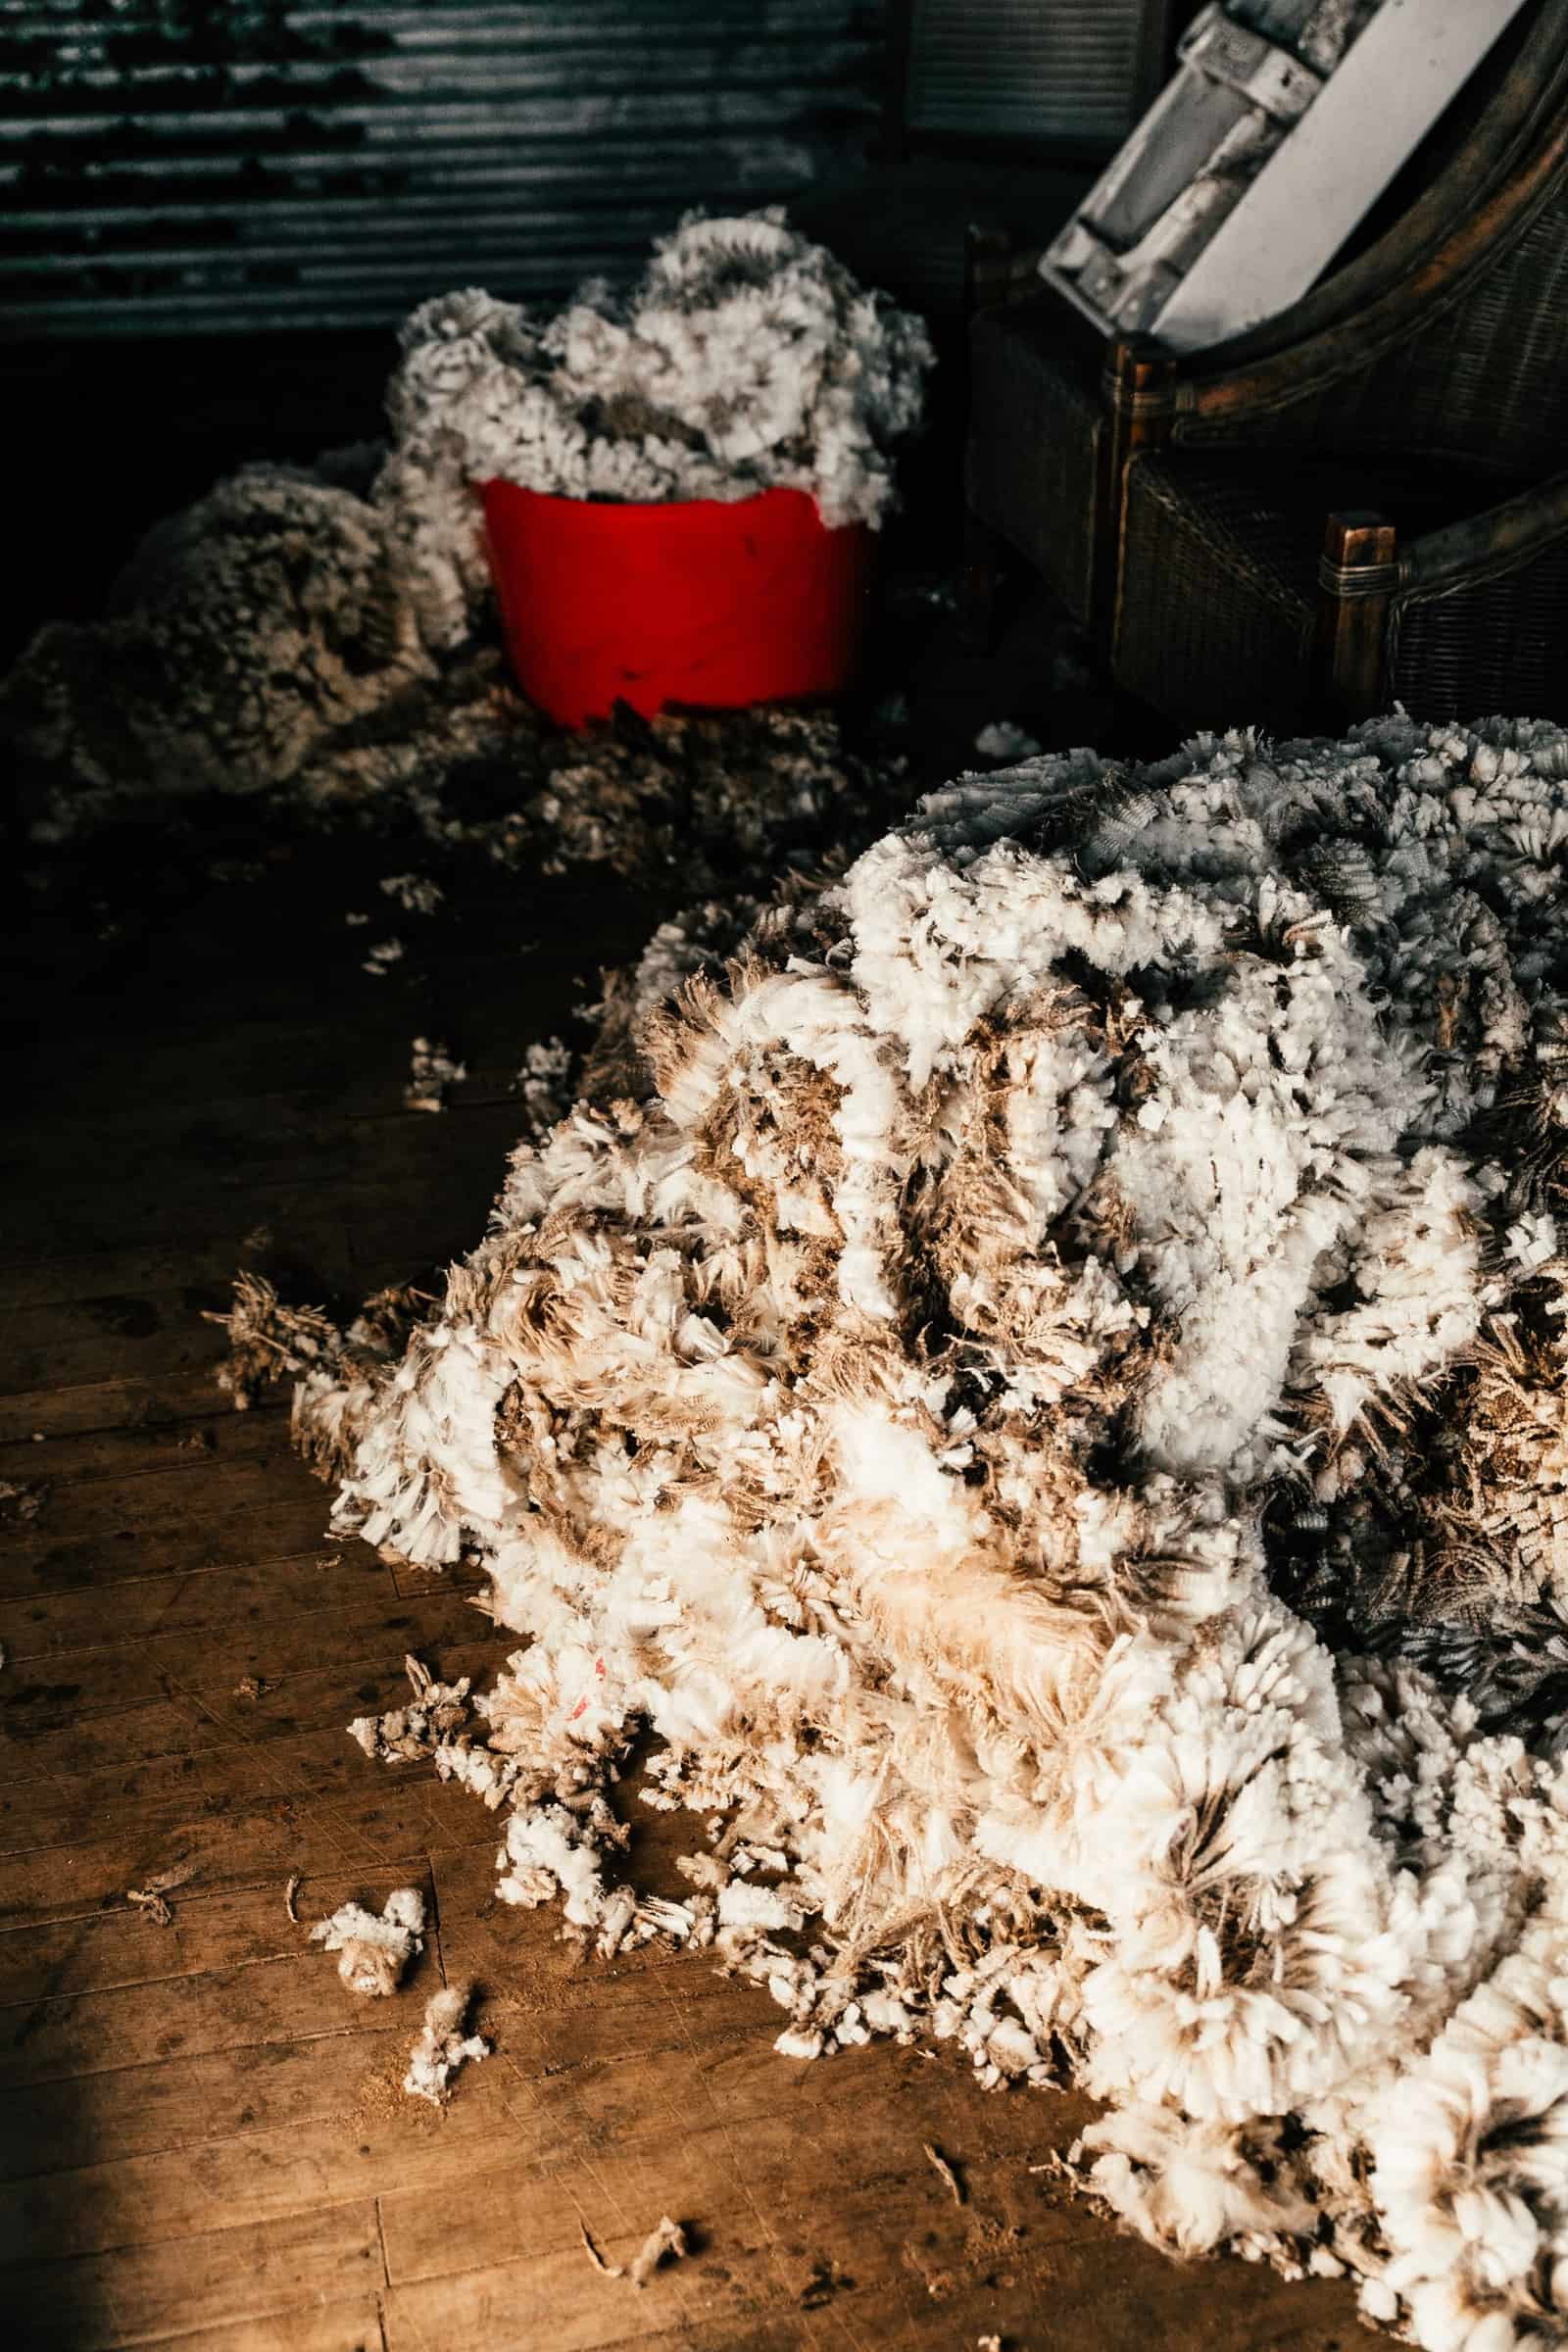 Free to importRaw materialsRaw woolWoollen mills import fine wool mainly from Australia and New Zealand; BCD is 2.5% and animal-product checks apply.Basic duty2.5%IGSTNilIndia imported 2025-26US$ 231 mn
 Free to importRaw materialsWood pulpPaper, tissue and hygiene-product makers import kraft pulp; 5% BCD, nil for paper and paperboard makers under end-use rules.Basic duty2.5–5%IGST5%India imported 2025-26US$ 863 mn
 Free to importRaw materialsMethanolBulk chemical imported mostly from Gulf producers; 2.5% BCD and 18% IGST, with hazardous-chemical rules.Basic duty2.5%IGST18%India imported 2025-26US$ 1.09 bn
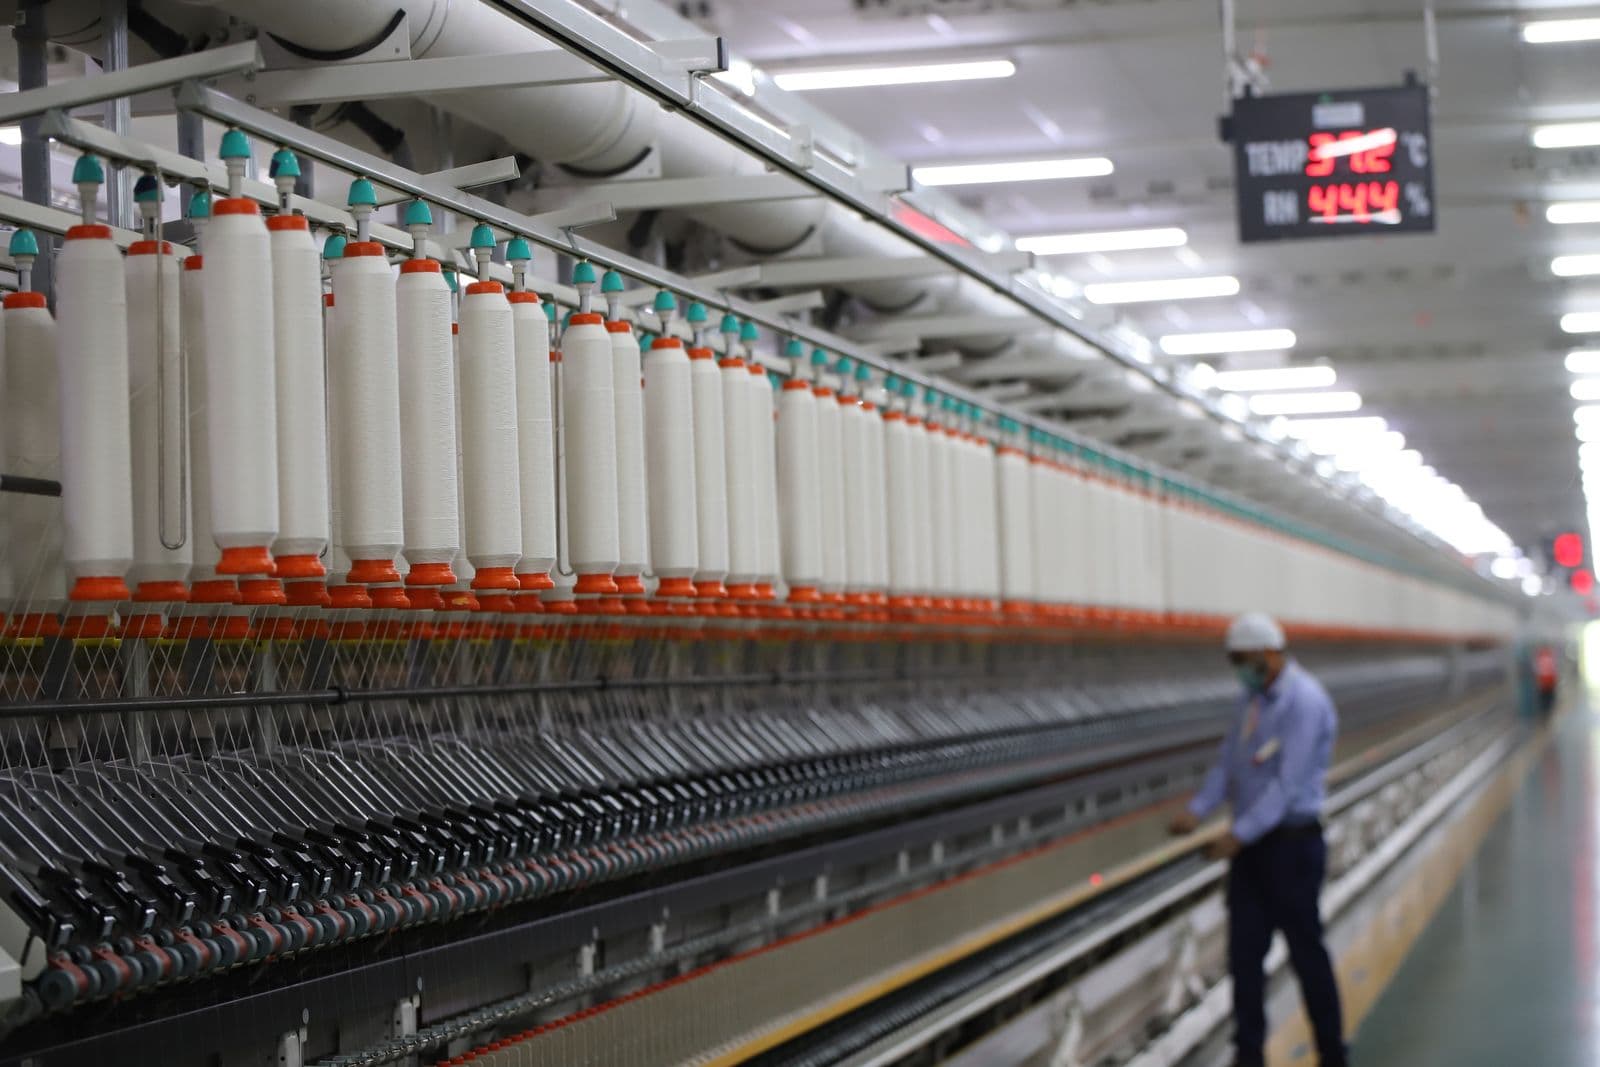 Free to importRaw materialsPolyester staple fibreSpinners and non-woven makers import PSF; 5% BCD, 5% IGST, and the BIS QCO was withdrawn in November 2025.Basic duty5%IGST5%India imported 2025-26US$ 214 mn
Electronics and solar
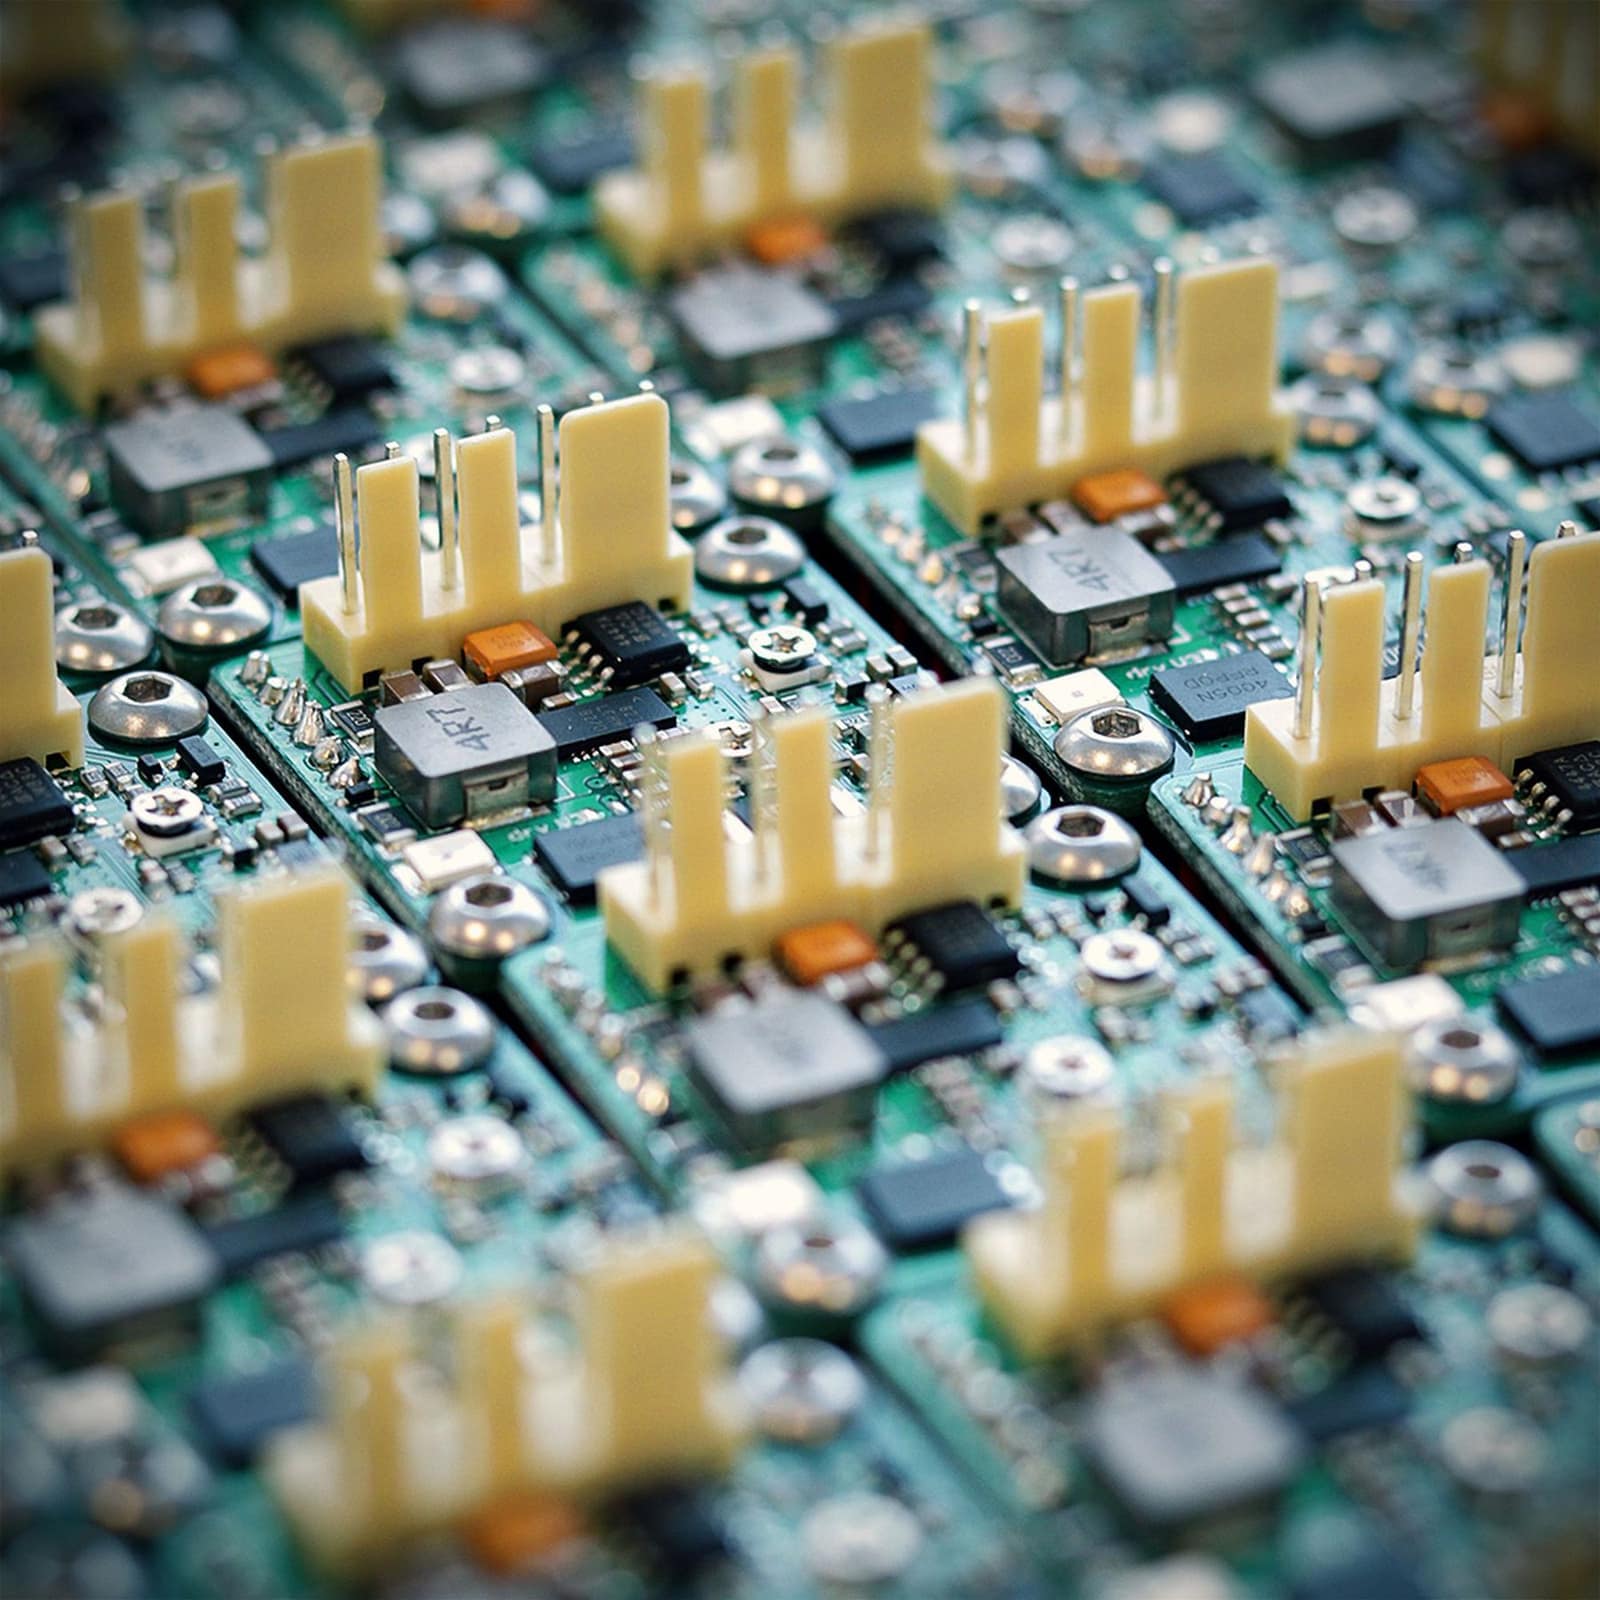 Free to importElectronics and solarElectronic components (chips, diodes, transistors)Most chips, diodes and transistors enter duty-free; you mainly pay 18% IGST, which you can claim back as credit.Basic duty0–7.5%IGST18%India imported 2025-26US$ 36.5 bn
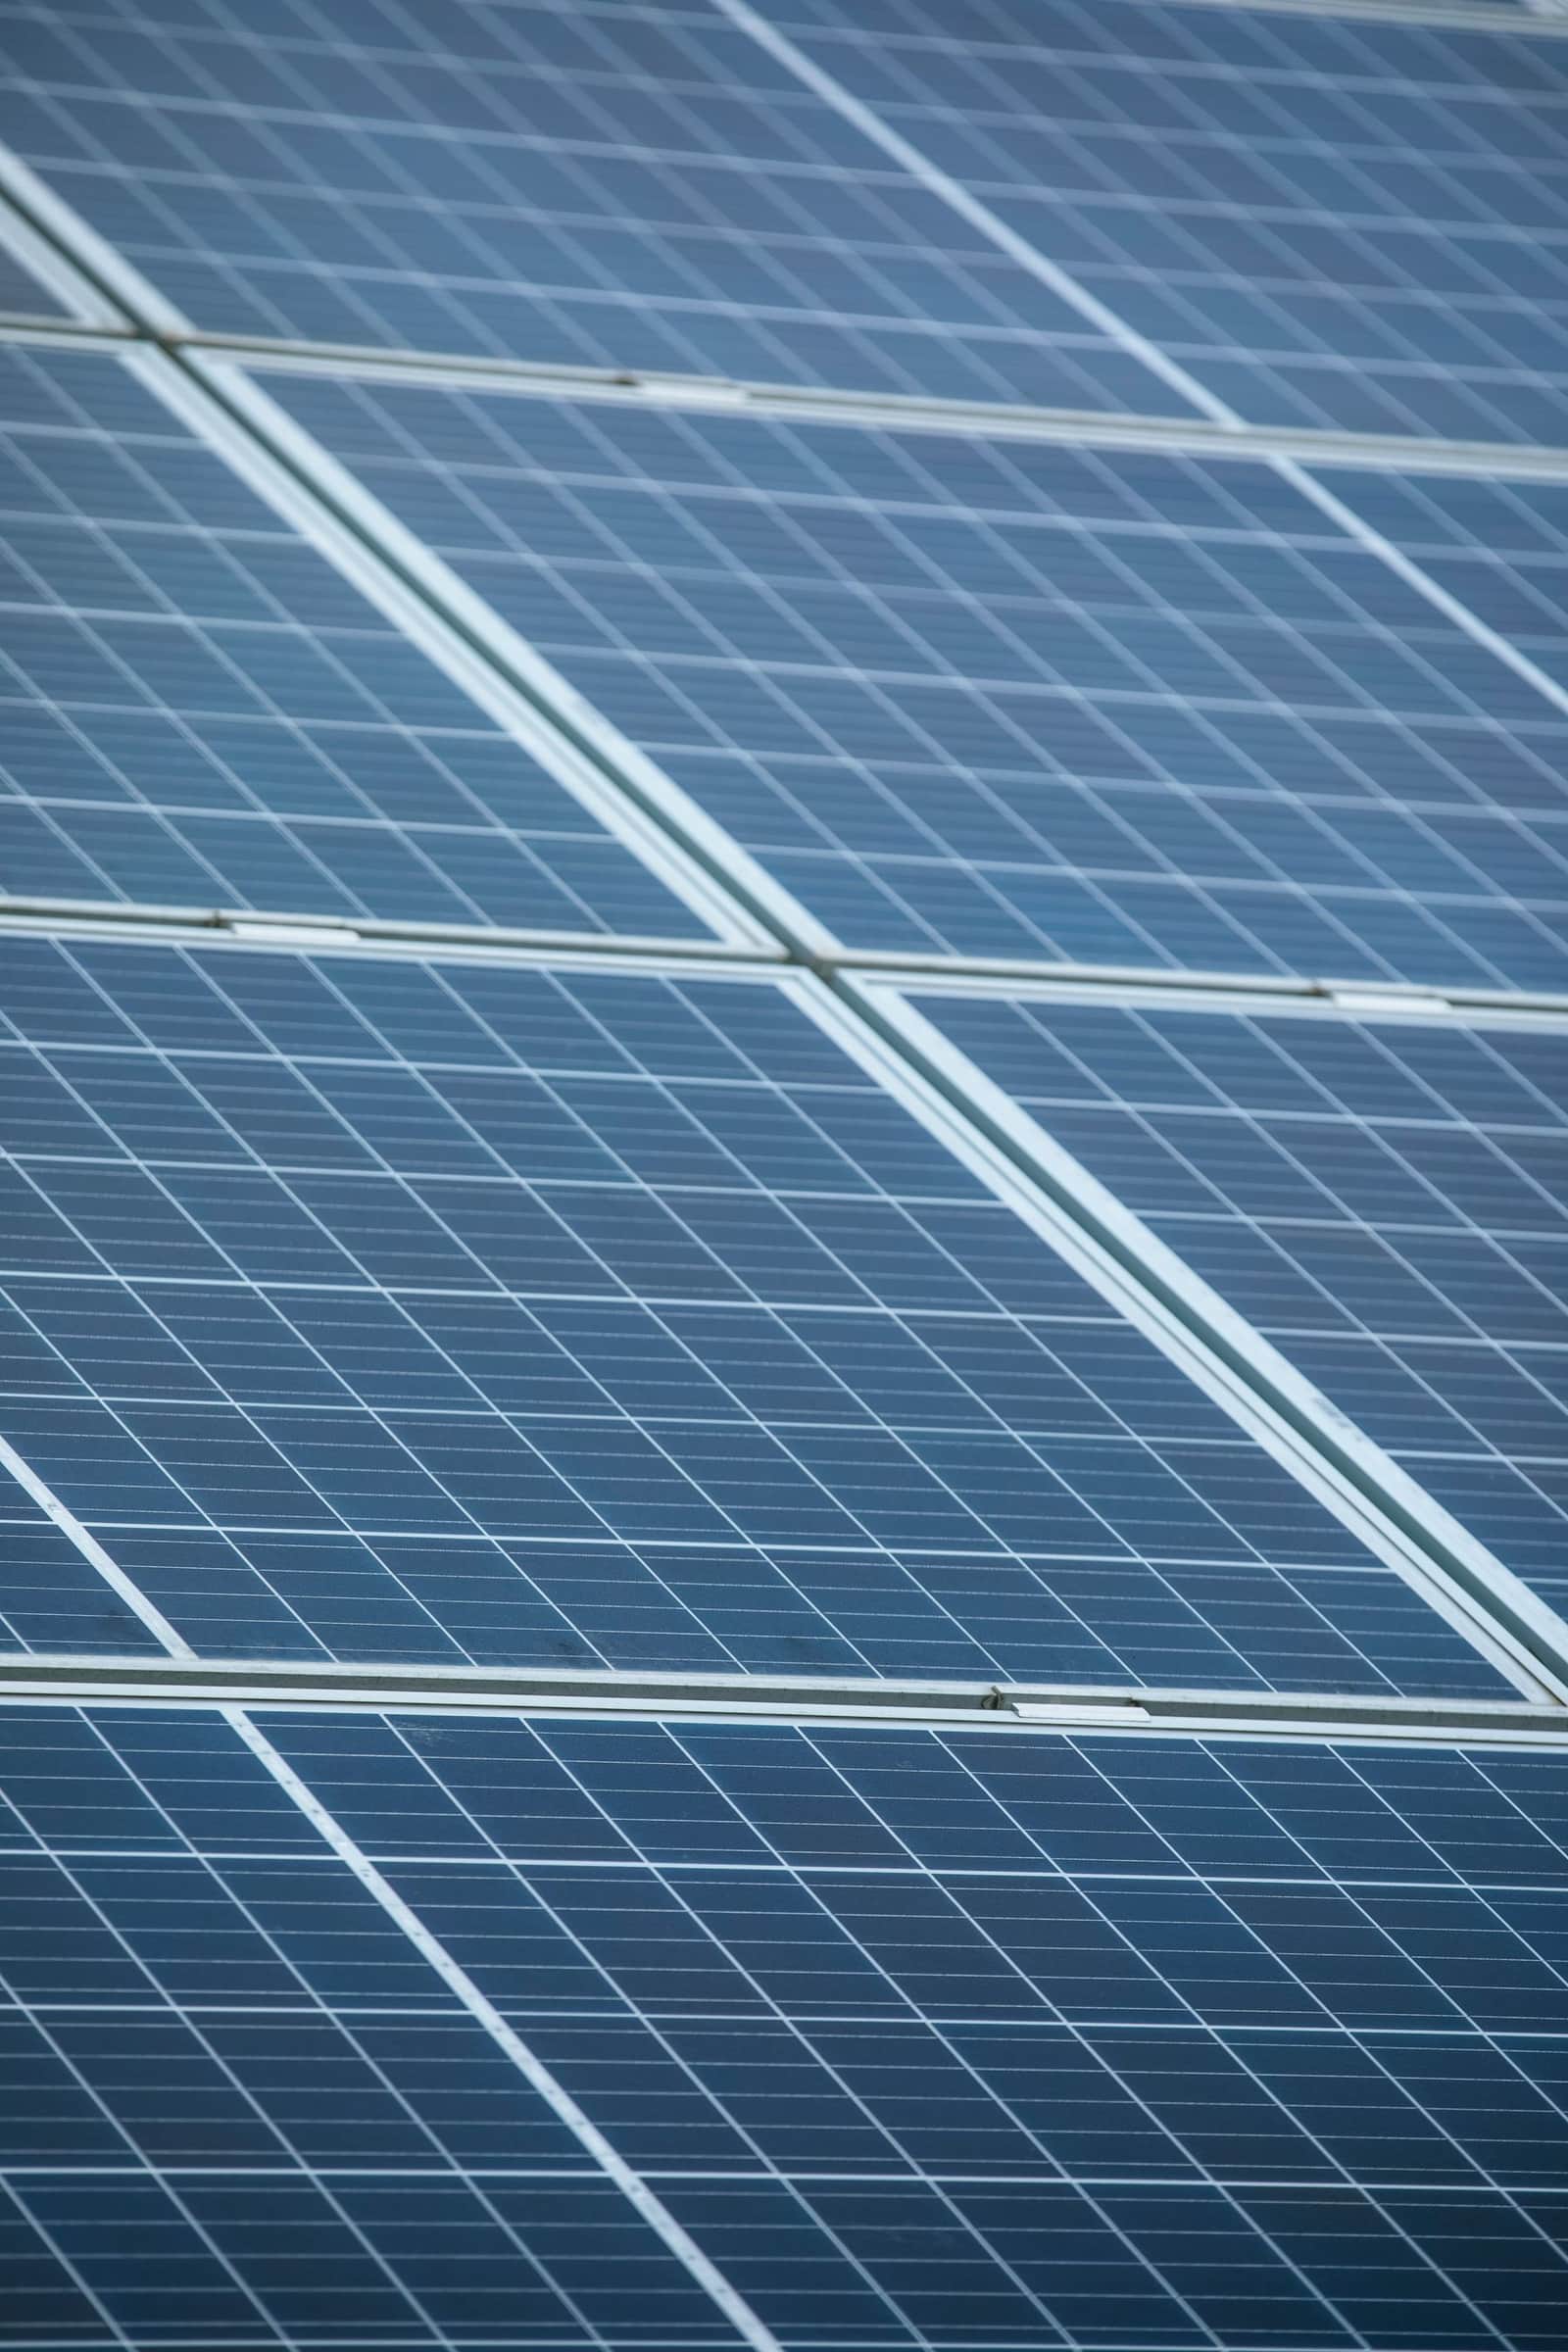 Free to importElectronics and solarSolar cells and panelsModules pay 20% BCD plus 20% AIDC; cells 20% plus 7.5% AIDC. ALMM rules decide whether imported panels can be used in a project.Basic duty20%IGST5%India imported 2025-26US$ 4.05 bn
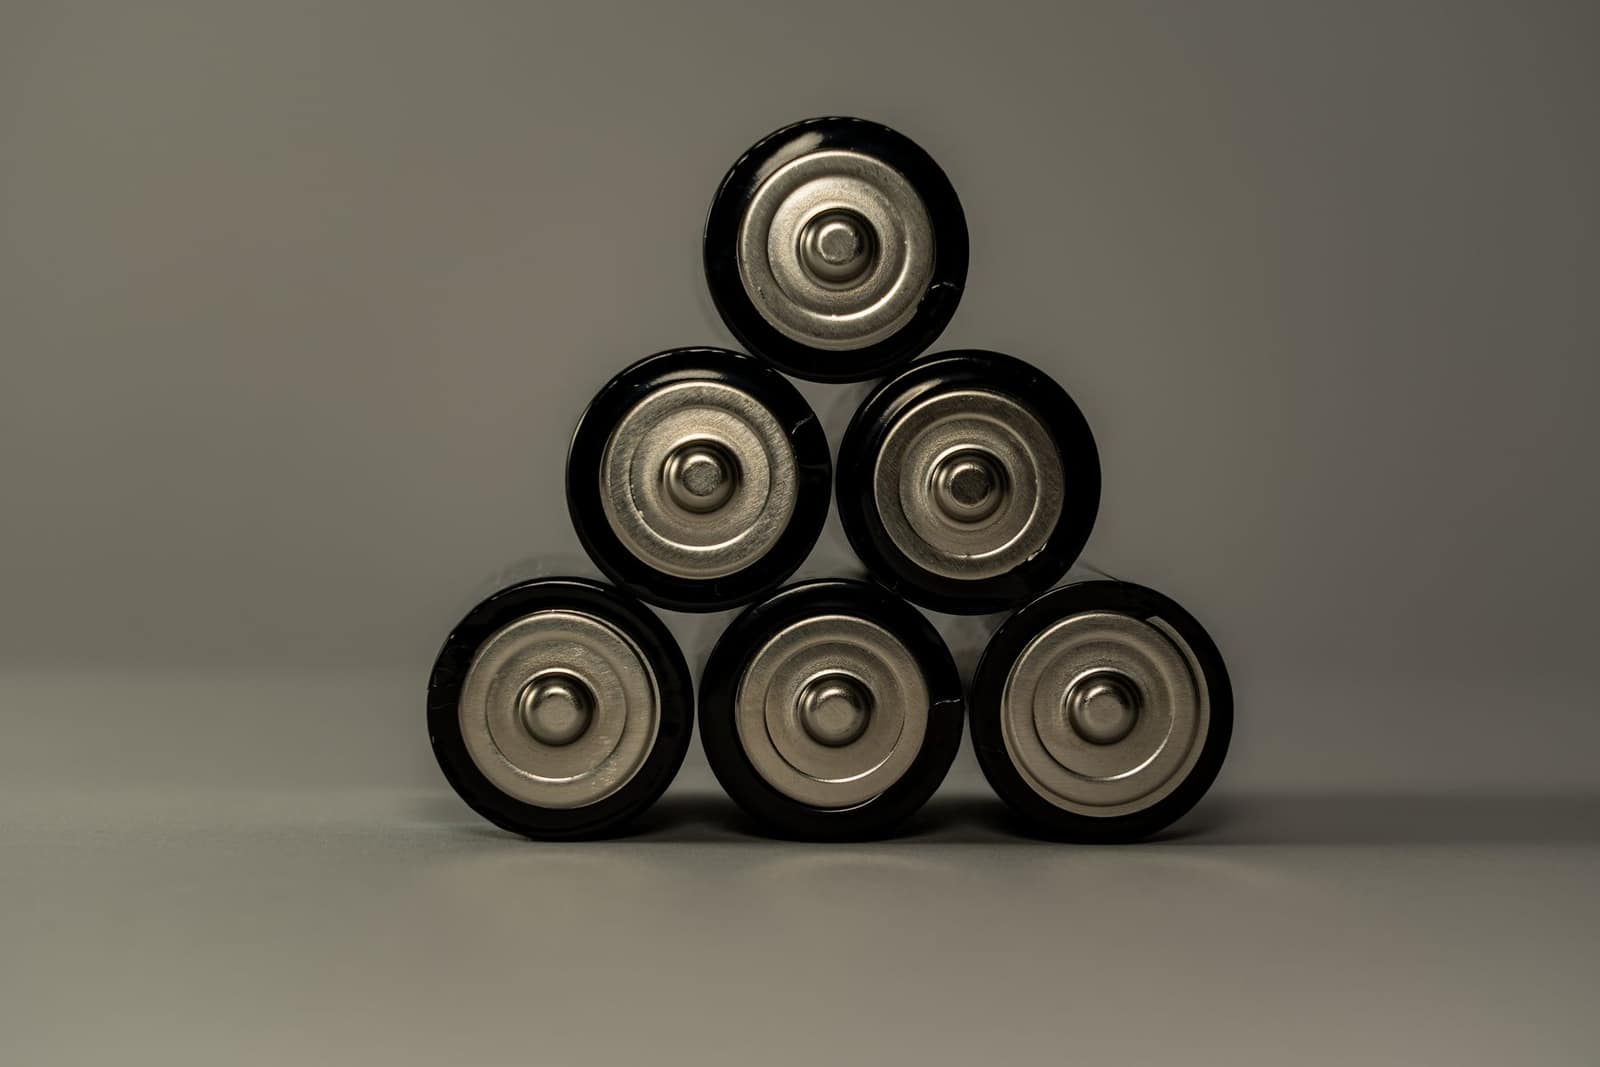 Free to importElectronics and solarLithium-ion batteries and cellsTariff BCD 20%, effective 10% for most Li-ion batteries and 5% for cells used to make battery packs. BIS registration and battery EPR are compulsory.Basic duty5–20%IGST18%India imported 2025-26US$ 4.7 bn
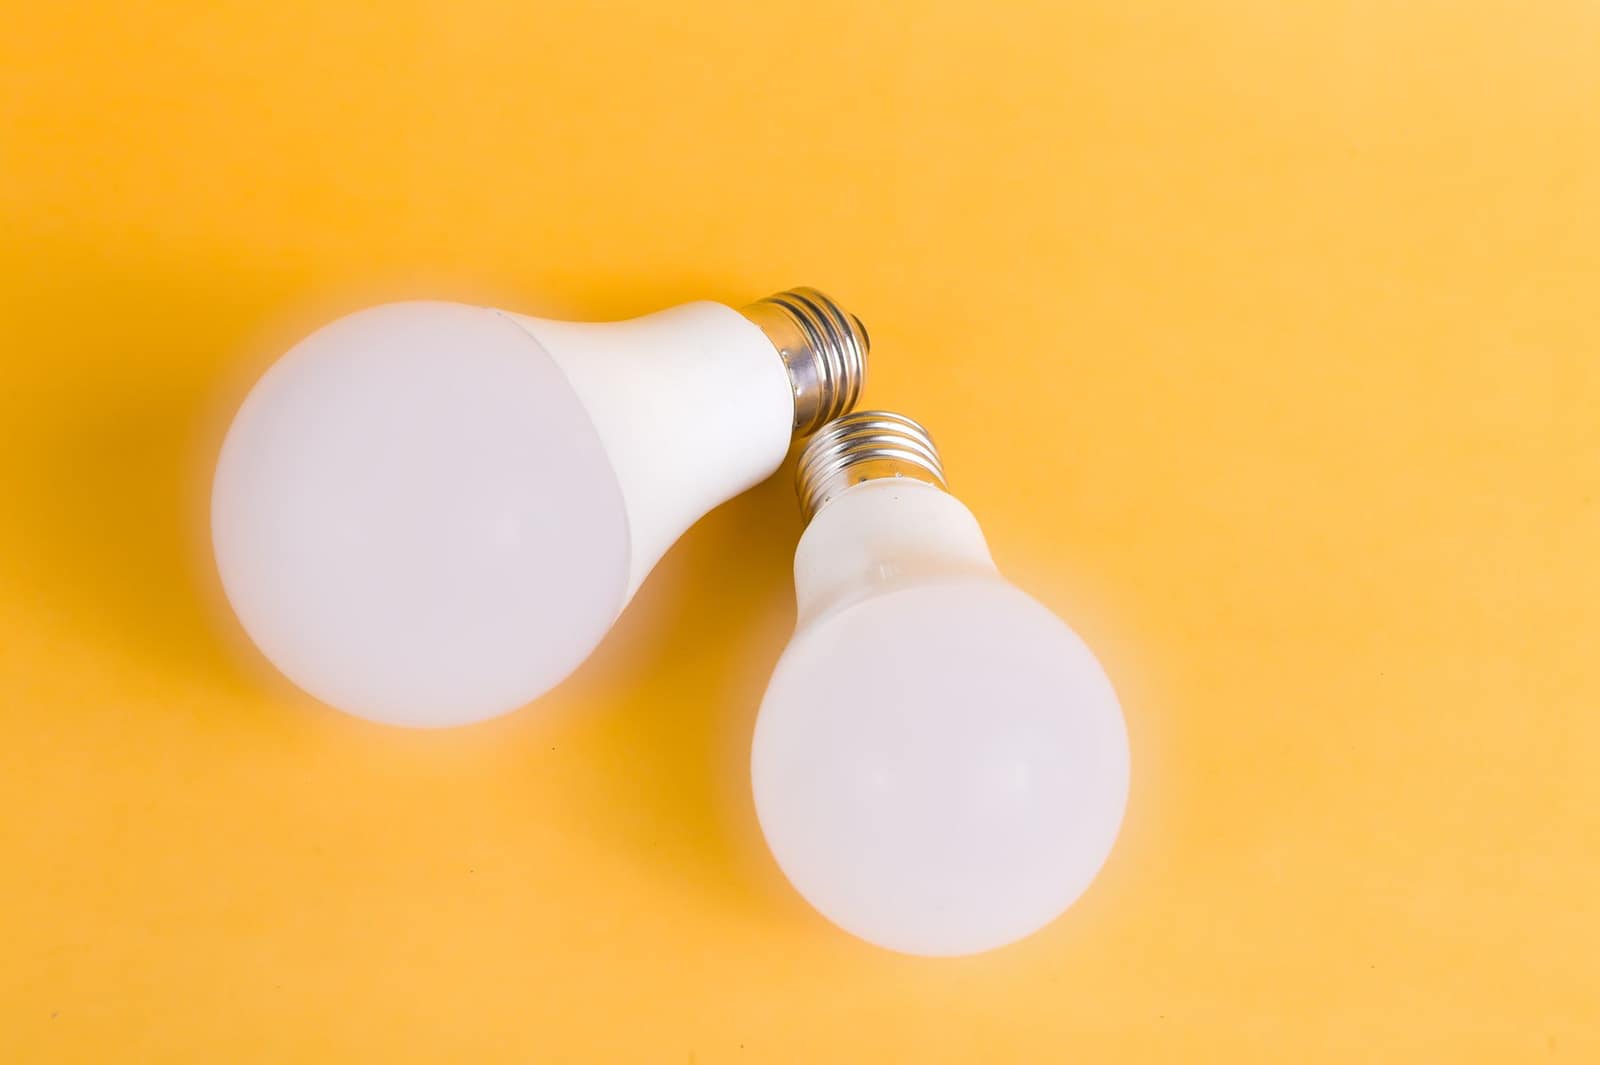 Free to importElectronics and solarLED lights and luminairesLuminaires pay 20% BCD plus 5% AIDC and 18% IGST. LED lamps and fittings need BIS registration and e-waste EPR.Basic duty20%IGST18%India imported 2025-26US$ 464 mn
 Restricted — authorisation neededElectronics and solarLaptops, tablets and computersNo basic customs duty, 18% IGST — but laptops and tablets are “Restricted” and need an online authorisation under DGFT’s Import Management System.Basic dutyNilIGST18%India imported 2025-26US$ 6.73 bn
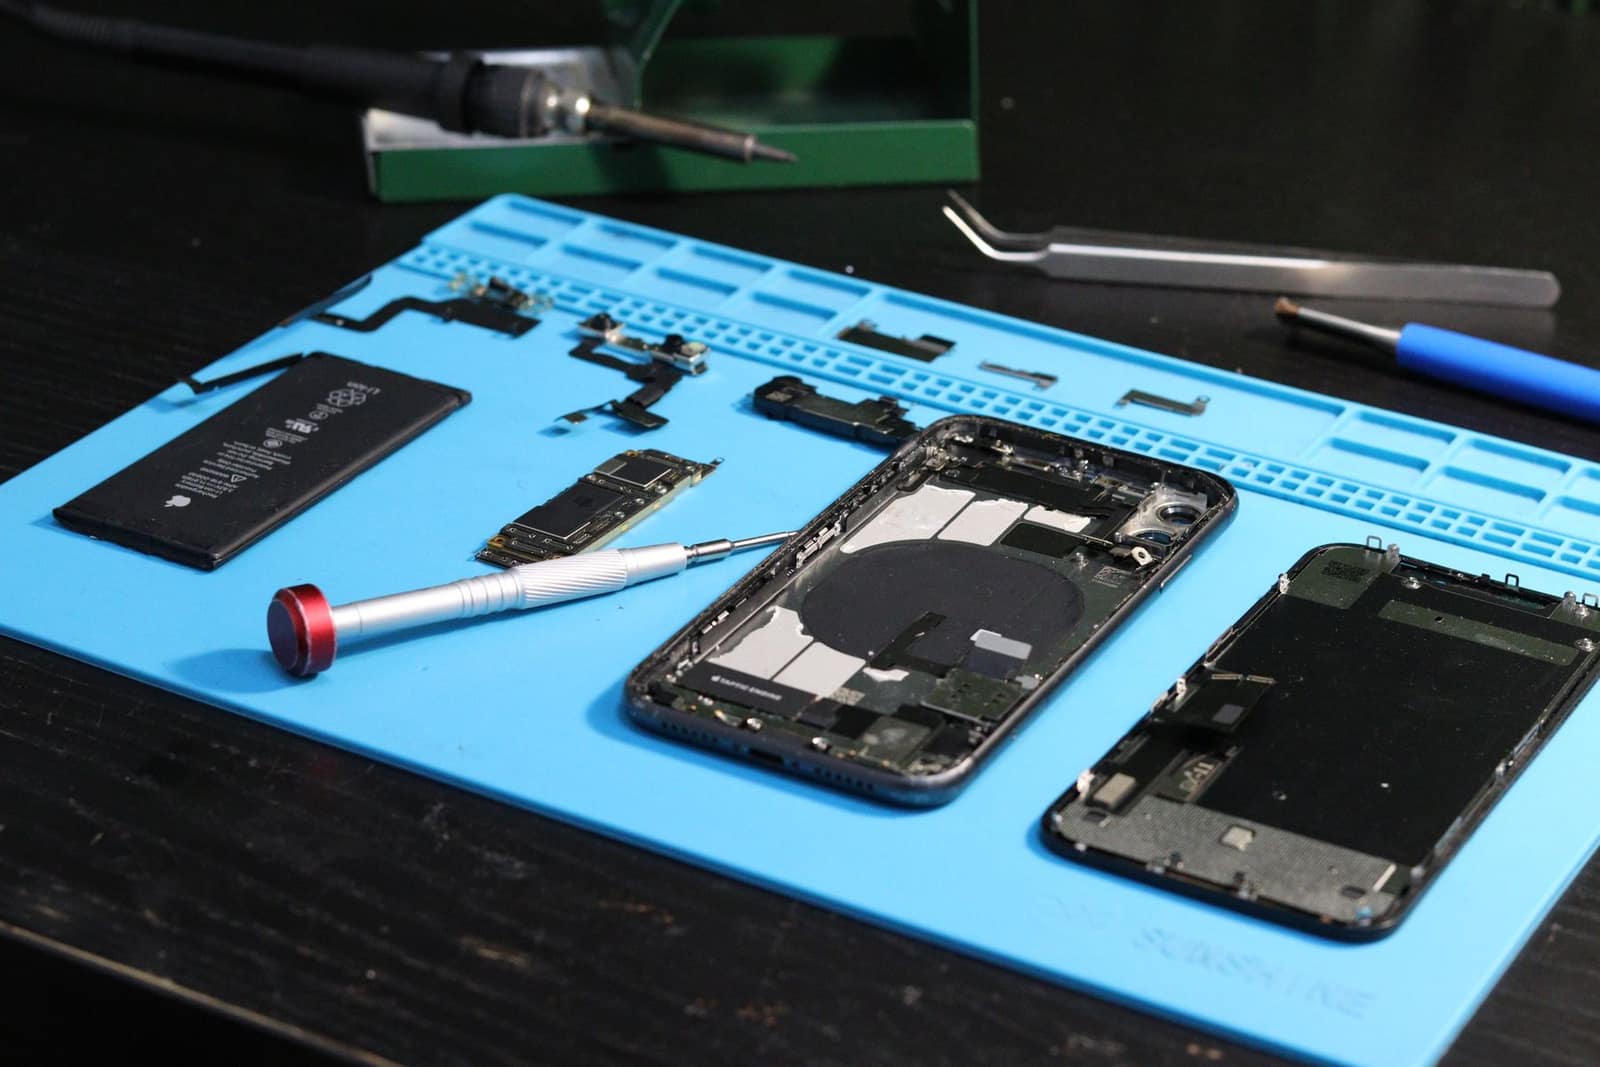 Free to importElectronics and solarMobile phone partsIndia's largest electronics import line; mobile PCBA pays 15% BCD and many sub-parts for phone making are duty-free.Basic duty15–20%IGST18%India imported 2025-26US$ 16.6 bn
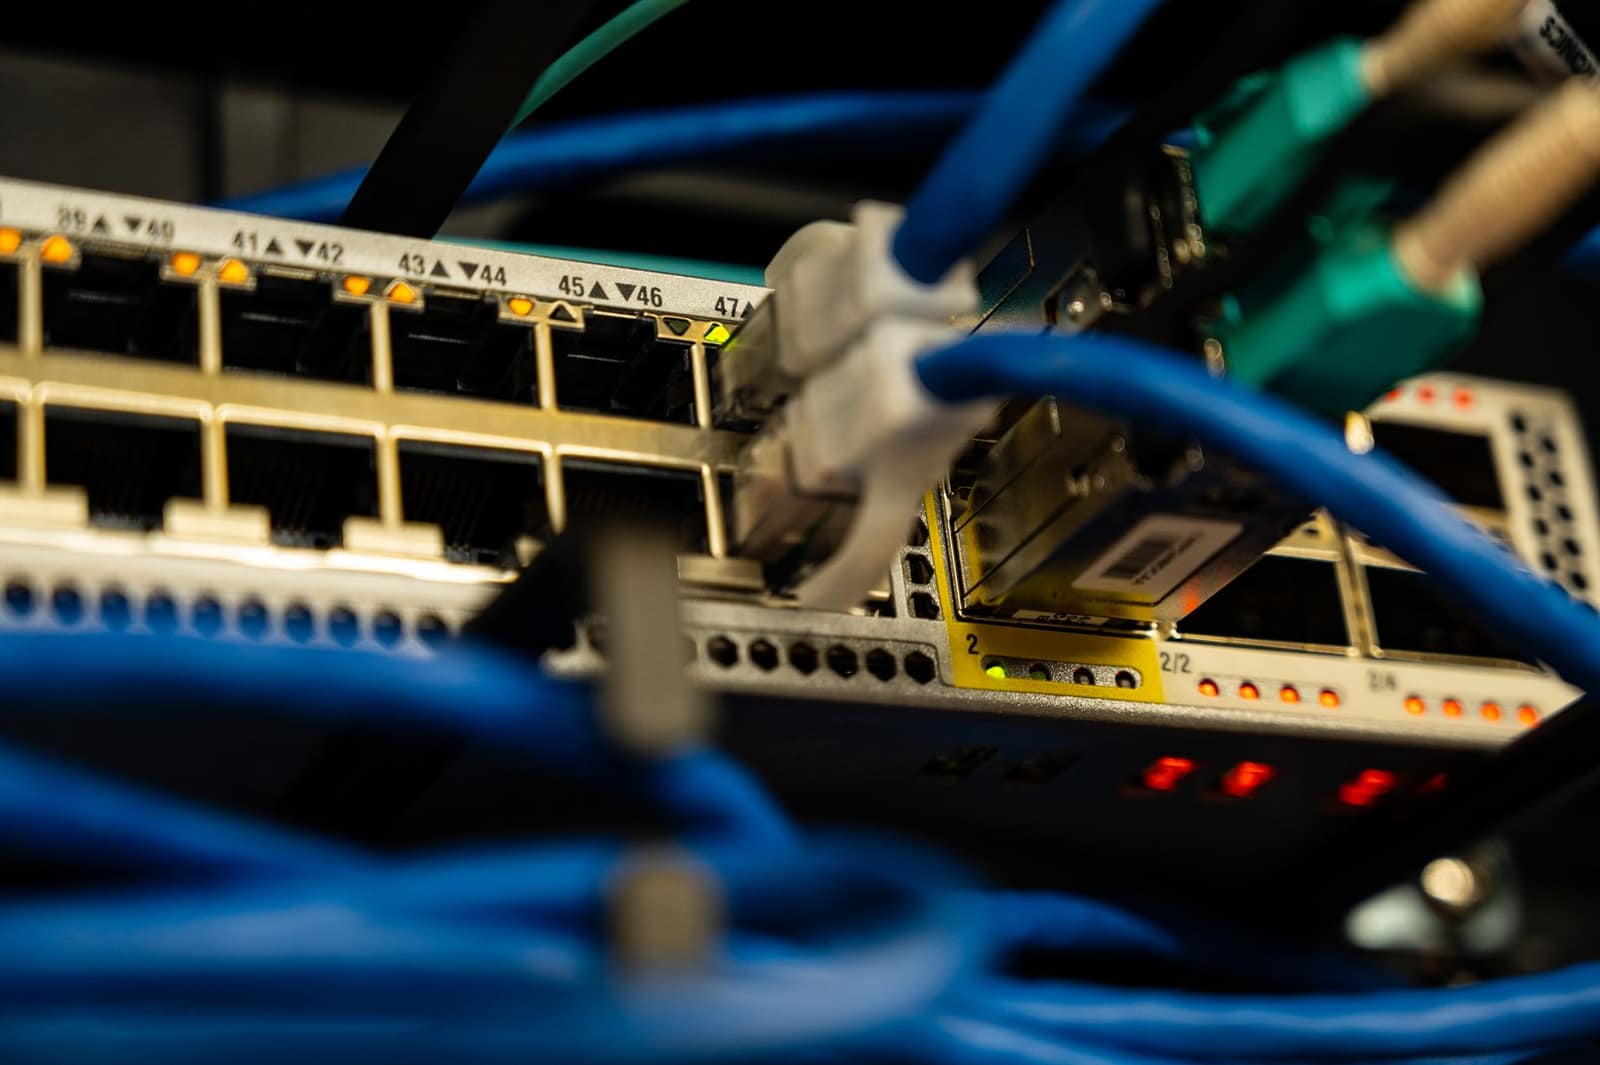 Free to importElectronics and solarRouters and networking equipmentRouters, switches and Wi-Fi gear usually pay 20% BCD and need TEC (MTCTE) certification, plus WPC approval if wireless.Basic duty20%IGST18%India imported 2025-26US$ 3.95 bn
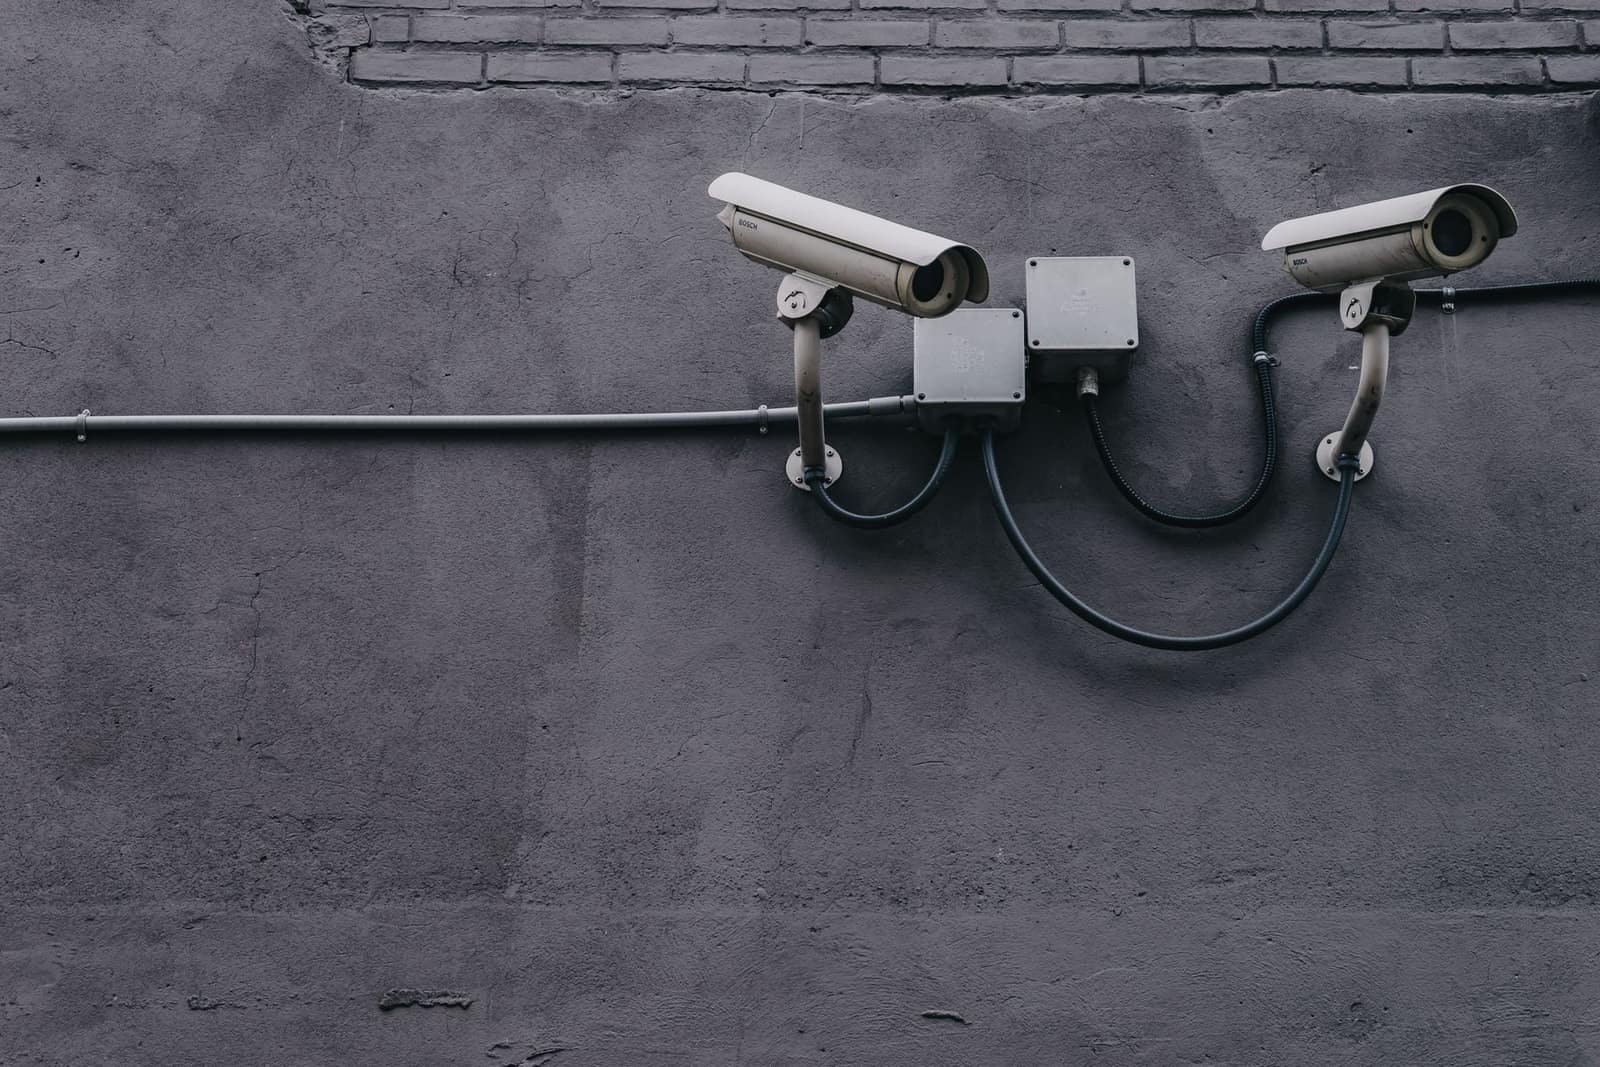 Free to importElectronics and solarCCTV camerasCCTV and IP cameras pay 20% BCD and need BIS CRS registration plus security testing under MeitY's essential requirements.Basic duty20%IGST18%India imported 2025-26US$ 1.97 bn
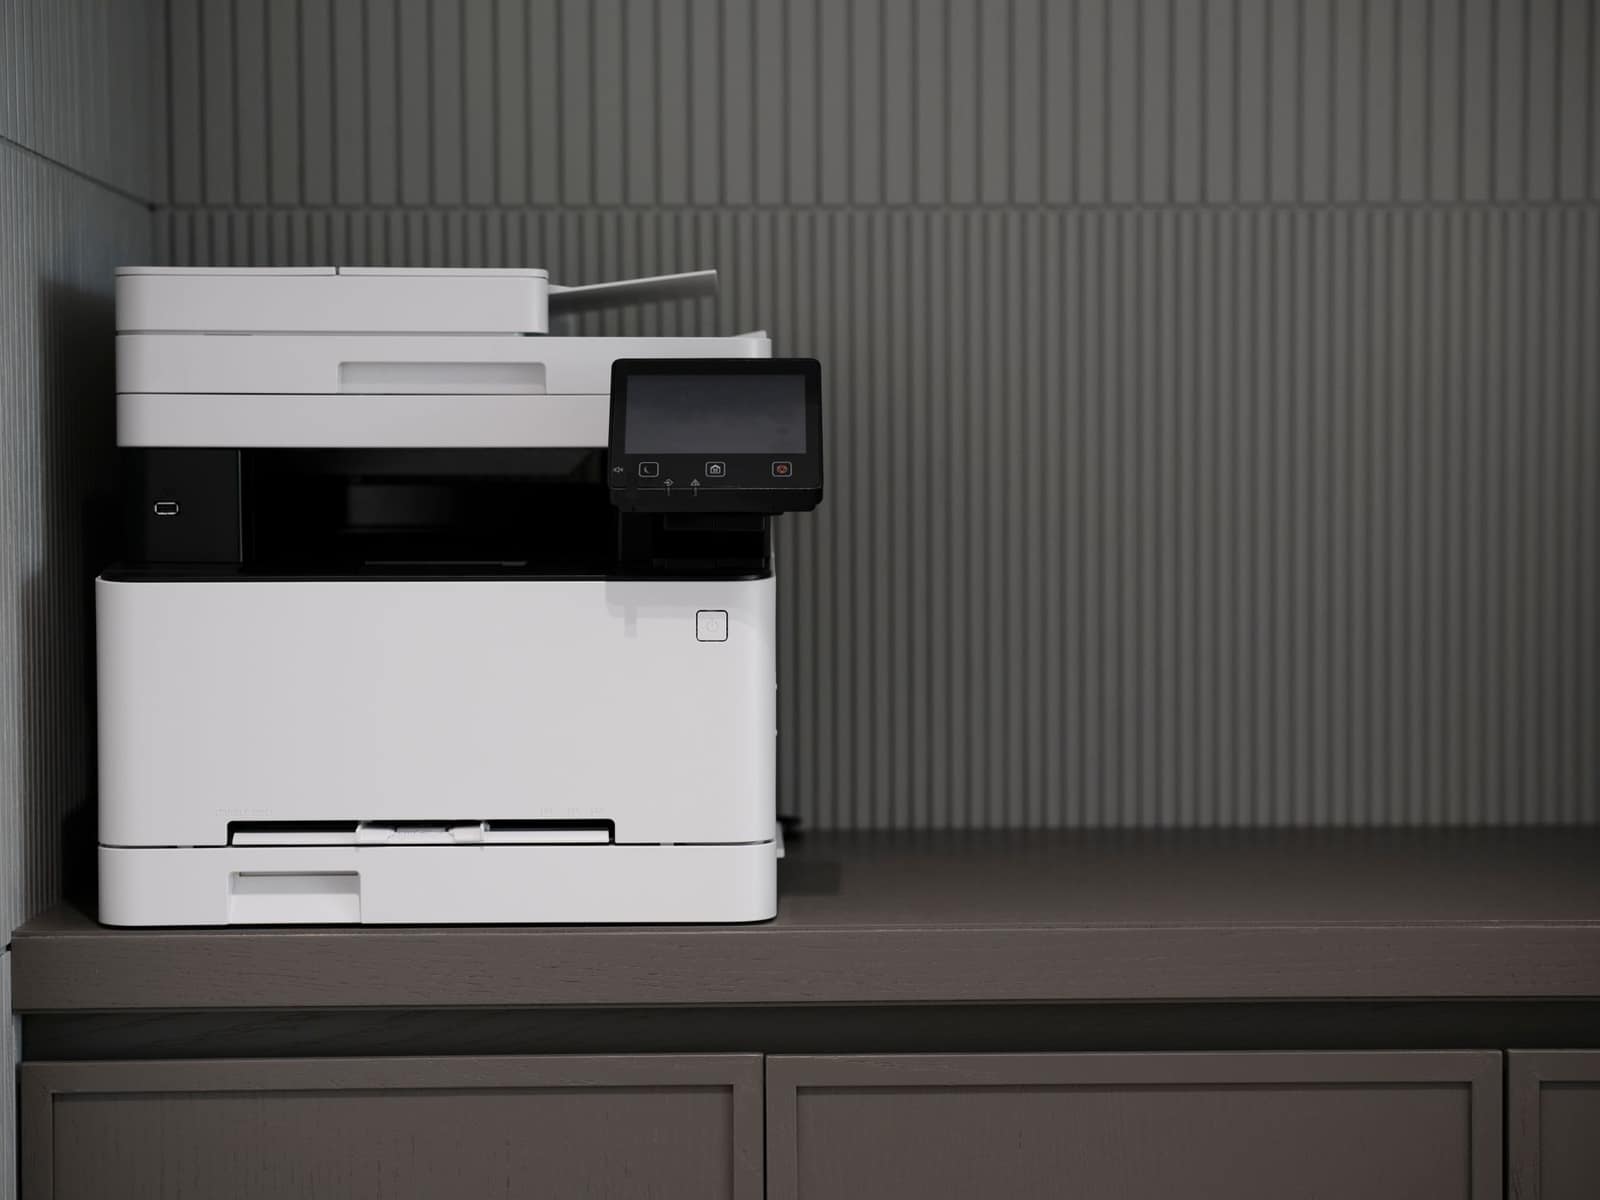 Free to importElectronics and solarPrinters and copiersComputer printers enter duty-free, multifunction machines and copiers pay 7.5%, cartridges 10%; BIS CRS applies.Basic duty0–7.5%IGST18%India imported 2025-26US$ 1.94 bn
 Restricted — authorisation neededElectronics and solarTVs, monitors and display panelsTV sets are restricted (DGFT licence) and pay 20% BCD; monitors 10%; open cells for TV-panel making 5%.Basic duty5–20%IGST18%India imported 2025-26US$ 1.46 bn
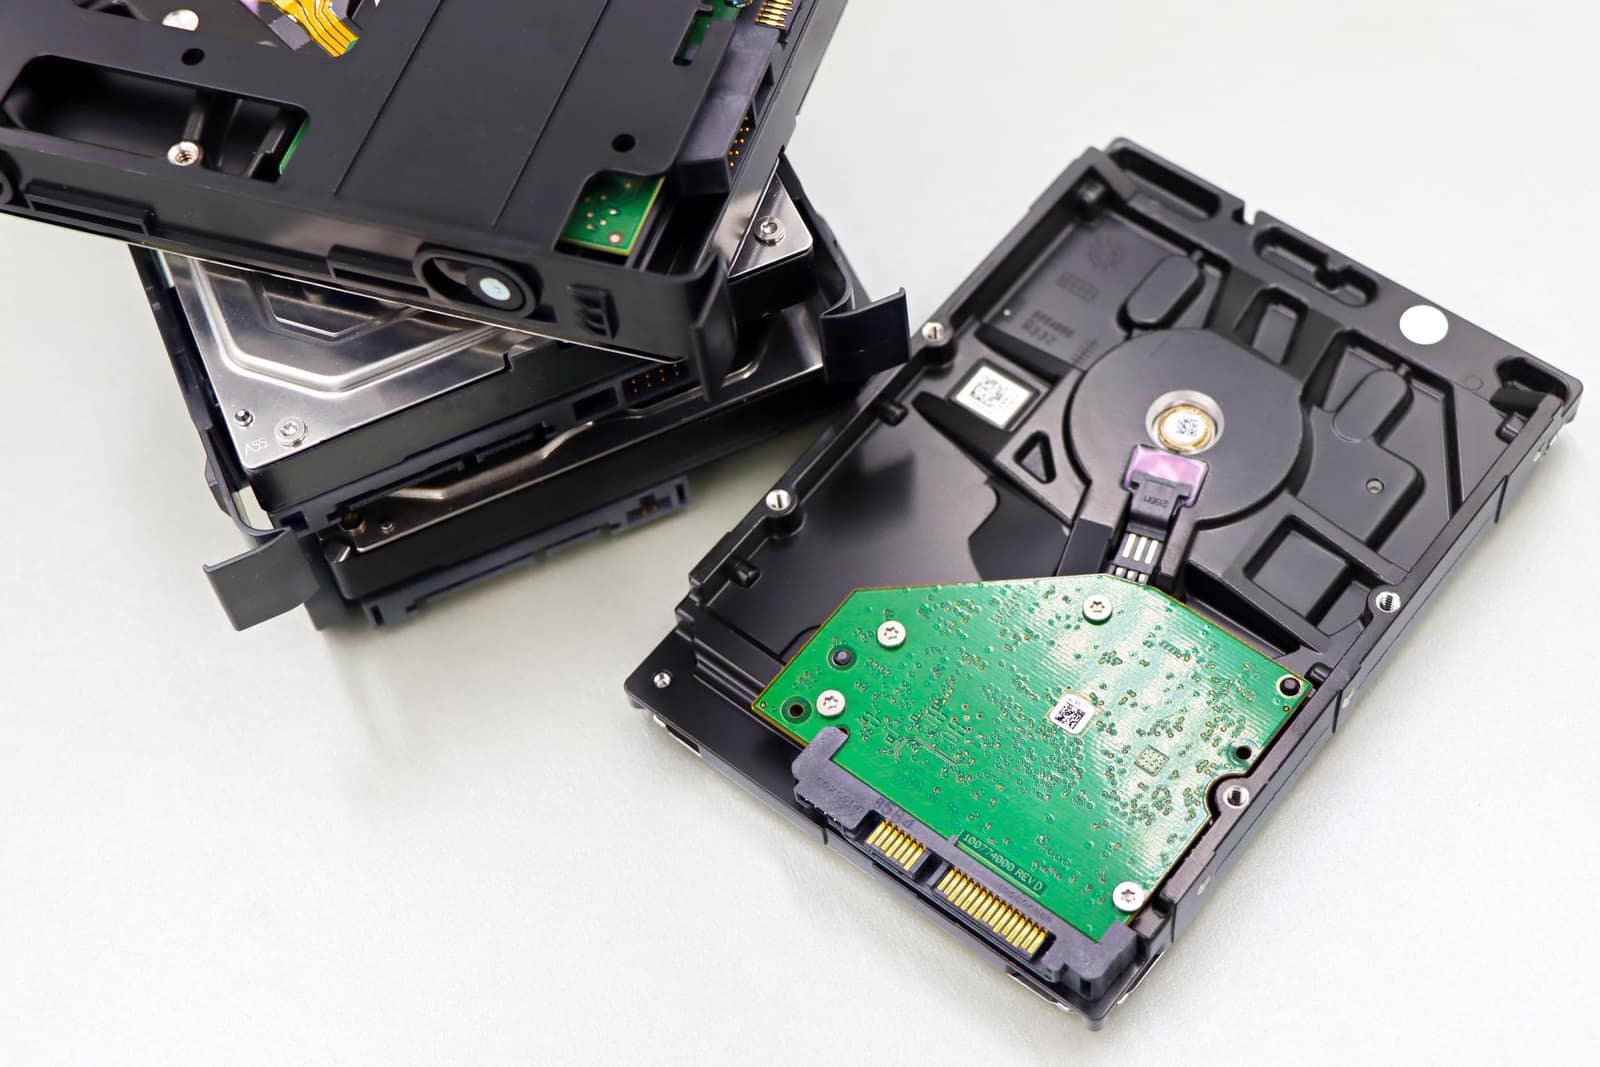 Free to importElectronics and solarHard disks and storage devicesHard disk drives enter duty-free; SSDs and pen drives carry 10% BCD; IGST is 18% on both.Basic duty0–10%IGST18%India imported 2025-26US$ 2.08 bn
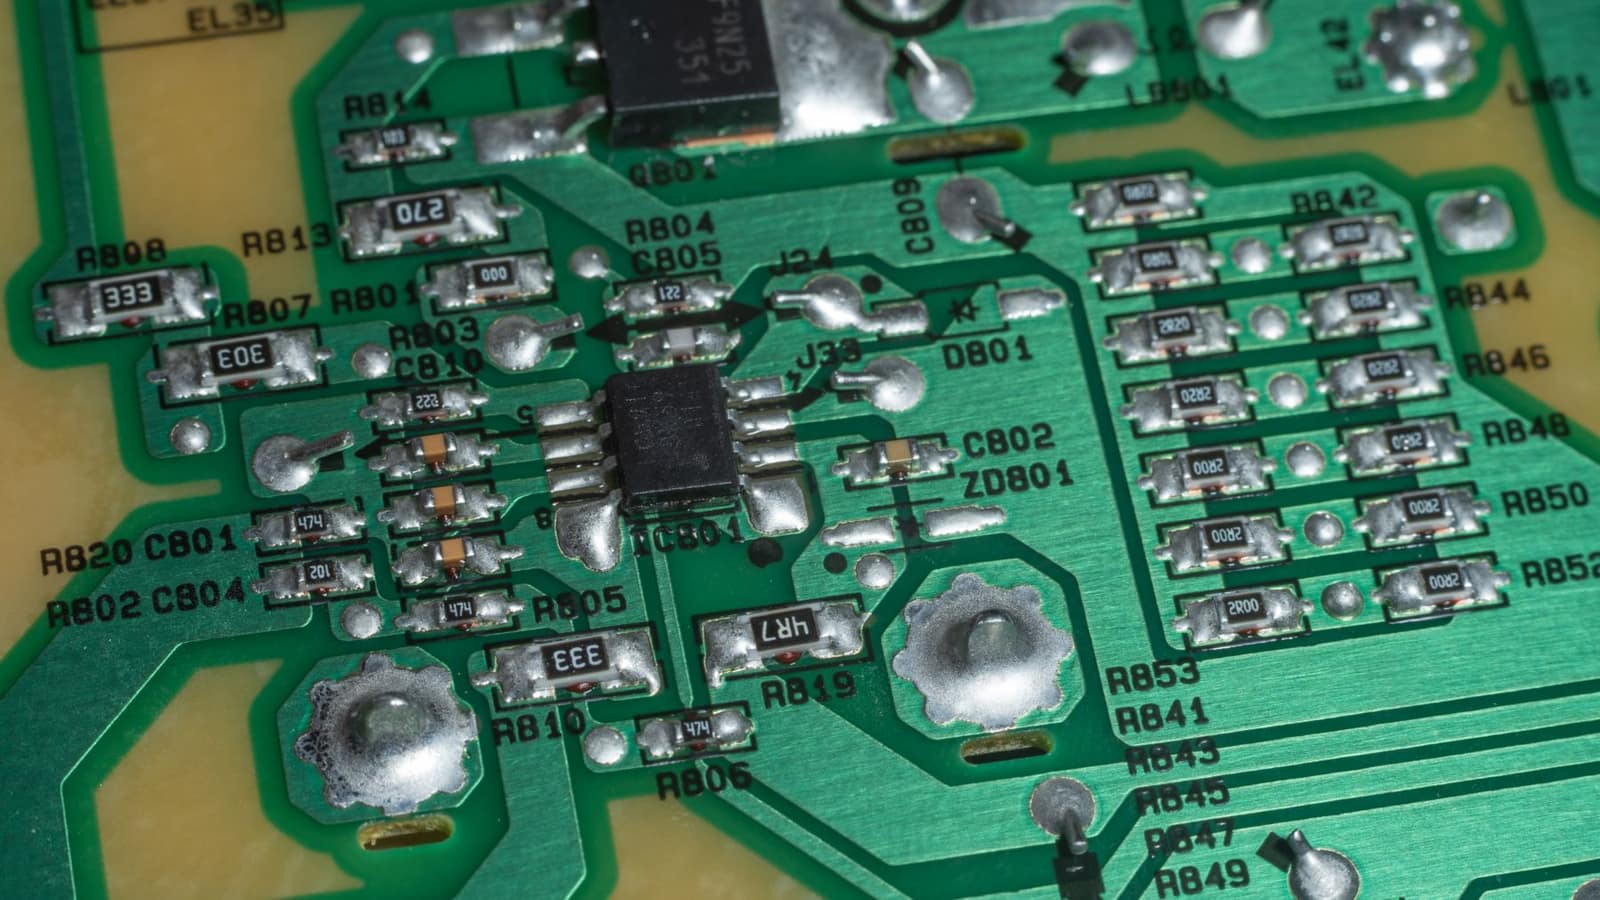 Free to importElectronics and solarPrinted circuit boardsBare PCBs have nil BCD, but anti-dumping duty applies to boards up to six layers from China and Hong Kong.Basic dutyNilIGST18%India imported 2025-26US$ 1.68 bn
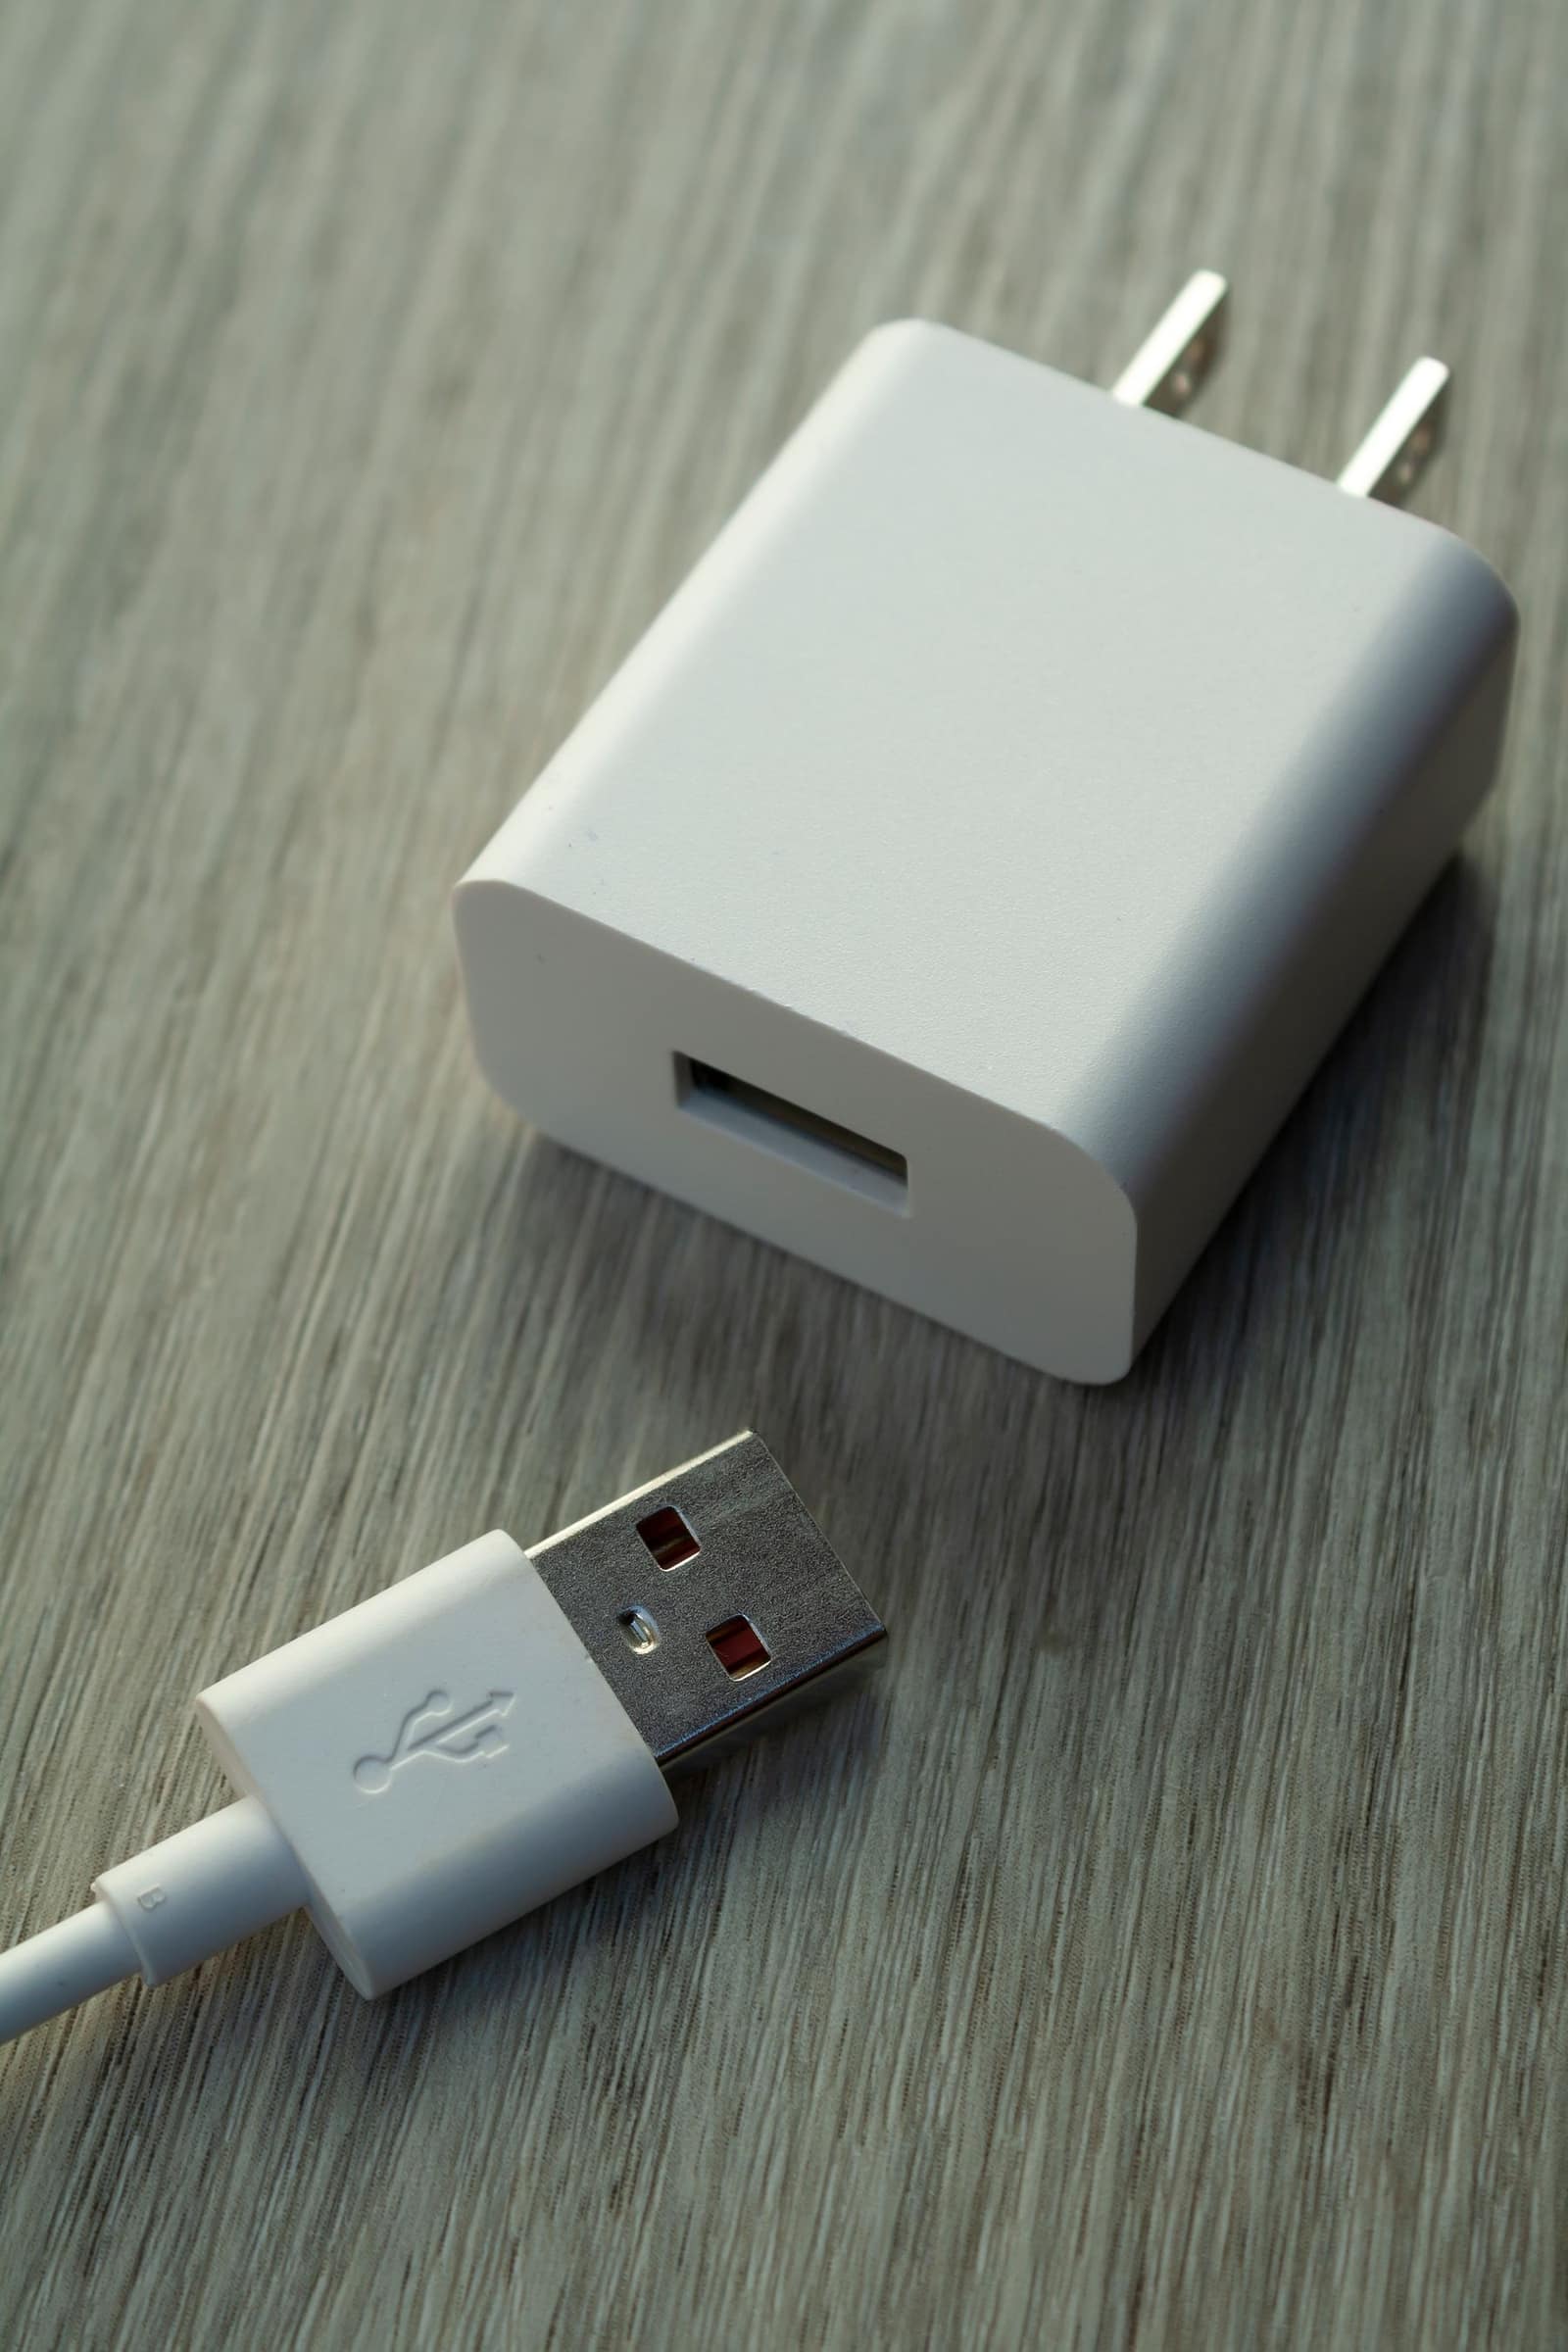 Free to importElectronics and solarInverters, chargers and power suppliesMost inverters, chargers and adapters pay 20% BCD; mobile chargers 15%; BIS CRS covers many of them.Basic duty15–20%IGST5–18%India imported 2025-26US$ 2.37 bn
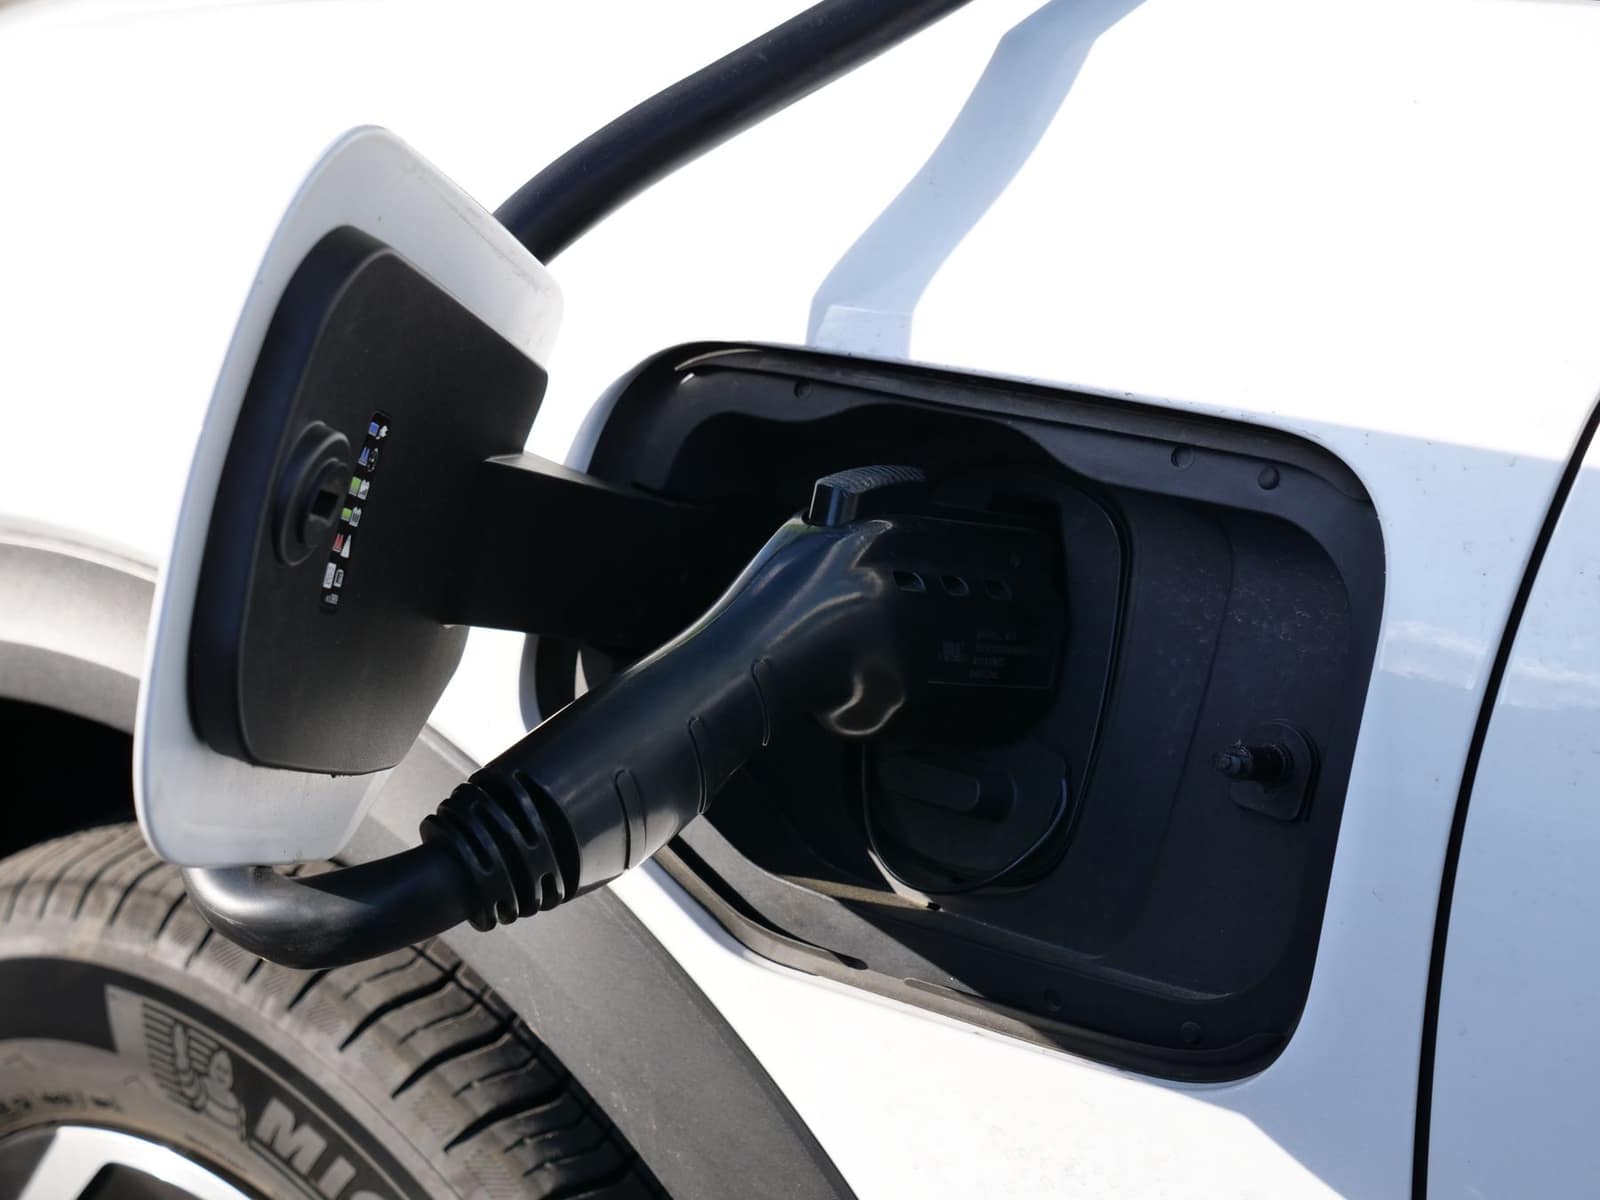 Free, with conditionsElectronics and solarElectric carsFully built electric cars pay 70% BCD, plus 40% AIDC above US$ 40,000 CIF; homologation under CMVR is required.Basic duty15–70%IGST5%India imported 2025-26US$ 371 mn
Machinery and parts
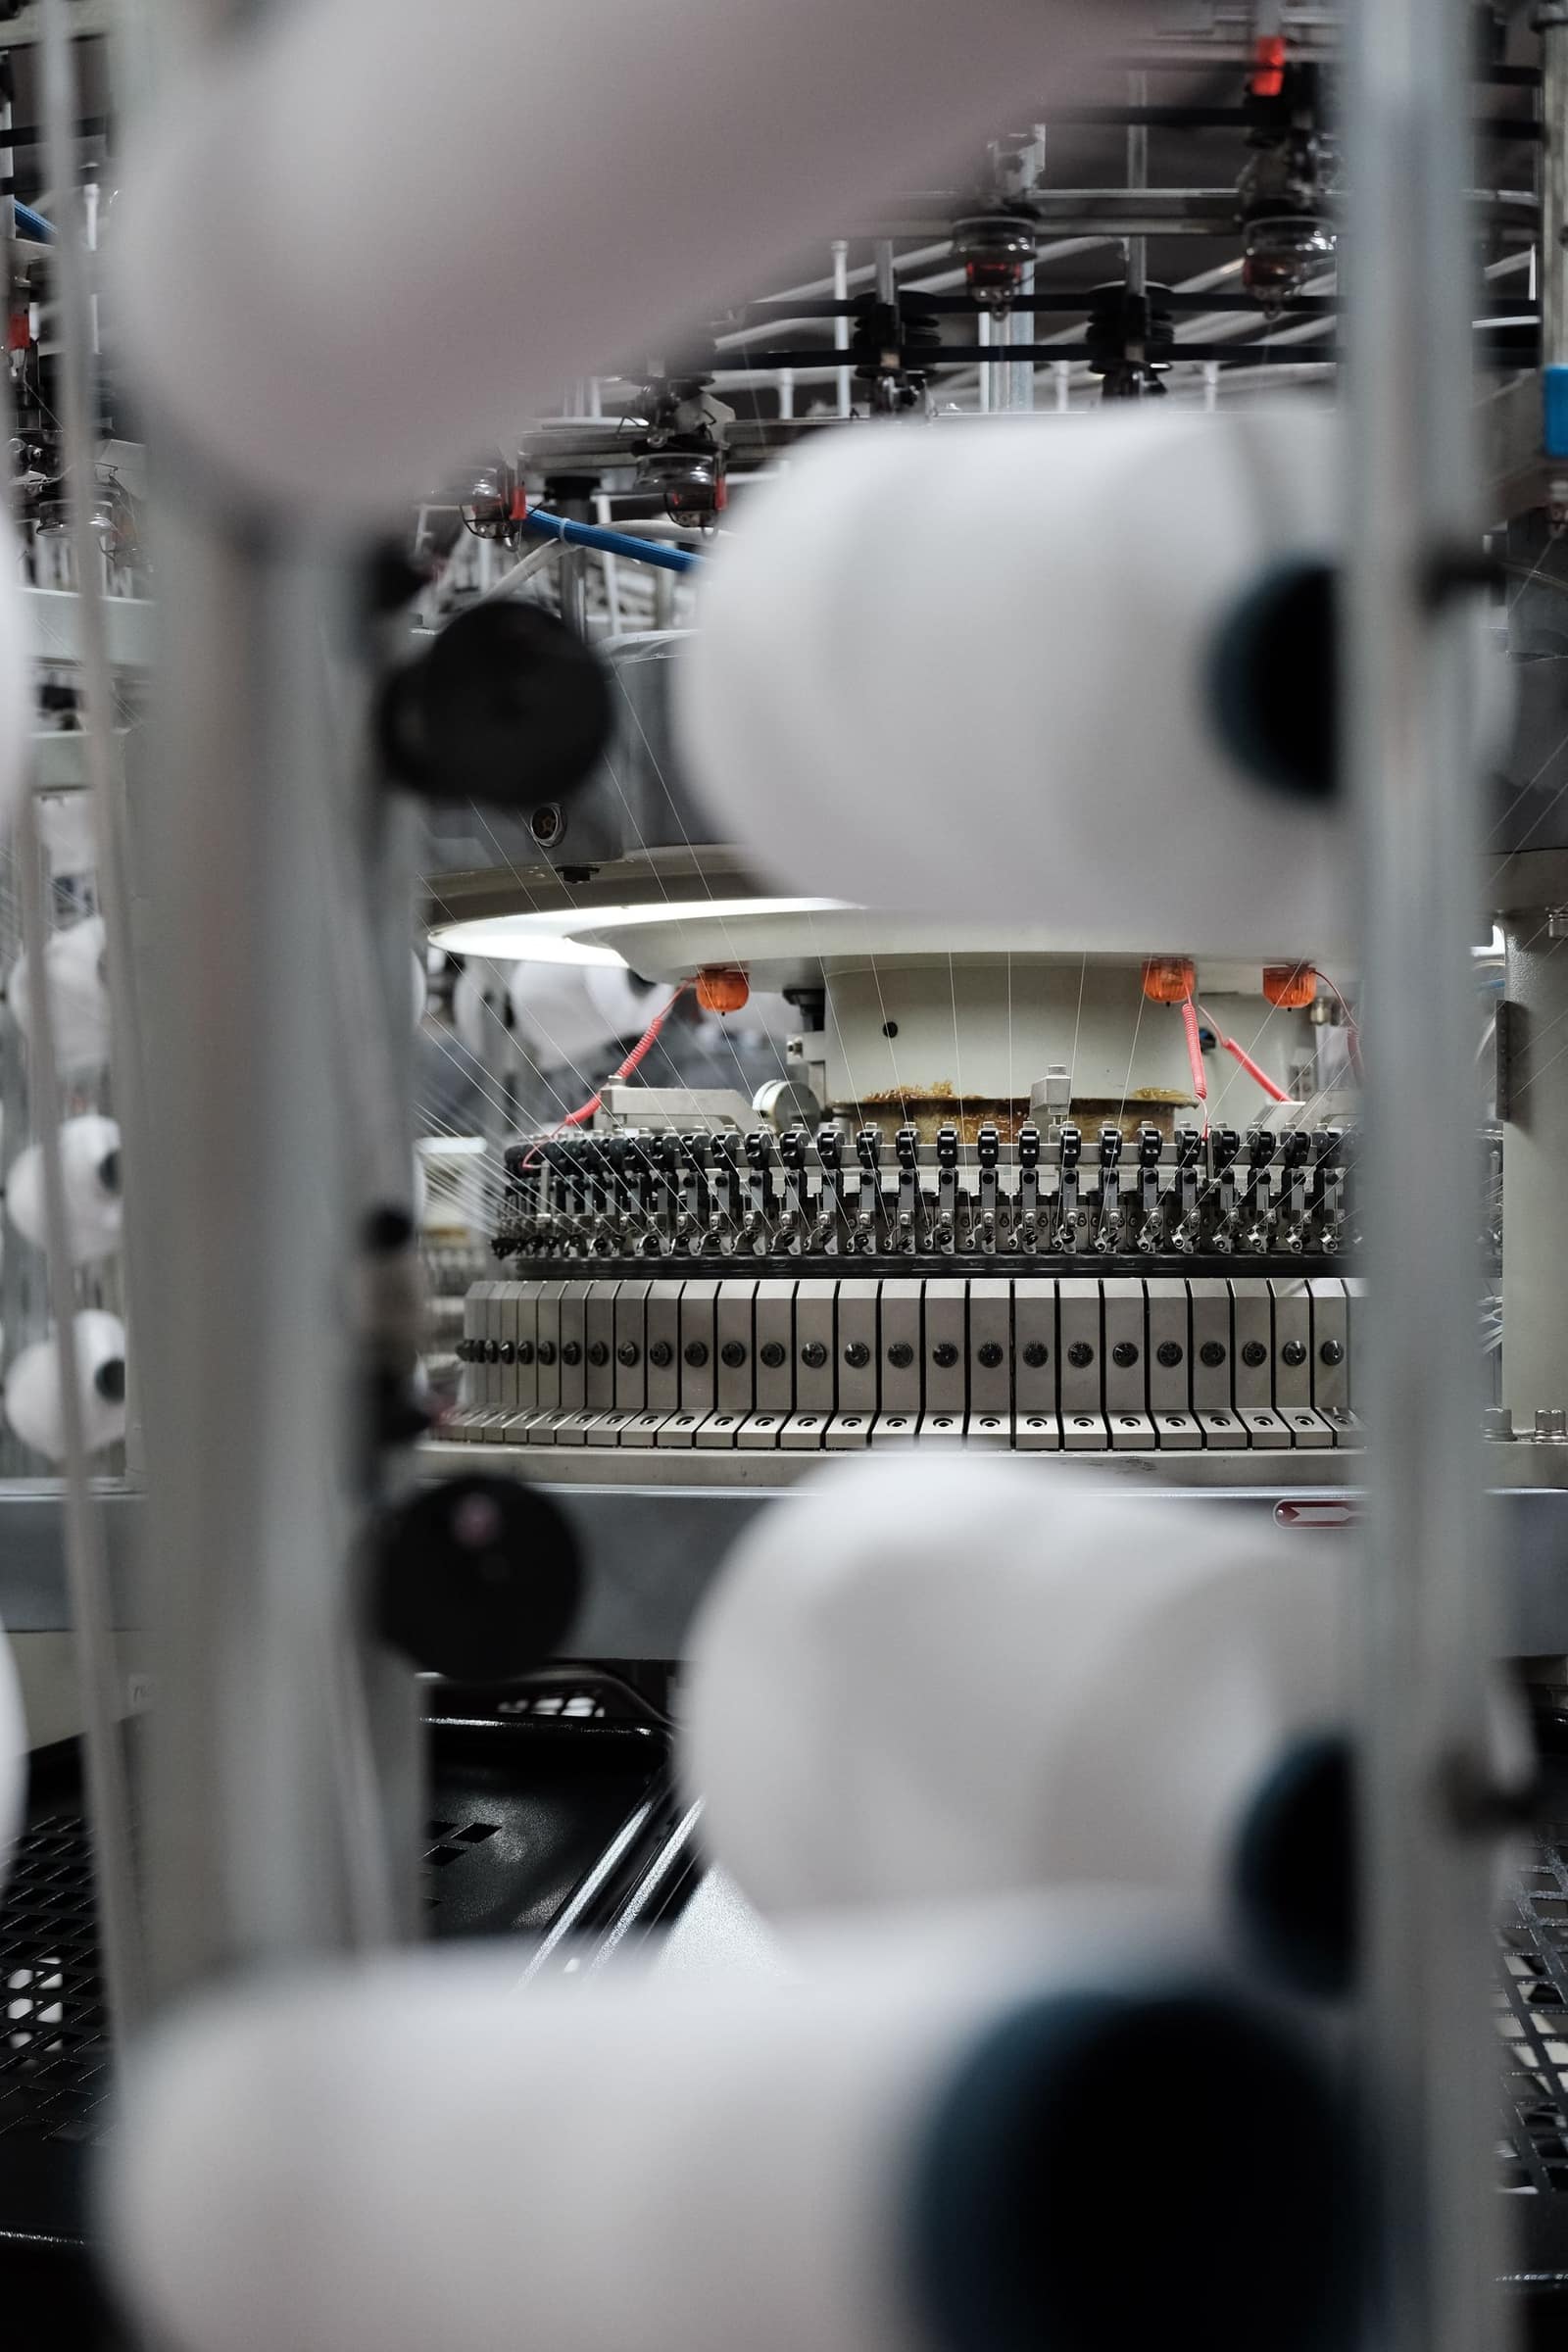 Free to importMachinery and partsTextile machineryMost textile machines pay 7.5% BCD and 18% IGST; specified shuttleless looms are duty-free until 31 March 2027.Basic duty5–7.5%IGST18%India imported 2025-26US$ 2.94 bn
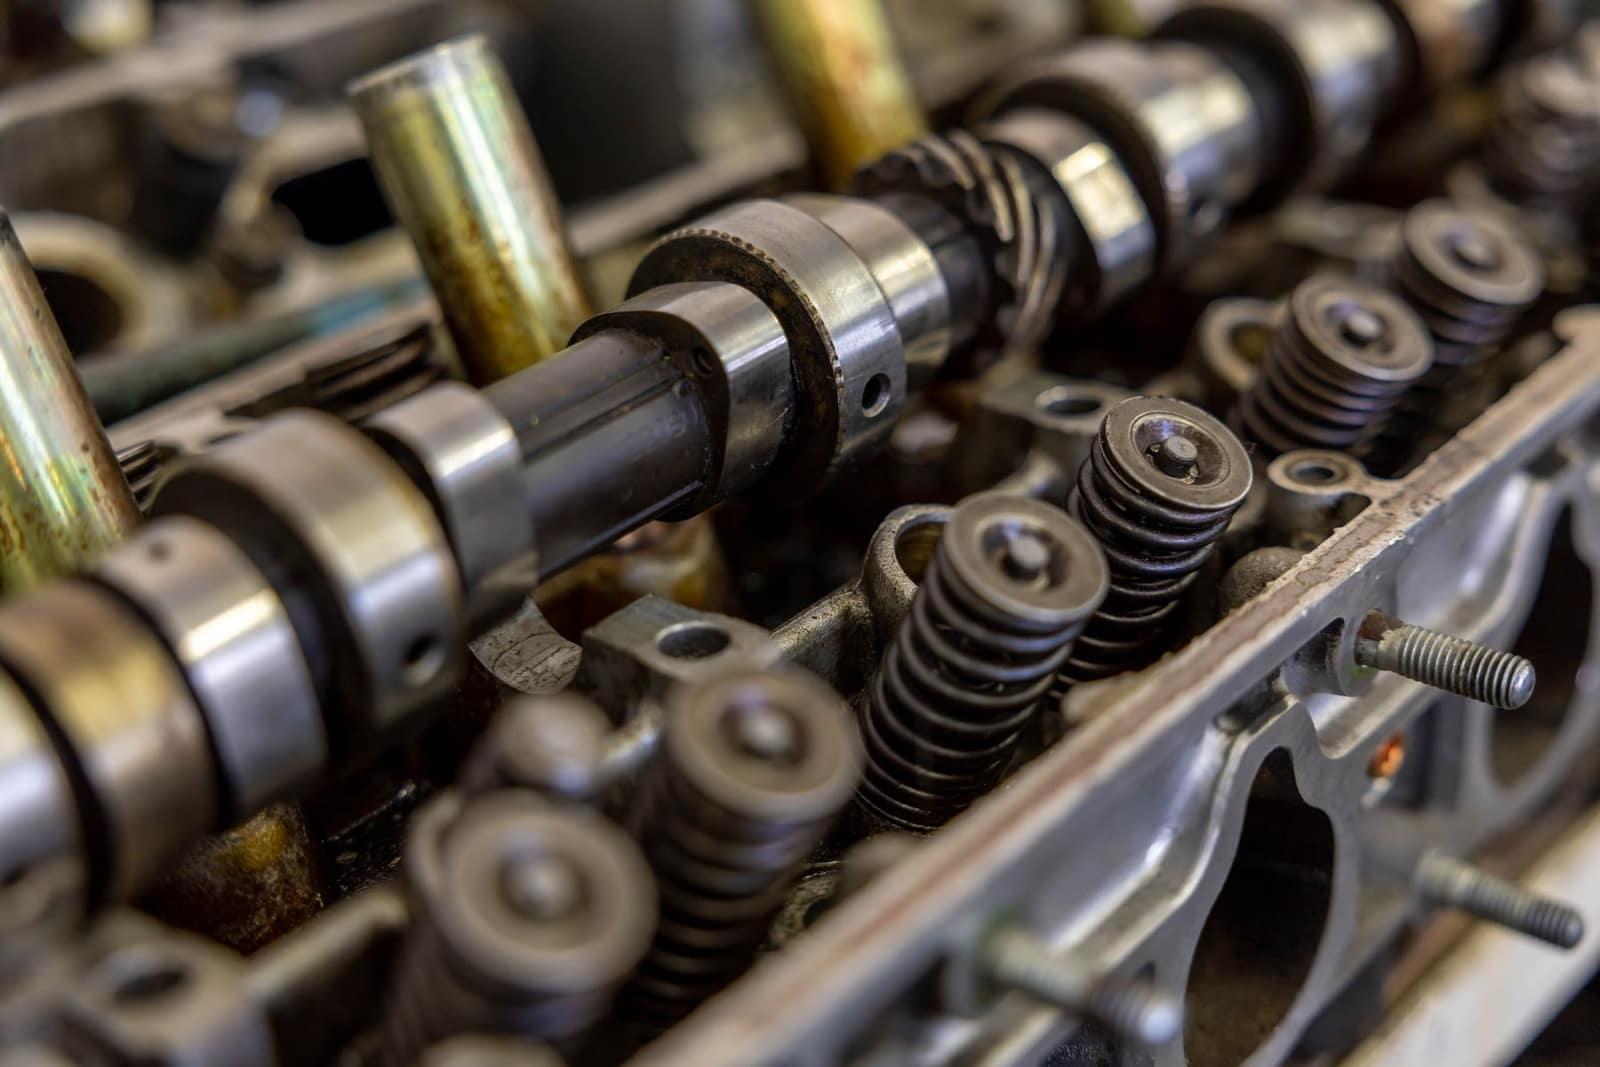 Free to importMachinery and partsAuto partsCar, bus and truck parts pay 15% BCD; tractor parts 10%. IGST is a uniform 18% on auto parts from 22 Sep 2025.Basic duty10–15%IGST18%India imported 2025-26US$ 6.97 bn
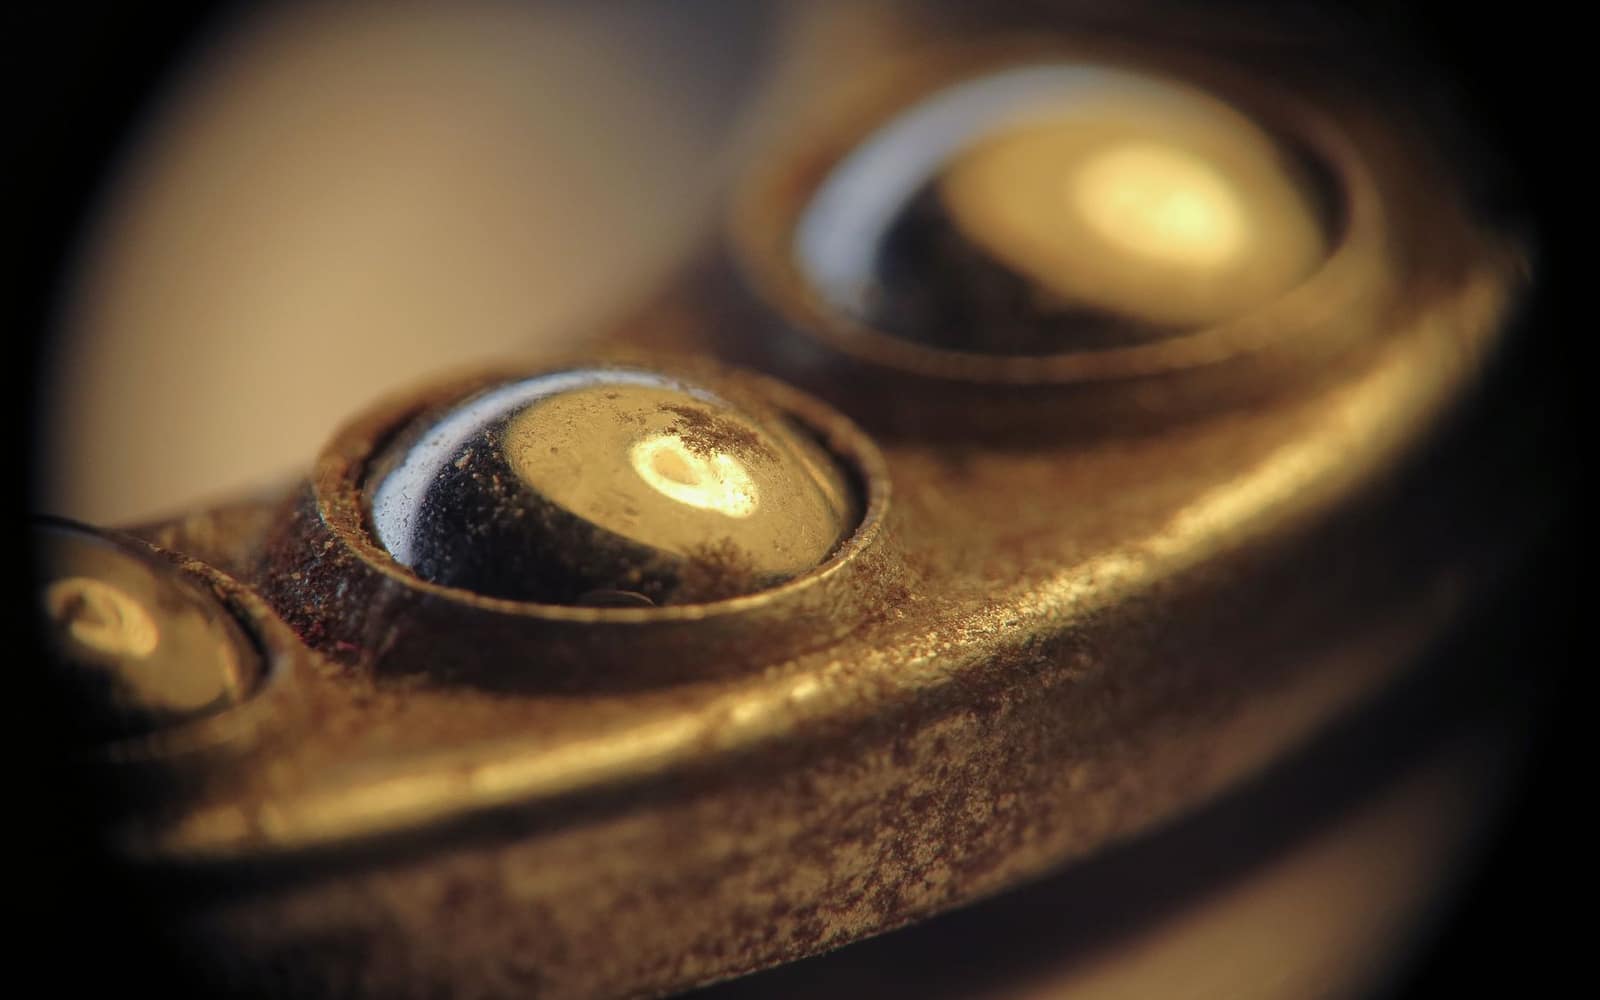 Free to importMachinery and partsBall and roller bearingsBearings pay 7.5% BCD, SWS on top and 18% IGST. Fake branded bearings are the biggest risk.Basic duty7.5%IGST18%India imported 2025-26US$ 1.57 bn
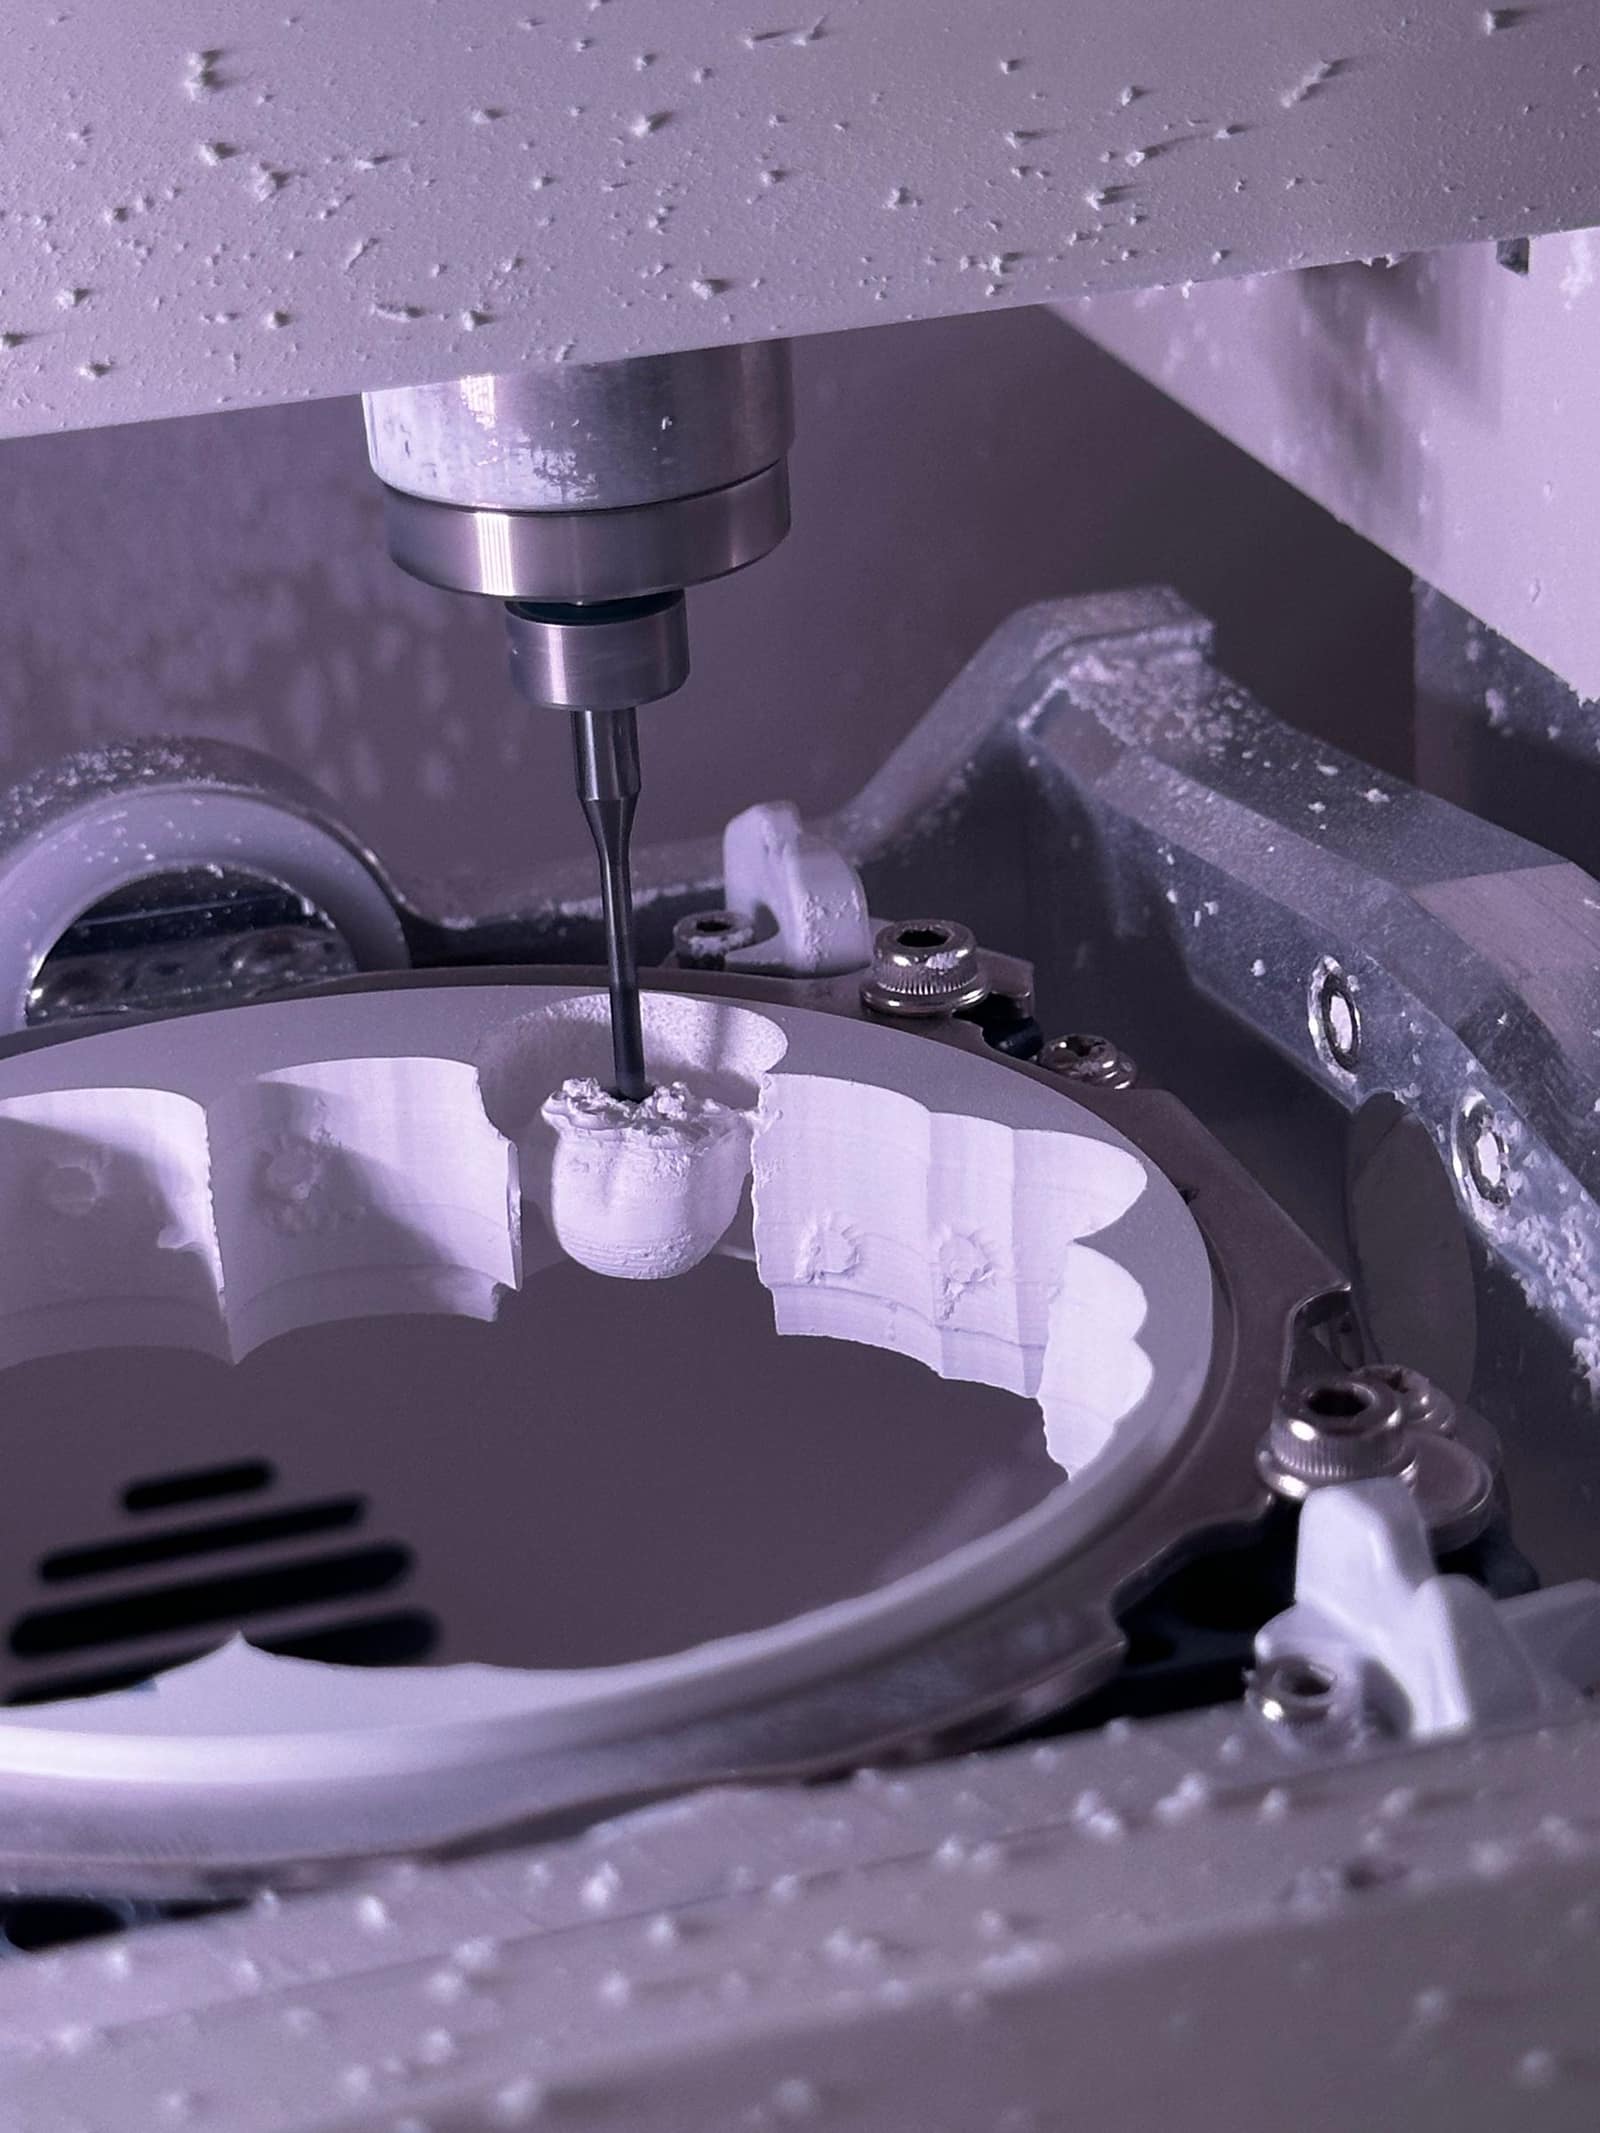 Free to importMachinery and partsCNC and machine toolsMachining centres, CNC lathes and laser cutters pay 7.5% BCD and 18% IGST; Japan and China are the main suppliers.Basic duty7.5%IGST18%India imported 2025-26US$ 1.87 bn
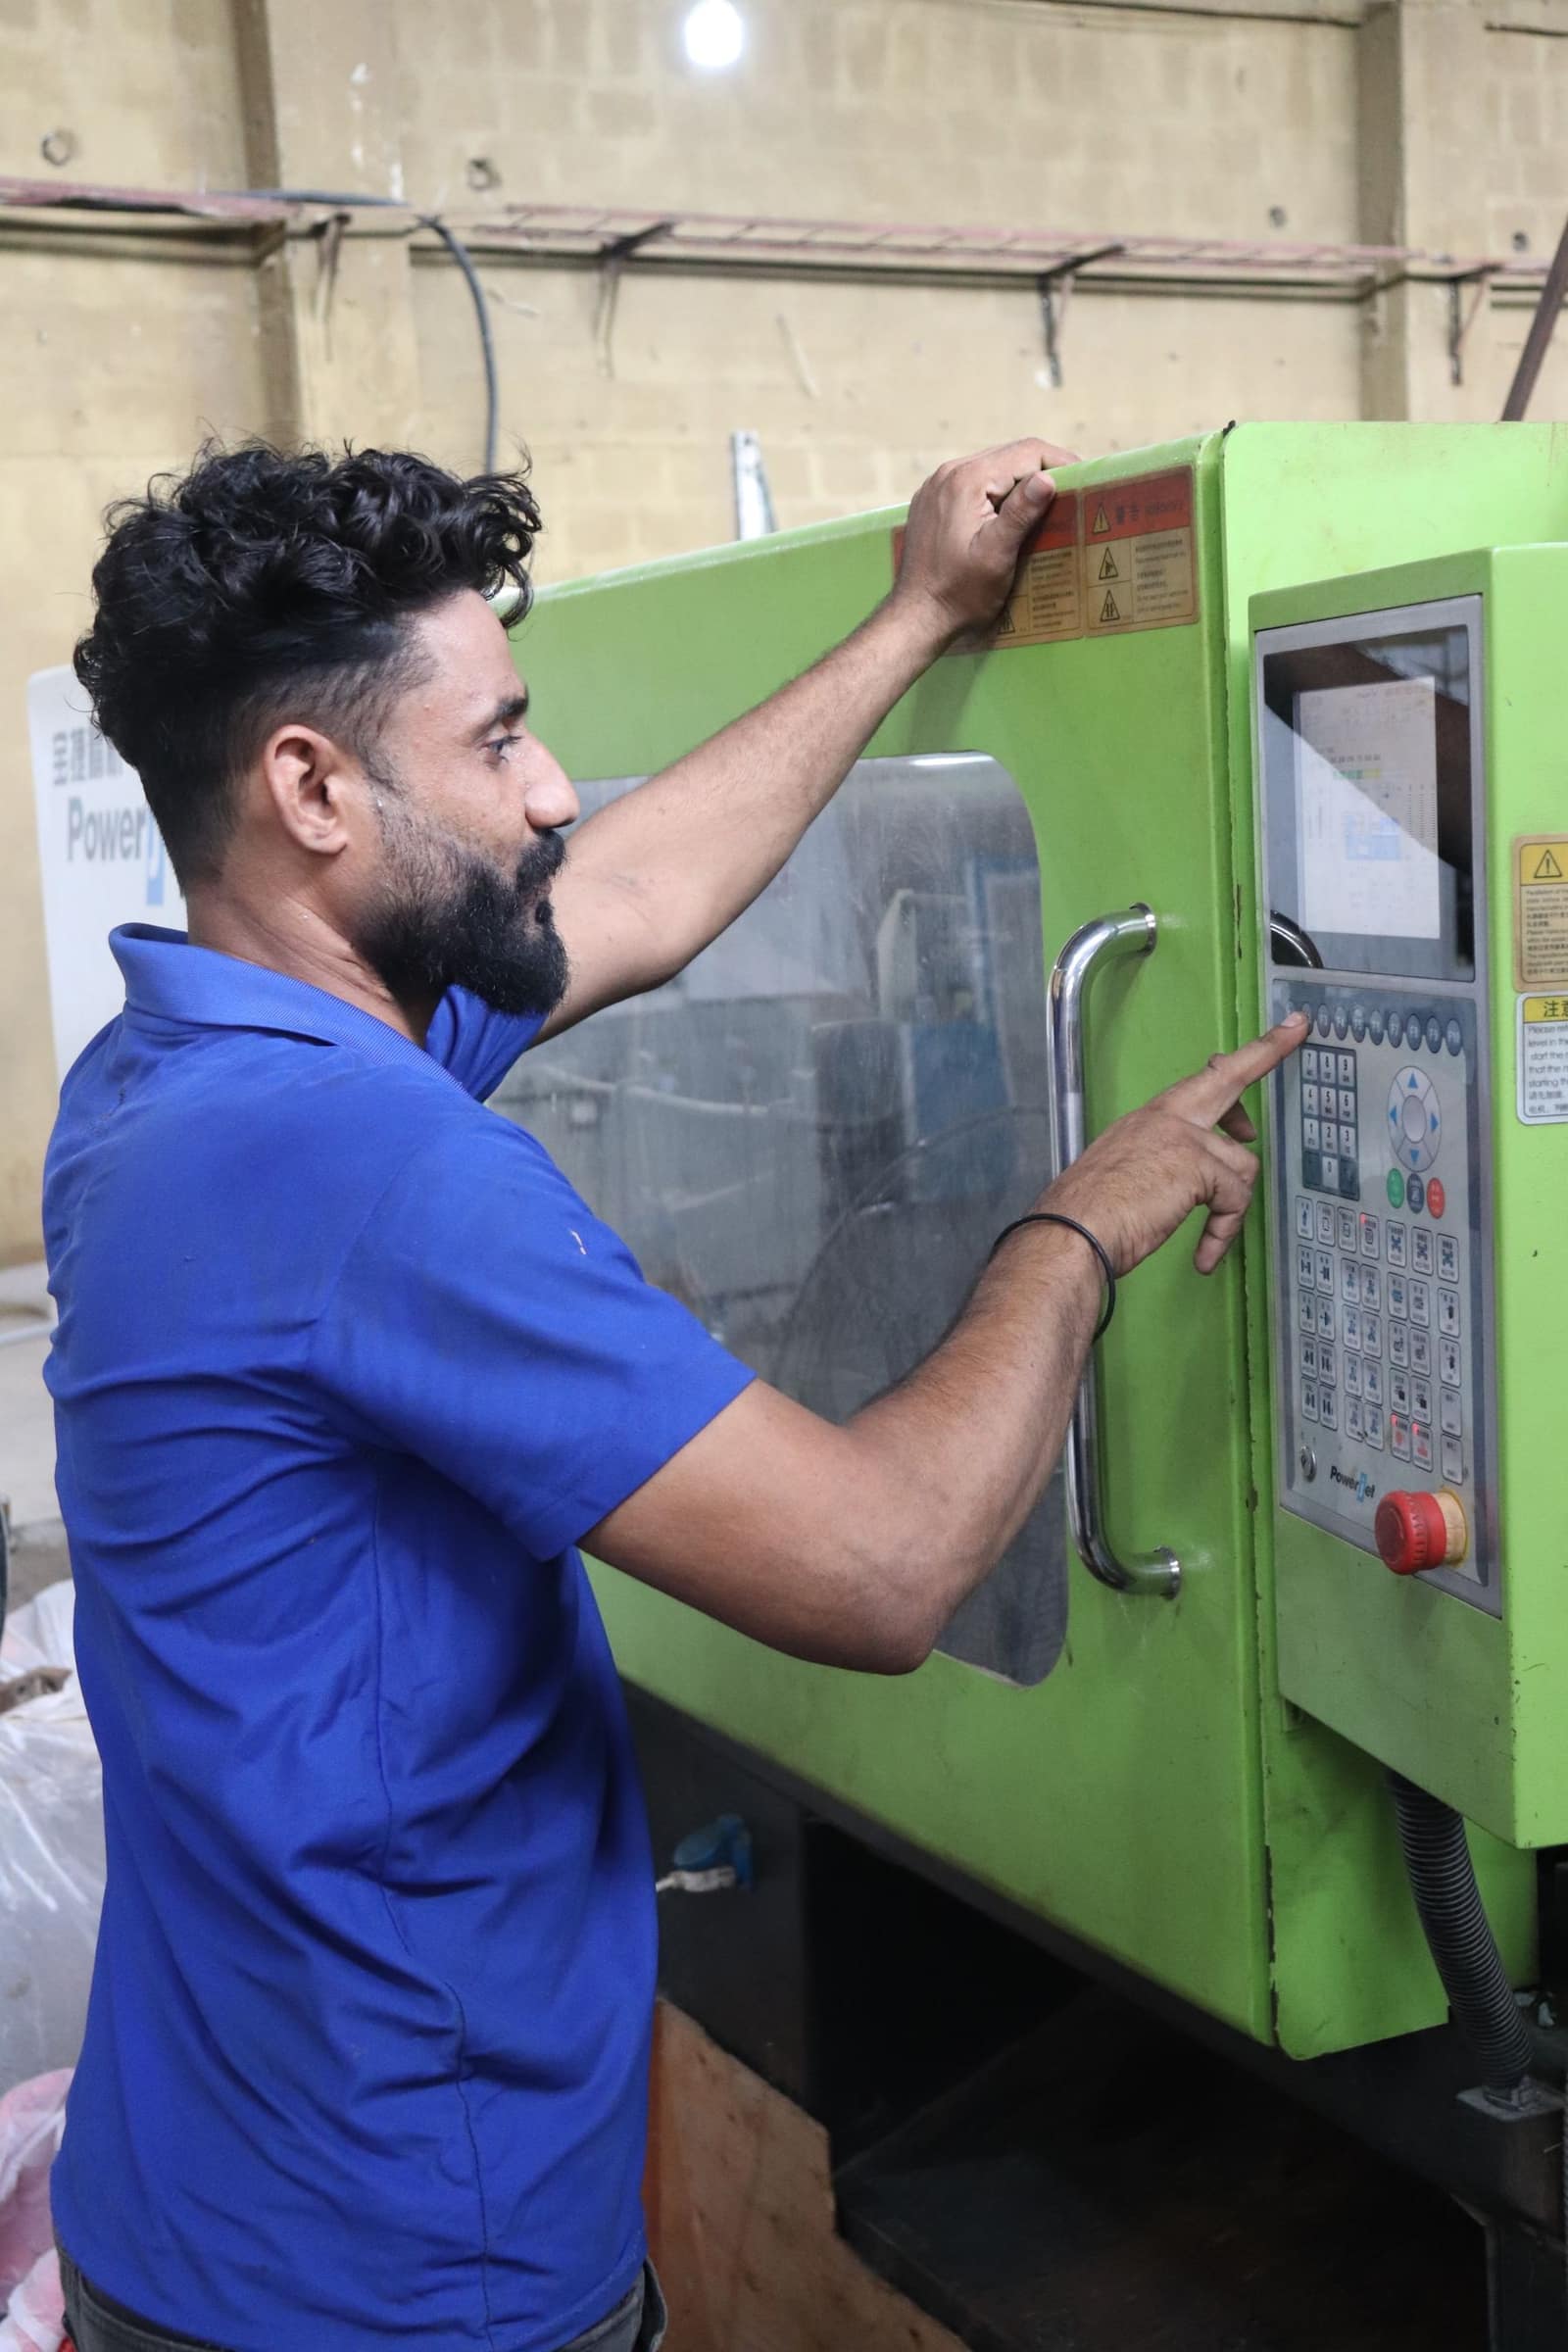 Free to importMachinery and partsInjection moulding machines7.5% BCD and 18% IGST, plus anti-dumping duty on many machines from China and Taiwan since June 2025.Basic duty7.5%IGST18%India imported 2025-26US$ 286 mn
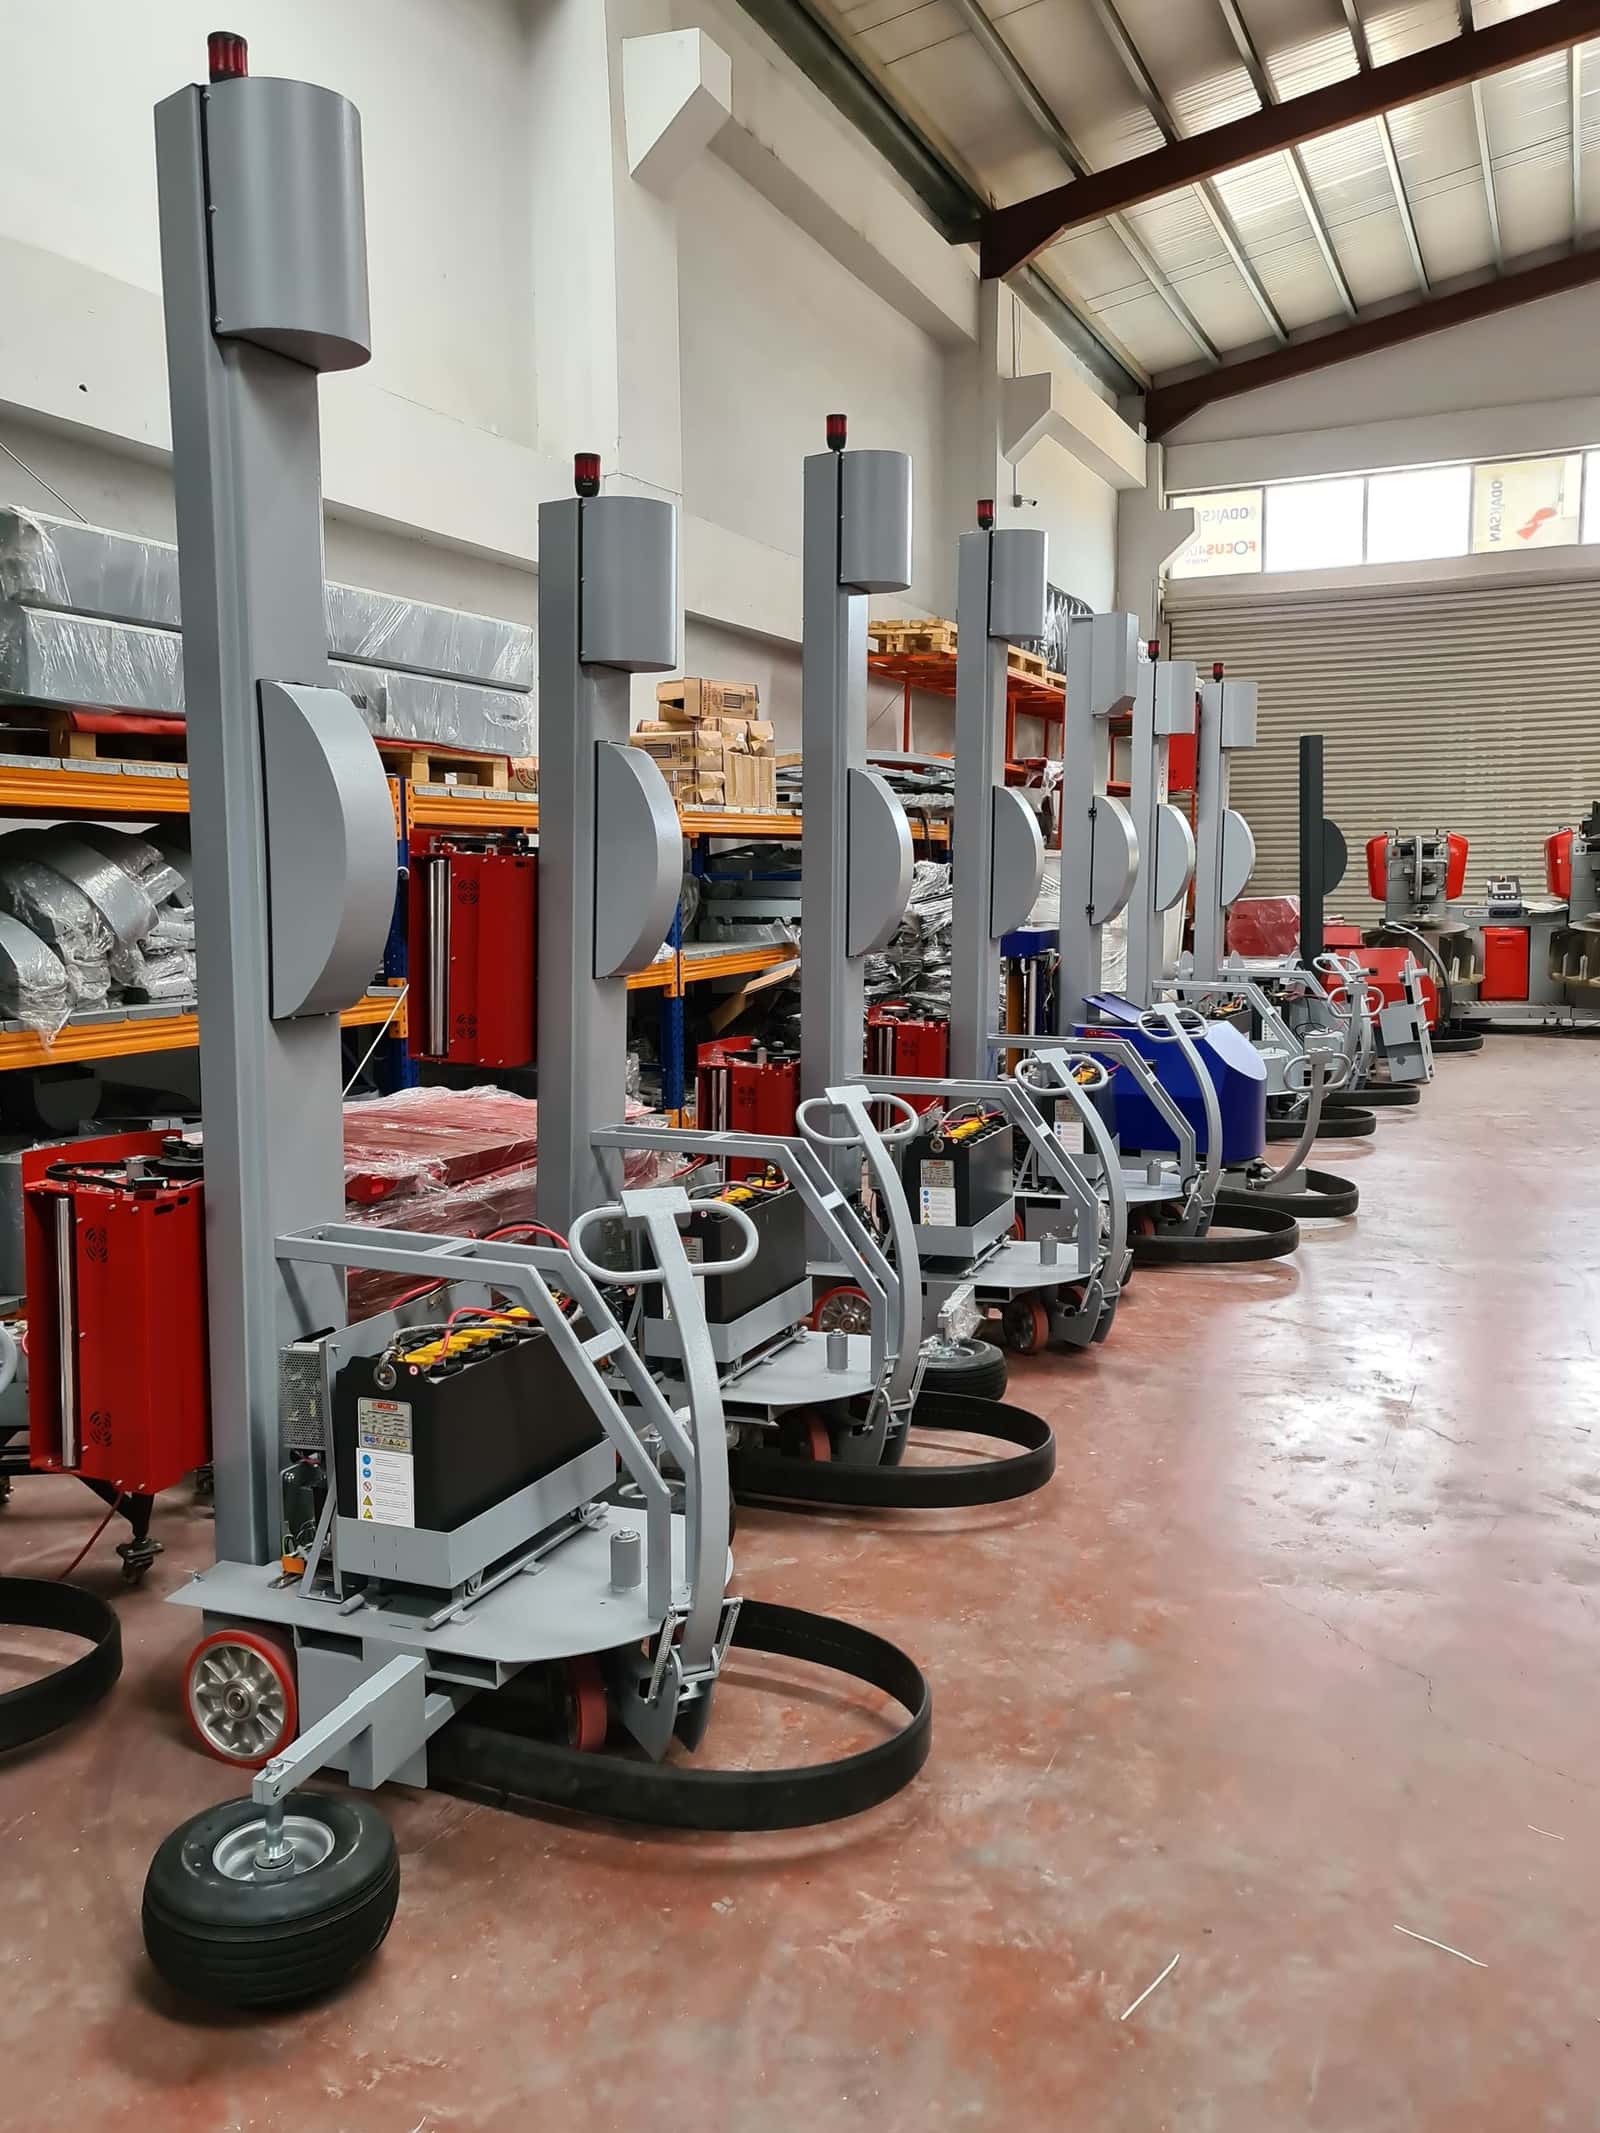 Free to importMachinery and partsPackaging machineryFilling, sealing, labelling and wrapping machines pay 7.5% BCD and 18% IGST; Germany, Italy and China supply most.Basic duty7.5–10%IGST18%India imported 2025-26US$ 917 mn
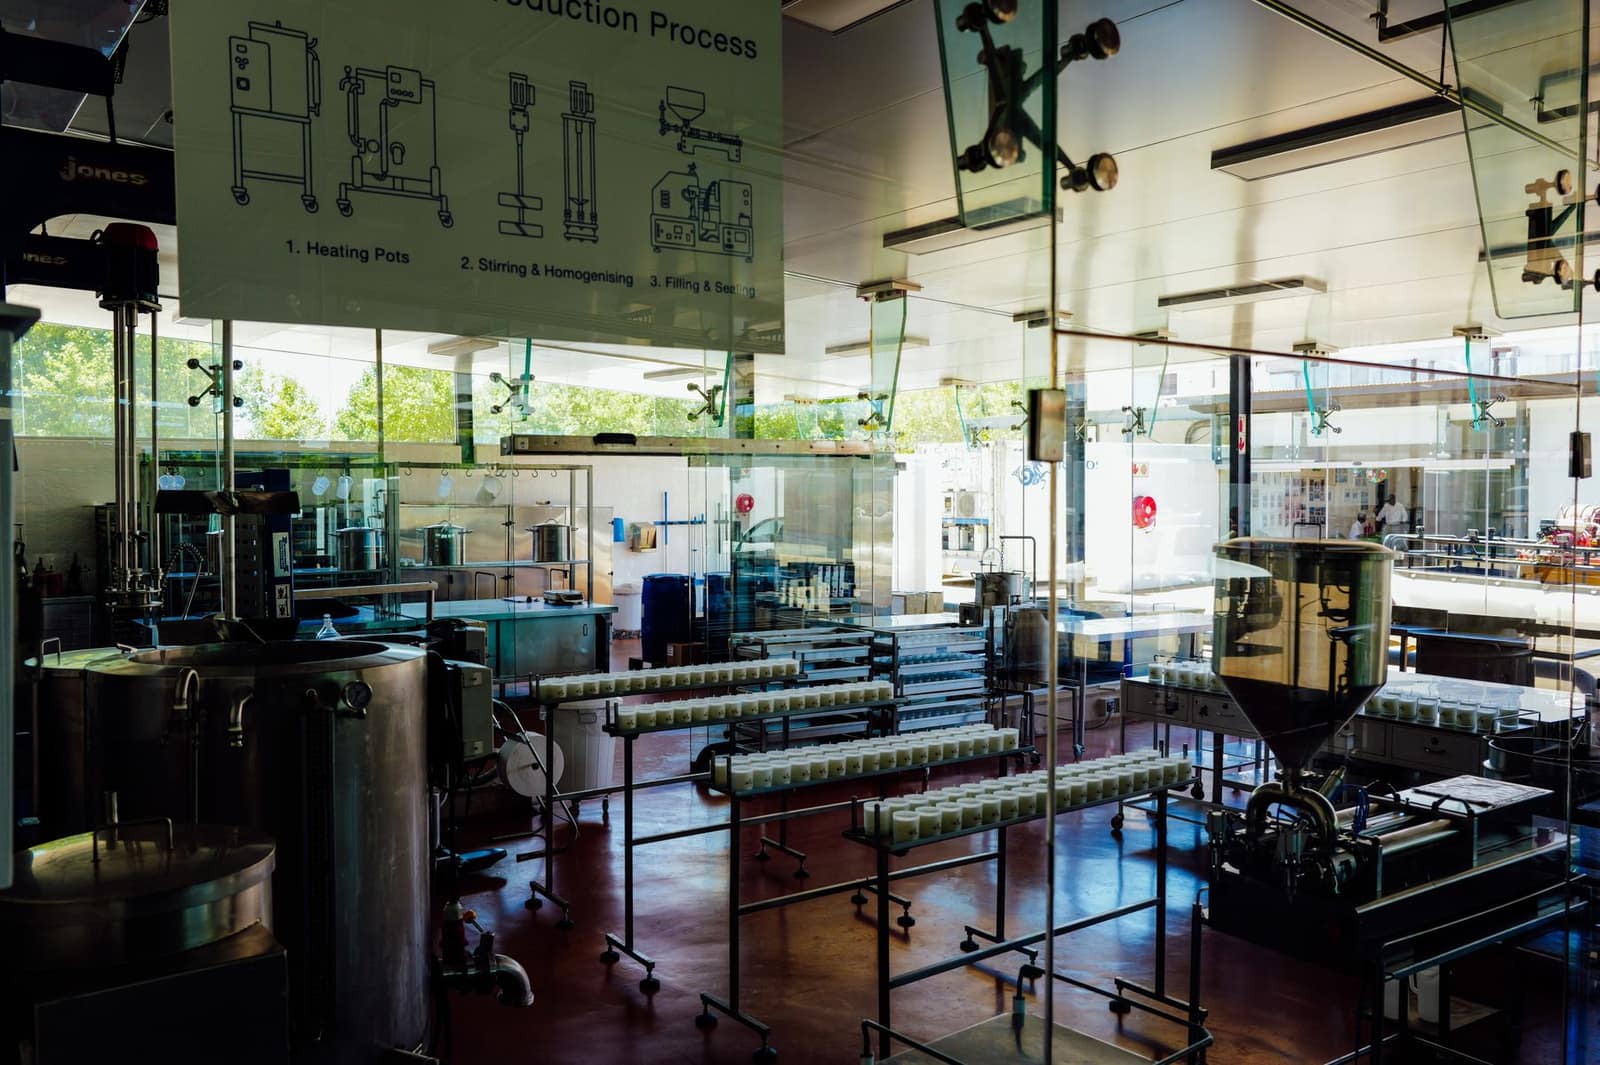 Free to importMachinery and partsFood processing machinery7.5% BCD, 10% SWS and 18% IGST on most lines. No BIS certificate after the machinery order was withdrawn in January 2026.Basic duty7.5%IGST18%India imported 2025-26US$ 325 mn
 Free to importMachinery and partsConstruction equipment (excavators, loaders)7.5% BCD, 10% SWS and 18% IGST. Machines driven on public roads also need type approval under the motor vehicle rules.Basic duty7.5%IGST18%India imported 2025-26US$ 511 mn
 Free to importMachinery and partsAir compressorsIndustrial air compressors pay 7.5% BCD (effective), refrigeration compressors 15%; 10% SWS and 18% IGST on both.Basic duty7.5–15%IGST18%India imported 2025-26US$ 1.64 bn
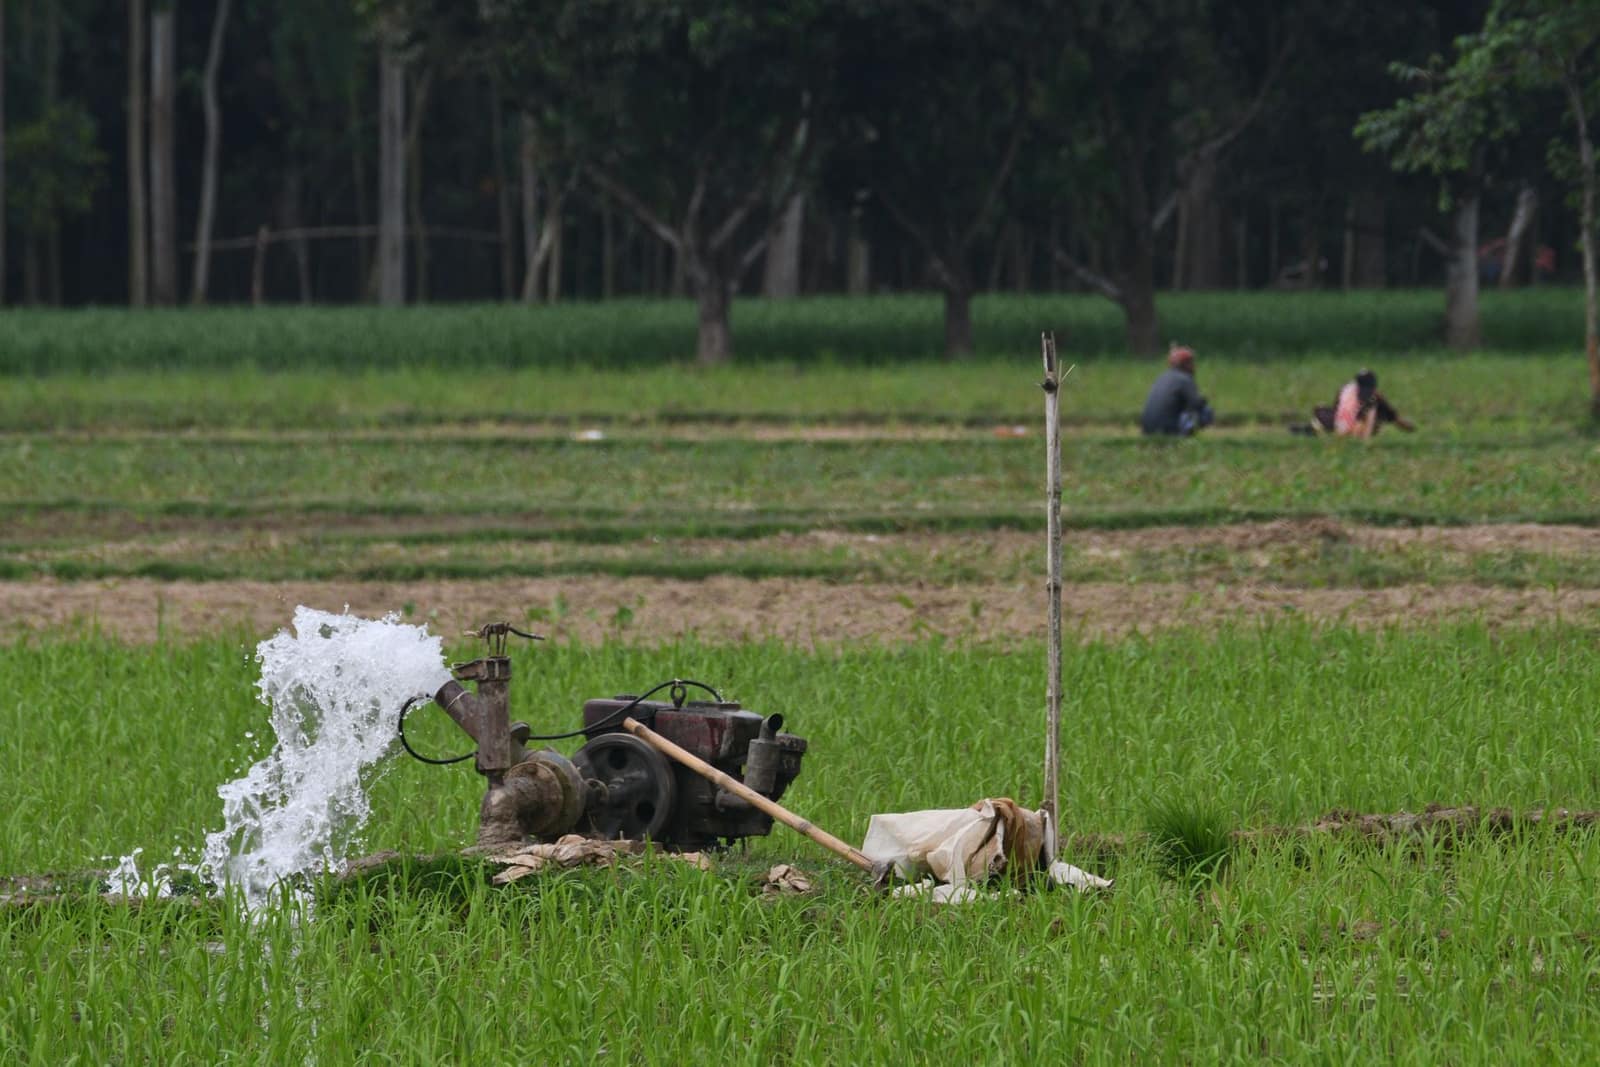 Free to importMachinery and partsPumps7.5% BCD on most power pumps (10% on hand pumps), 10% SWS, and 18% IGST — hand pumps 5%.Basic duty7.5–10%IGST5–18%India imported 2025-26US$ 1.62 bn
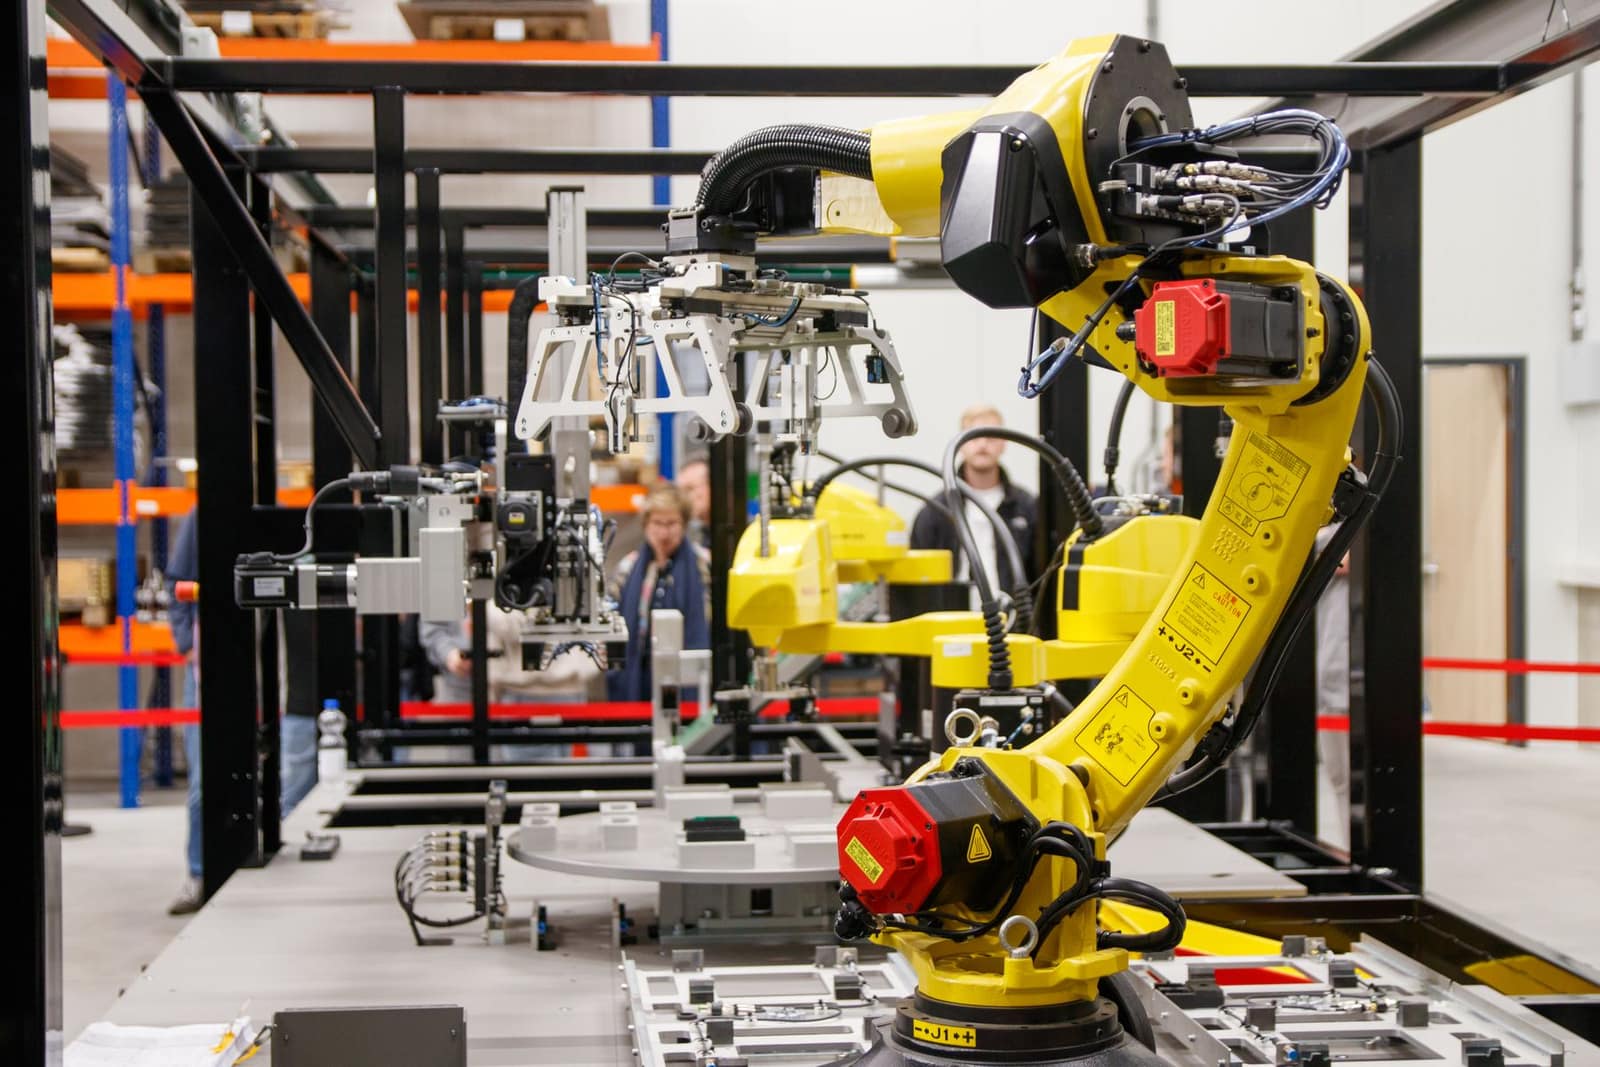 Free to importMachinery and partsIndustrial robots7.5% BCD, 10% SWS and 18% IGST. Robots with wireless teach pendants or modules may need WPC approval.Basic duty7.5%IGST18%India imported 2025-26US$ 247 mn
Consumer goods
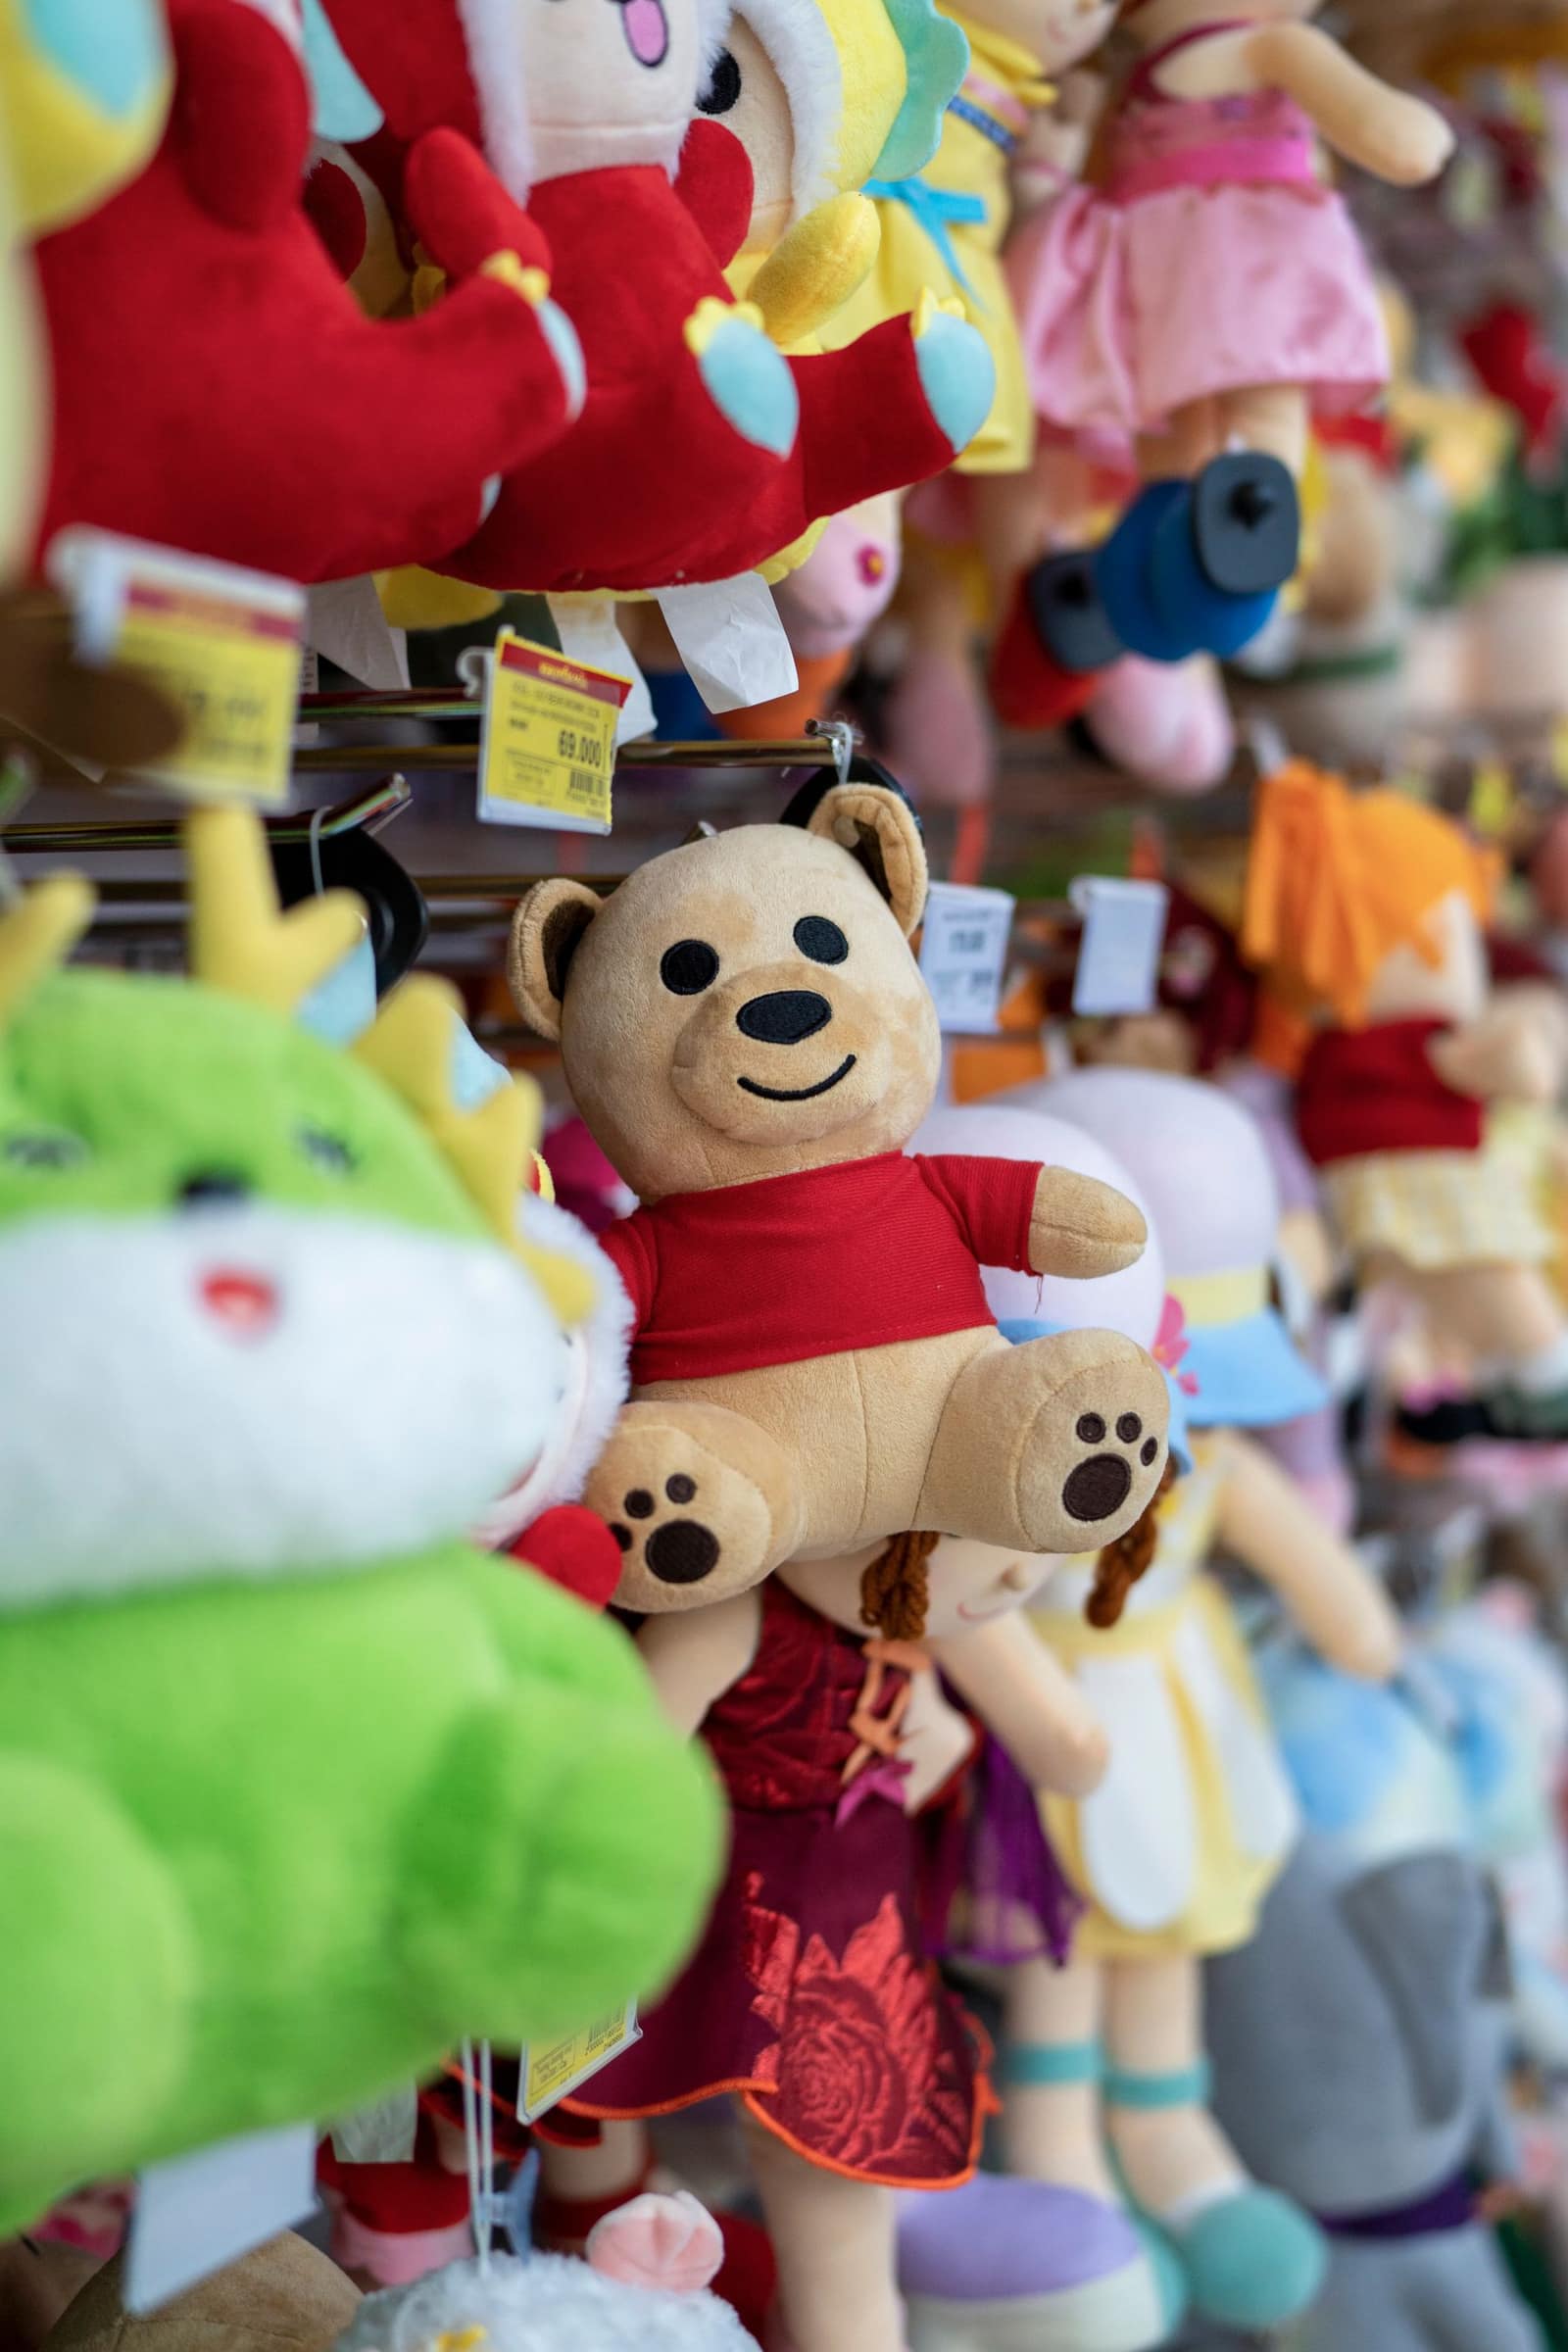 Free, with conditionsConsumer goodsToys70% BCD, no SWS, and every toy must carry the BIS mark under the Toys QCO. IGST is 5% for non-electronic toys, 18% for electronic toys.Basic duty70%IGST5–18%India imported 2025-26US$ 95.7 mn
 Free to importConsumer goodsFurniture20% BCD plus 5% AIDC and 18% IGST. The Furniture QCO, 2025 makes BIS certification compulsory for covered items.Basic duty20%IGST5–18%India imported 2025-26US$ 637 mn
 Free to importConsumer goodsCosmetics and skin care20% BCD, SWS and 18% IGST. Every imported cosmetic needs a CDSCO import registration certificate before it arrives.Basic duty20%IGST5–18%India imported 2025-26US$ 484 mn
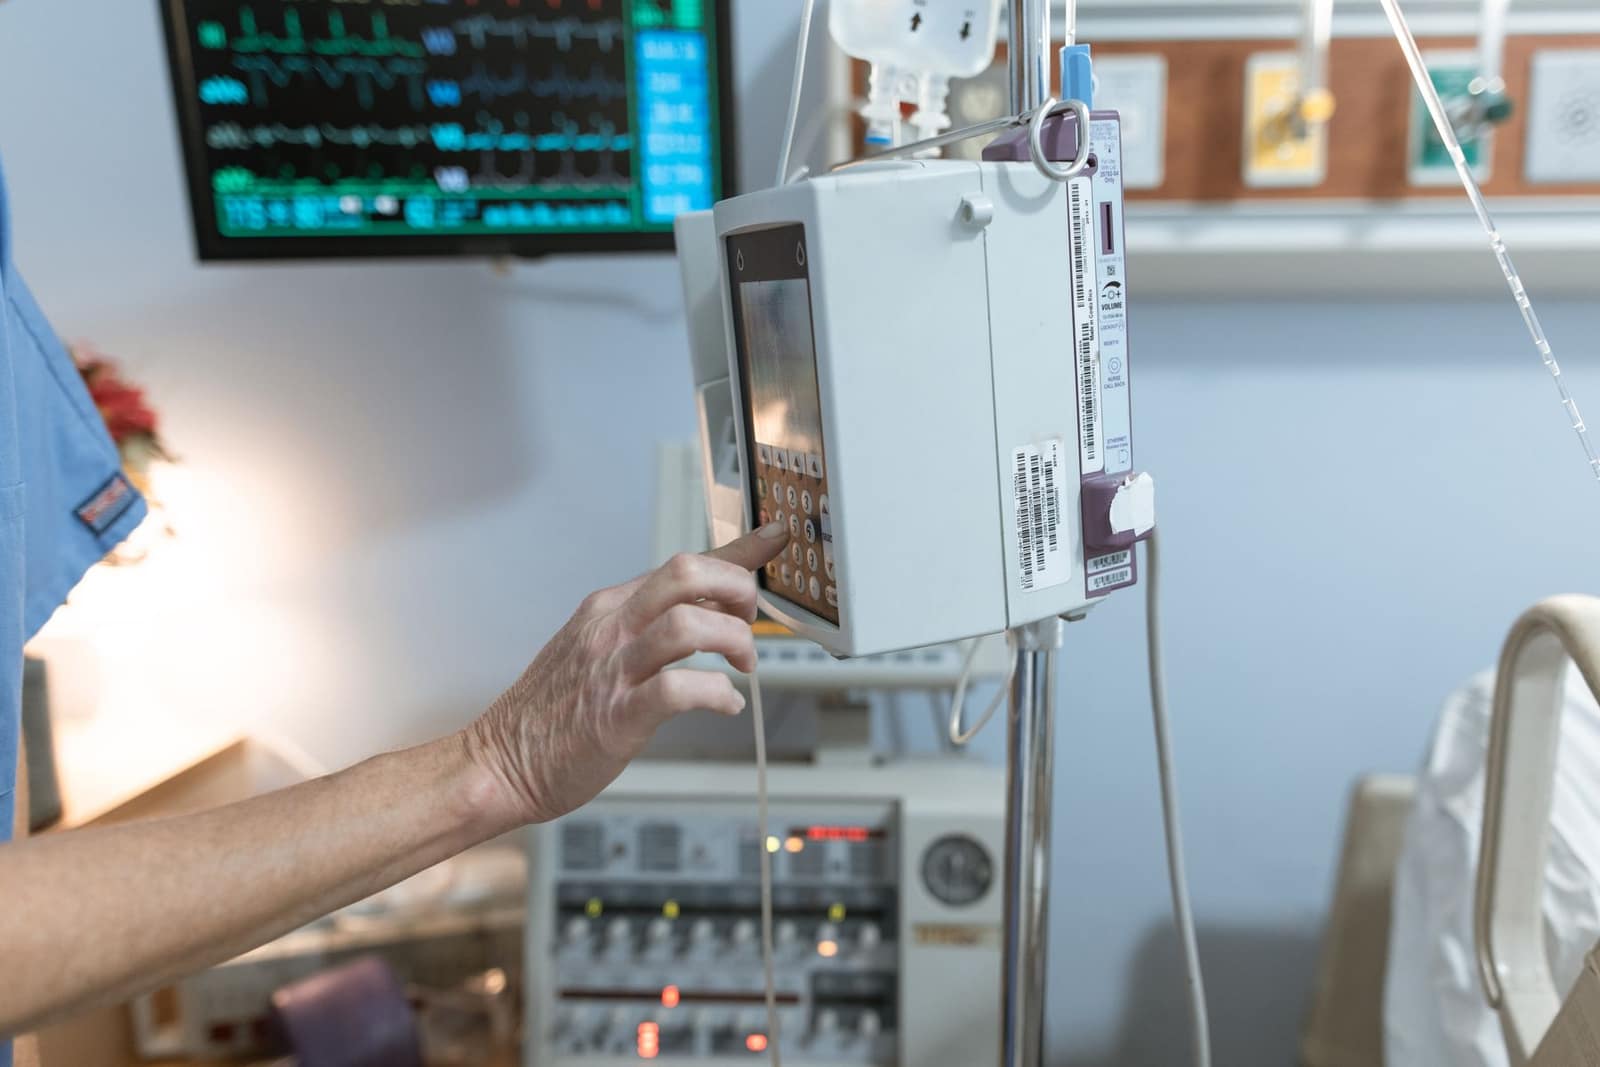 Free to importConsumer goodsMedical devices and instrumentsMostly 7.5% BCD and 5% IGST, plus a Health Cess. Every device needs a CDSCO import licence under the Medical Devices Rules, 2017.Basic duty5–7.5%IGST5%India imported 2025-26US$ 3.1 bn
 Free to importConsumer goodsCeramic sanitaryware10% BCD, SWS on top and 18% IGST. Breakage in transit and quality checks matter more than paperwork.Basic duty10%IGST18%India imported 2025-26US$ 80.8 mn
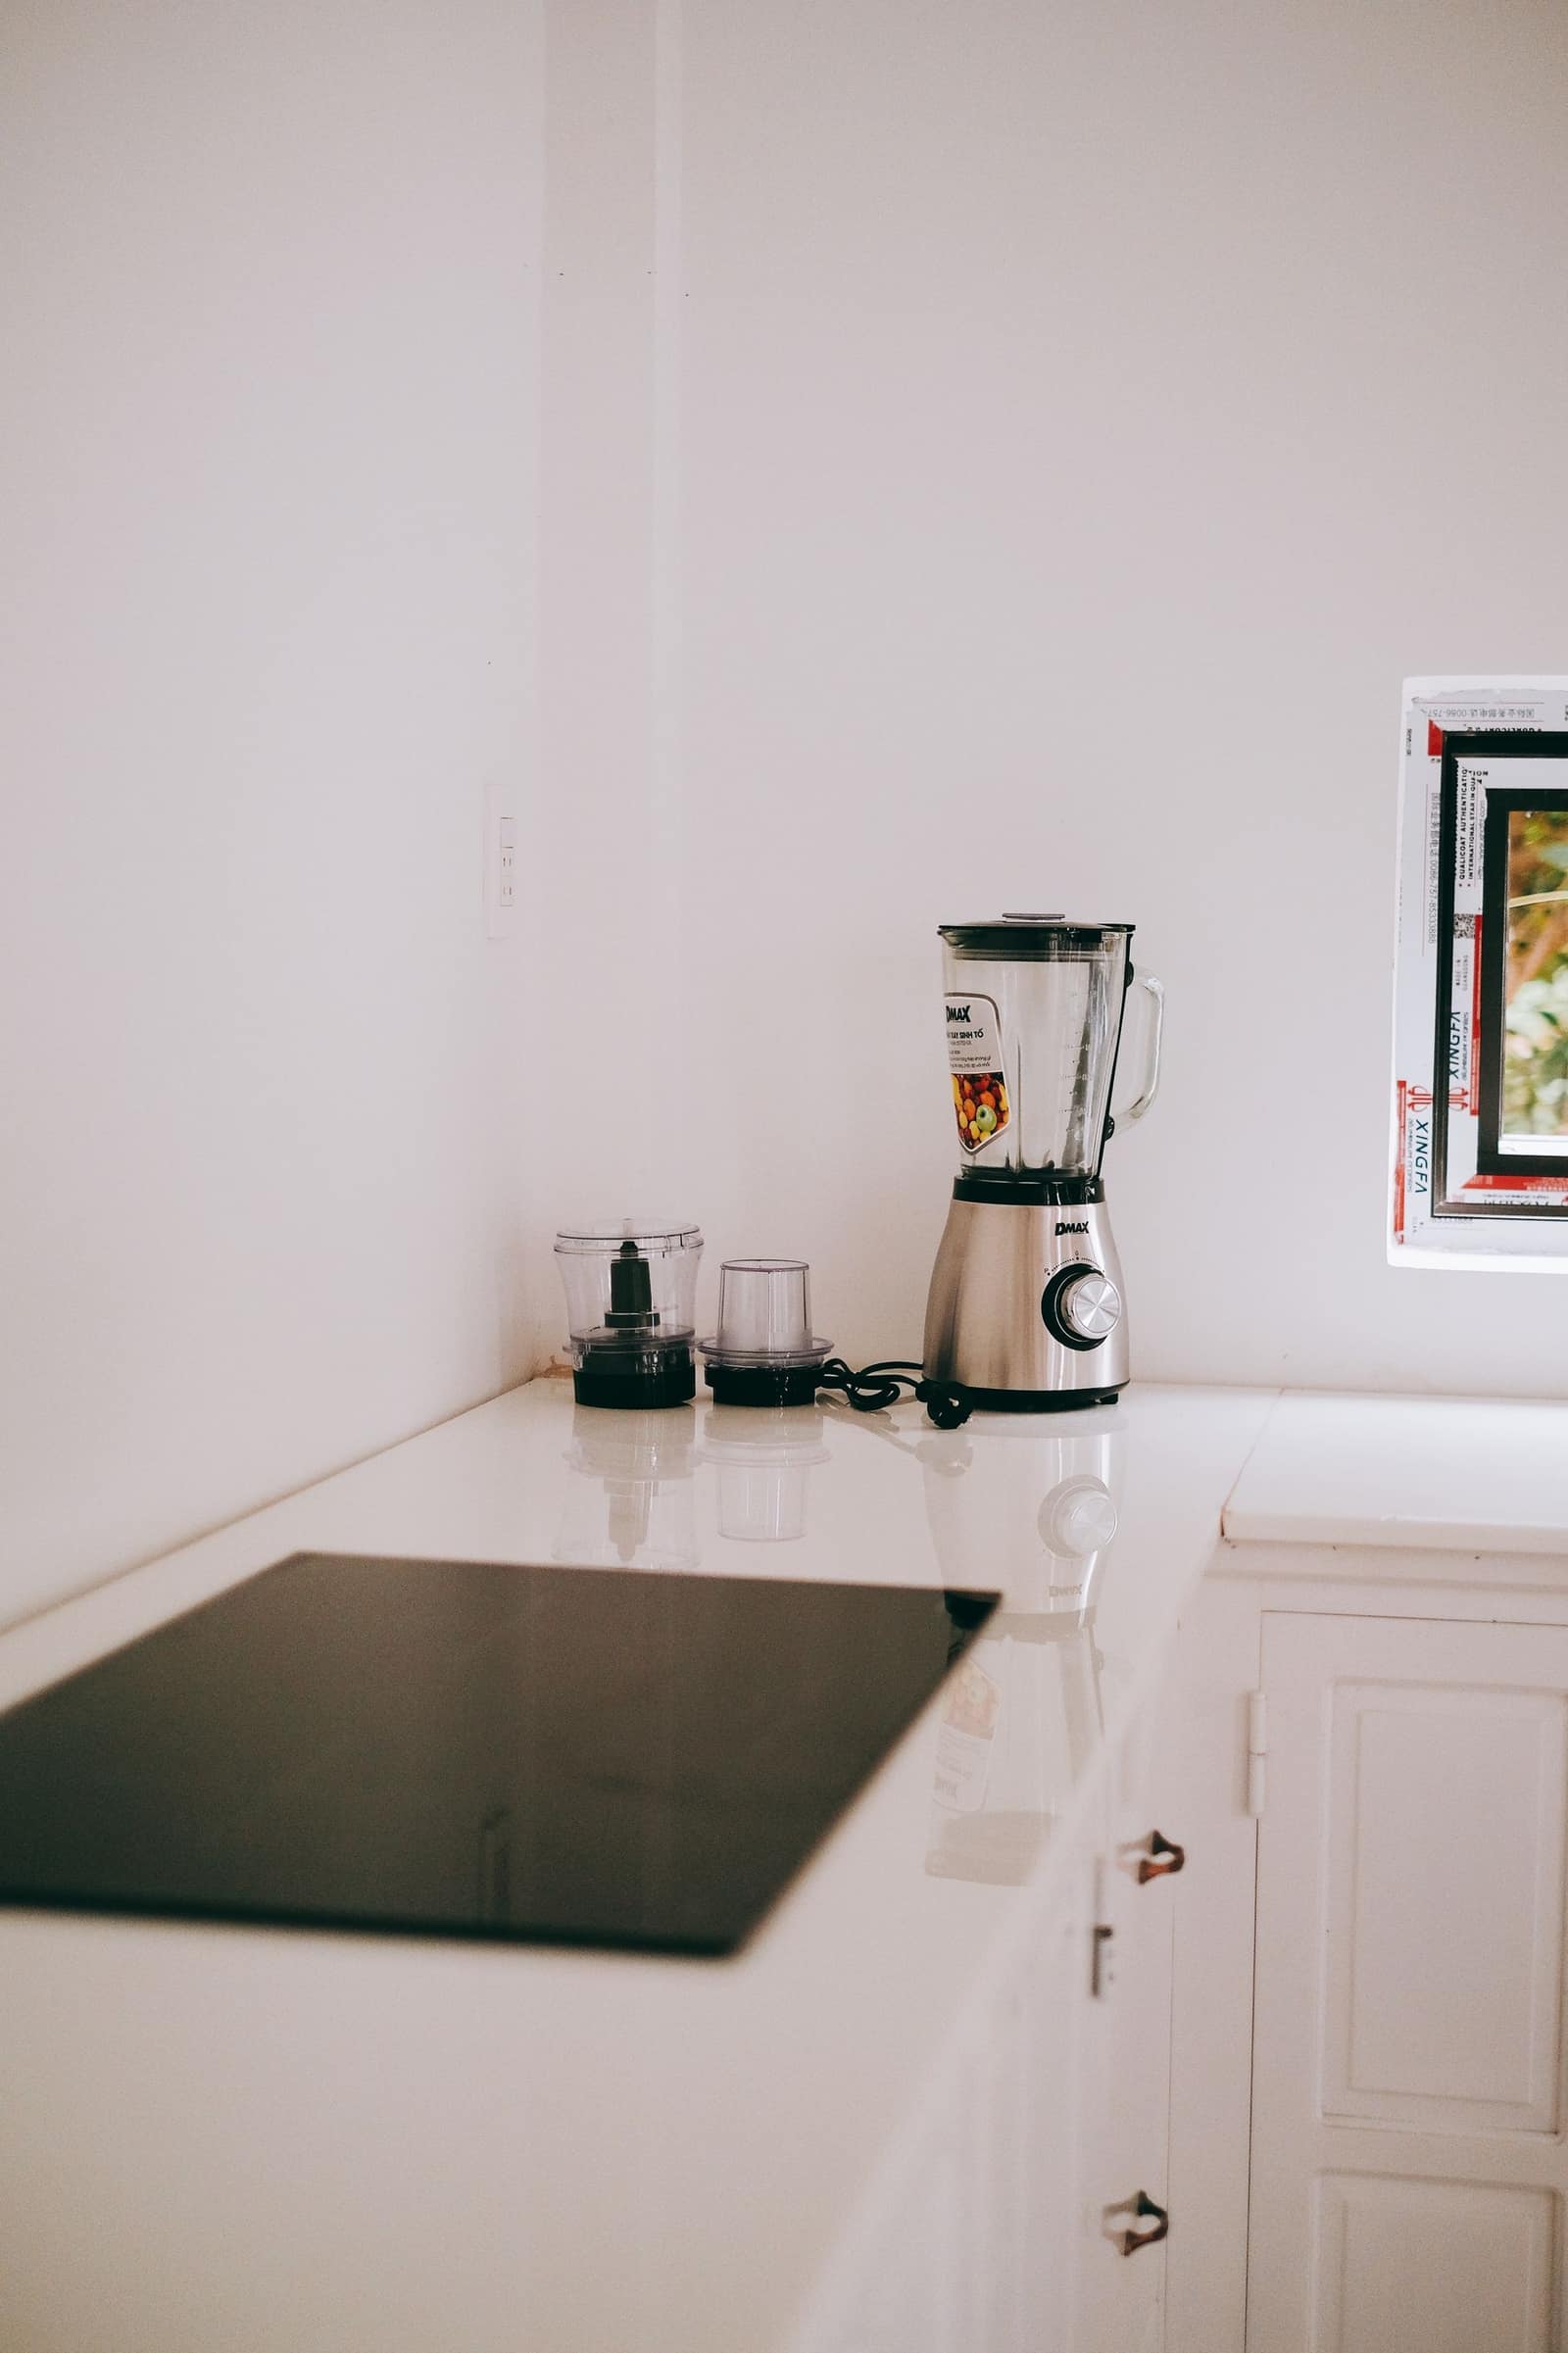 Free to importConsumer goodsKitchen appliances20% BCD, 10% SWS and 18% IGST. A BIS safety order for household electrical appliances has applied since March 2026.Basic duty10–20%IGST18%India imported 2025-26US$ 622 mn
 Free to importConsumer goodsBicyclesTariff BCD cut from 35% to 20% on 1 May 2025; 5% IGST since September 2025. Used bicycles also pay 15% AIDC.Basic duty20%IGST5%India imported 2025-26US$ 4.5 mn
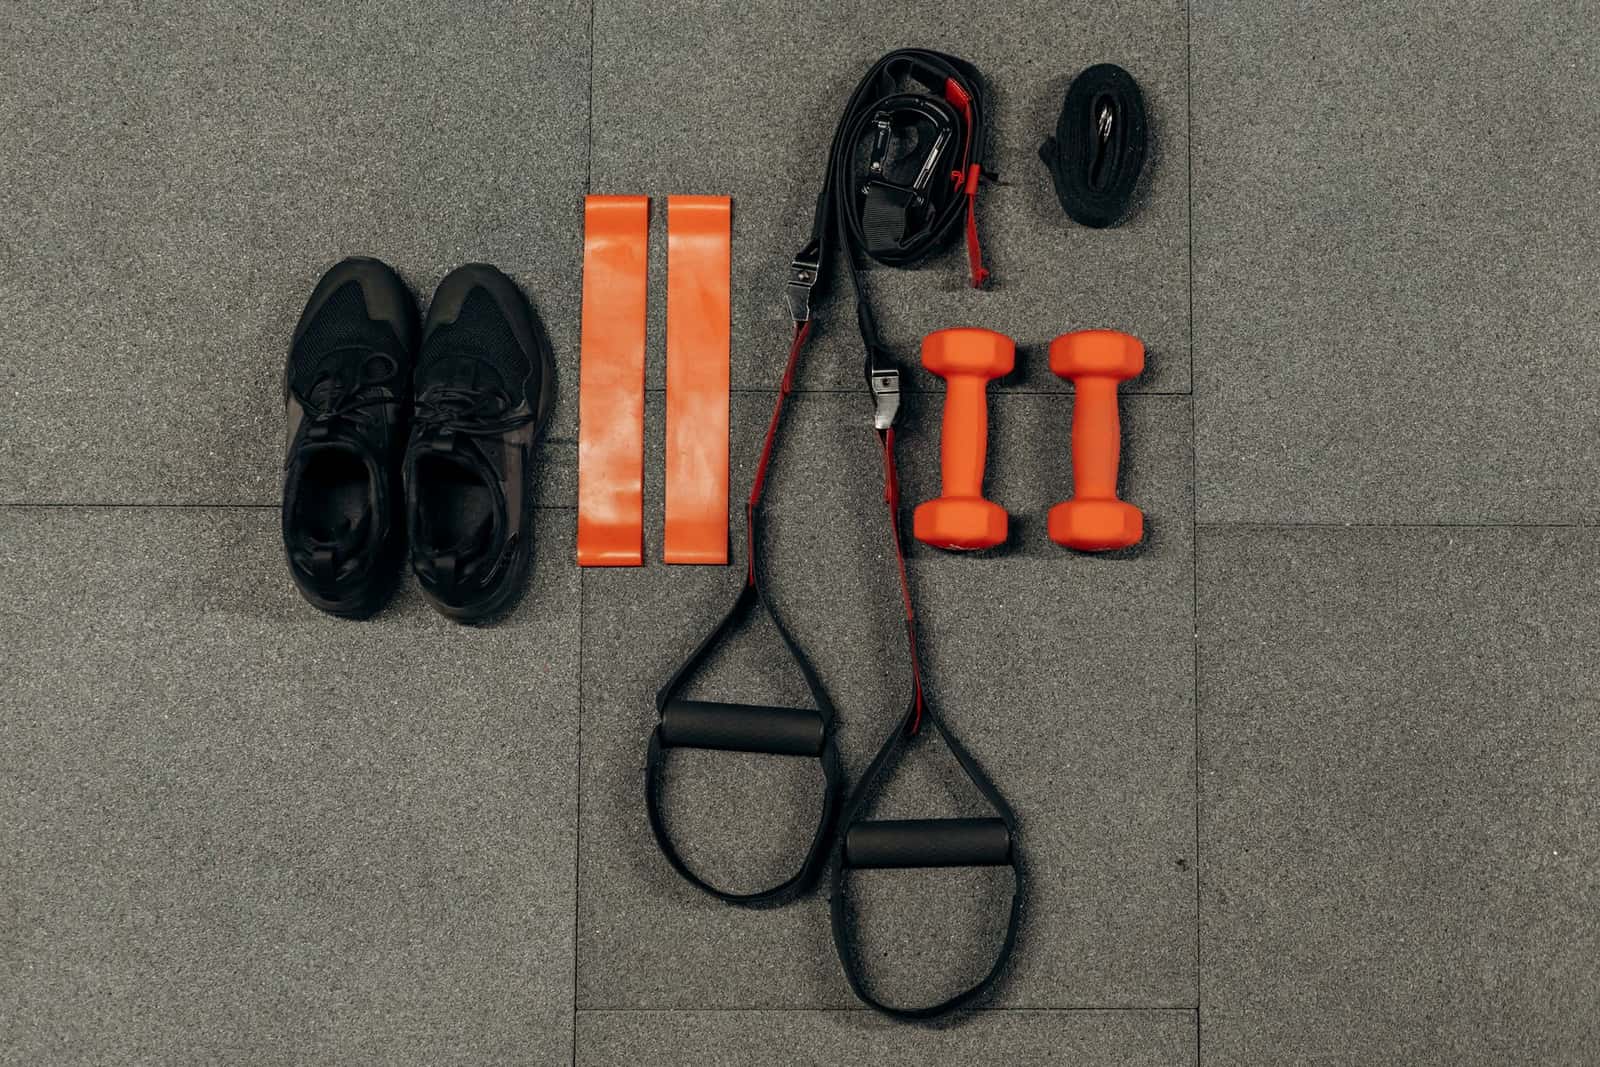 Free to importConsumer goodsSports equipment20% BCD on most sports goods, 10% on gym equipment; IGST 5% for sports goods and 18% for fitness equipment.Basic duty10–20%IGST5–18%India imported 2025-26US$ 373 mn
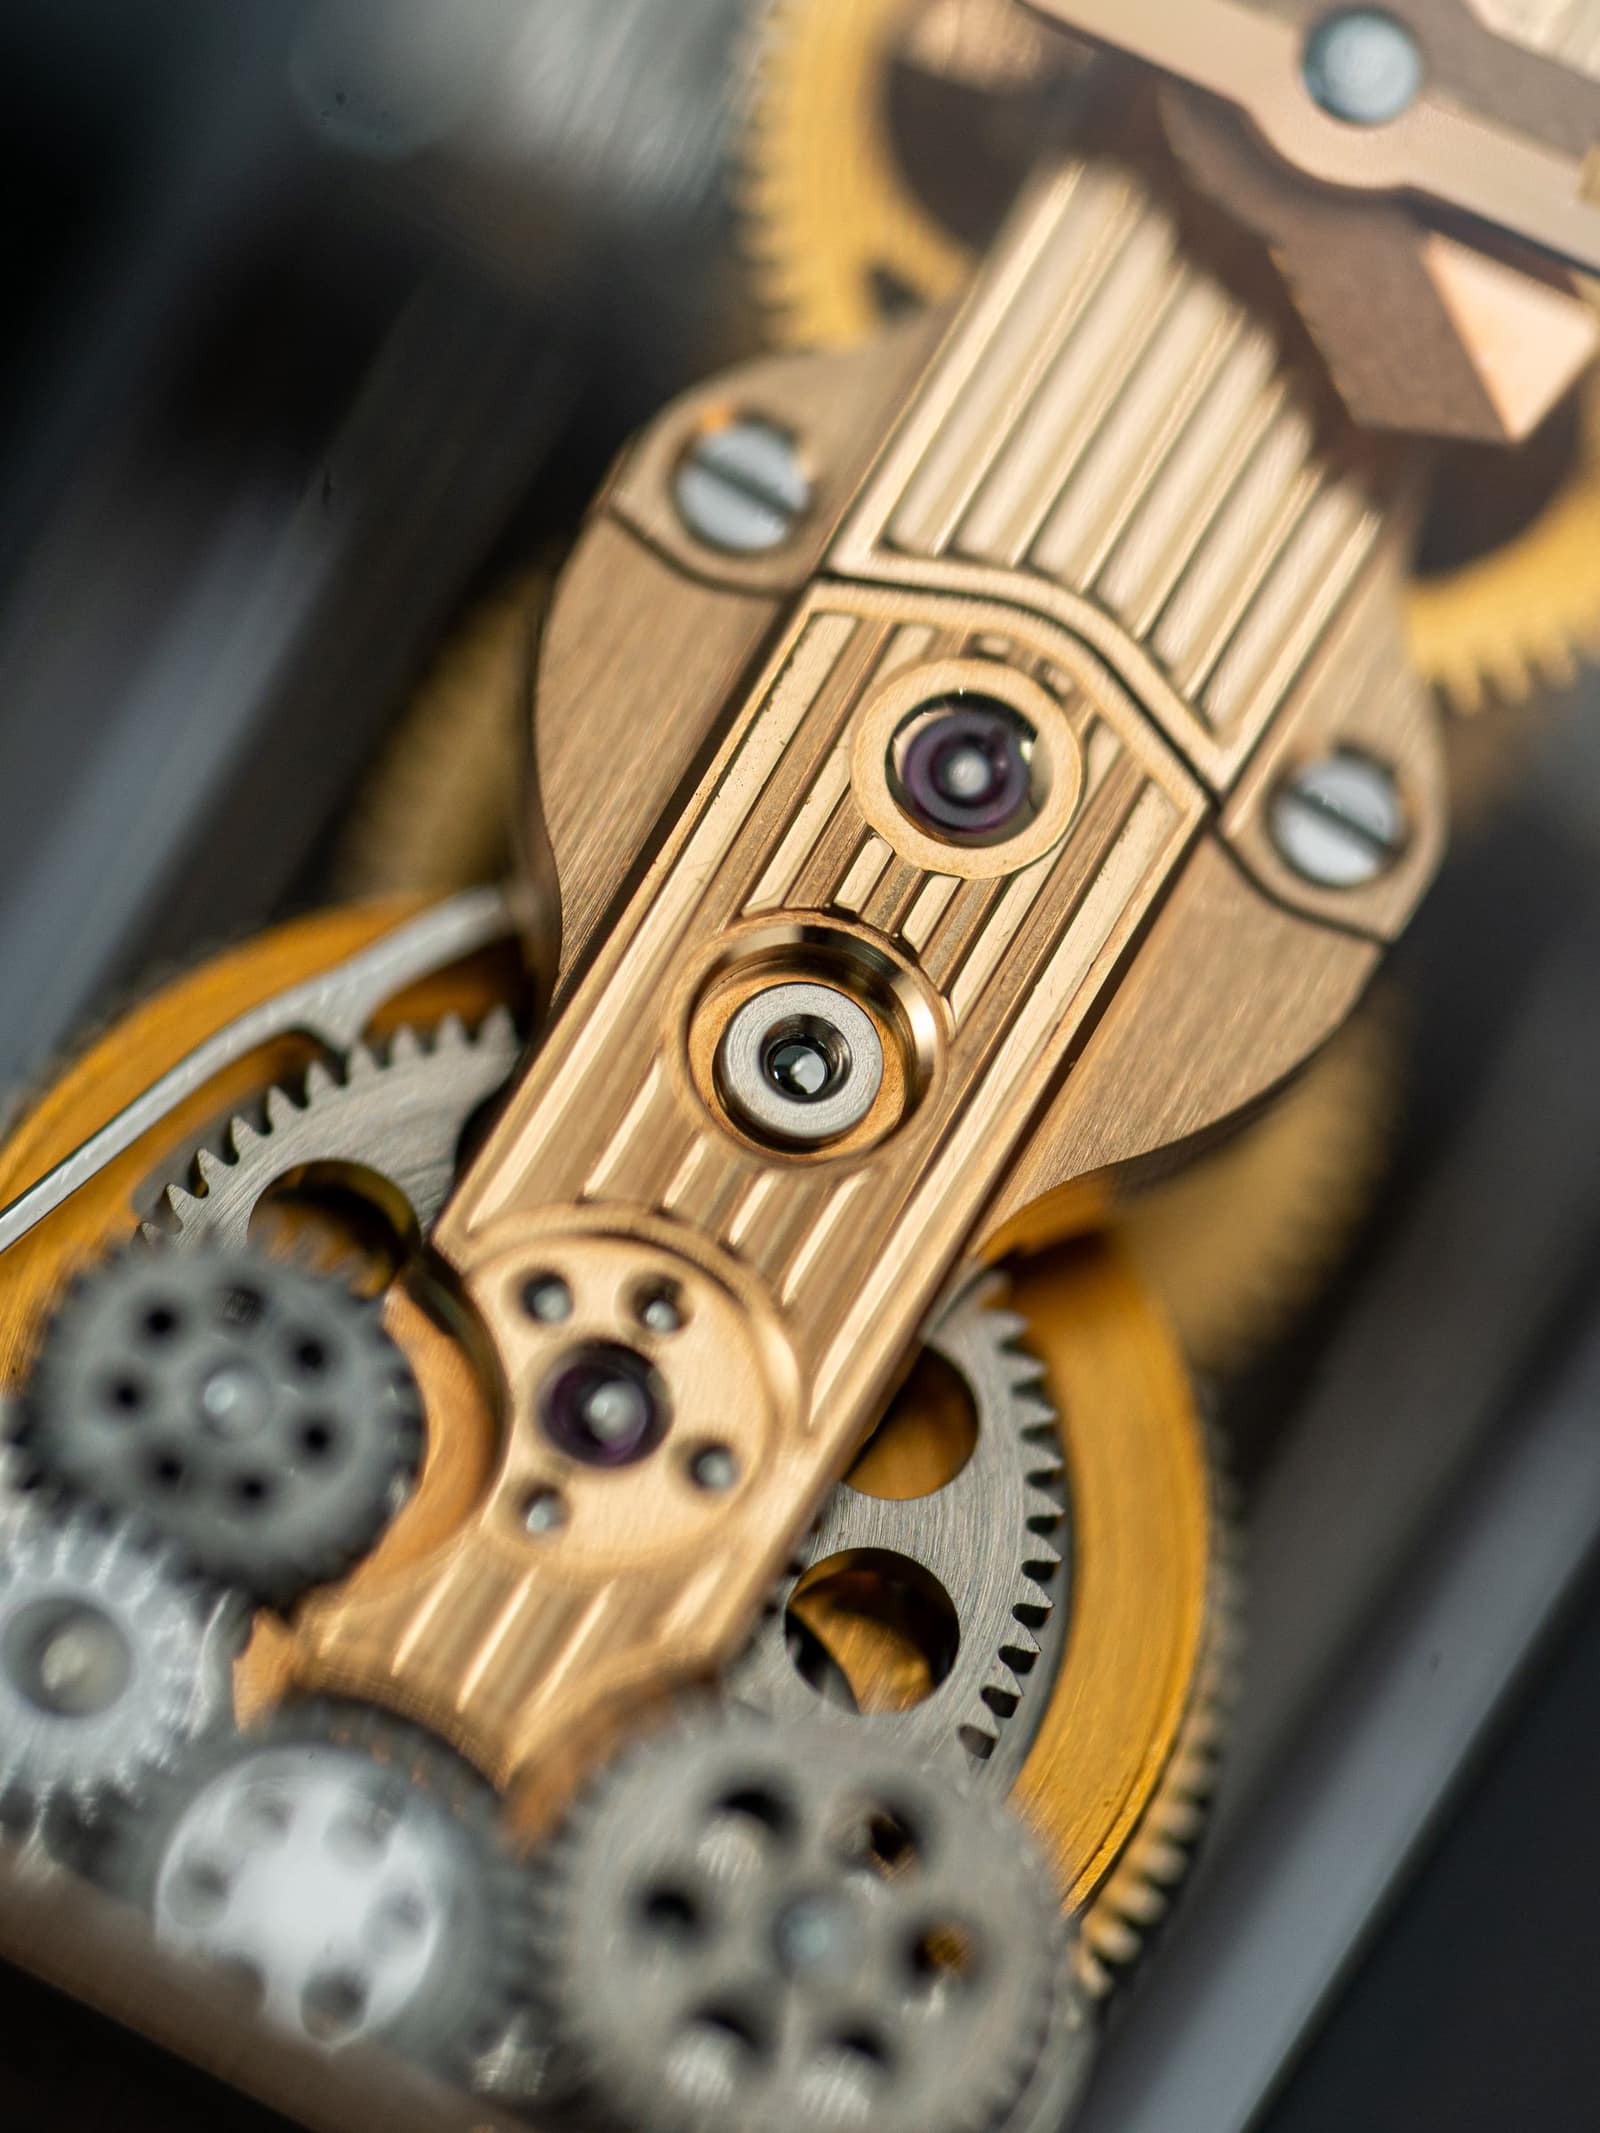 Free to importConsumer goodsWatches20% BCD, 10% SWS and 18% IGST. Switzerland and Hong Kong supply most of India's watch imports.Basic duty20%IGST18%India imported 2025-26US$ 613 mn
 Free to importConsumer goodsSpectacles, frames and sunglassesFrames 10% BCD and 5% IGST; sunglasses 20% BCD and 18% IGST; corrective spectacles 10% BCD and 5% IGST.Basic duty10–20%IGST5–18%India imported 2025-26US$ 268 mn
 Free to importConsumer goodsFootwear20% BCD plus 18.5% AIDC, no SWS. IGST 5% up to Rs 2,500 a pair, 18% above. BIS footwear QCOs apply.Basic duty20%IGST5–18%India imported 2025-26US$ 343 mn
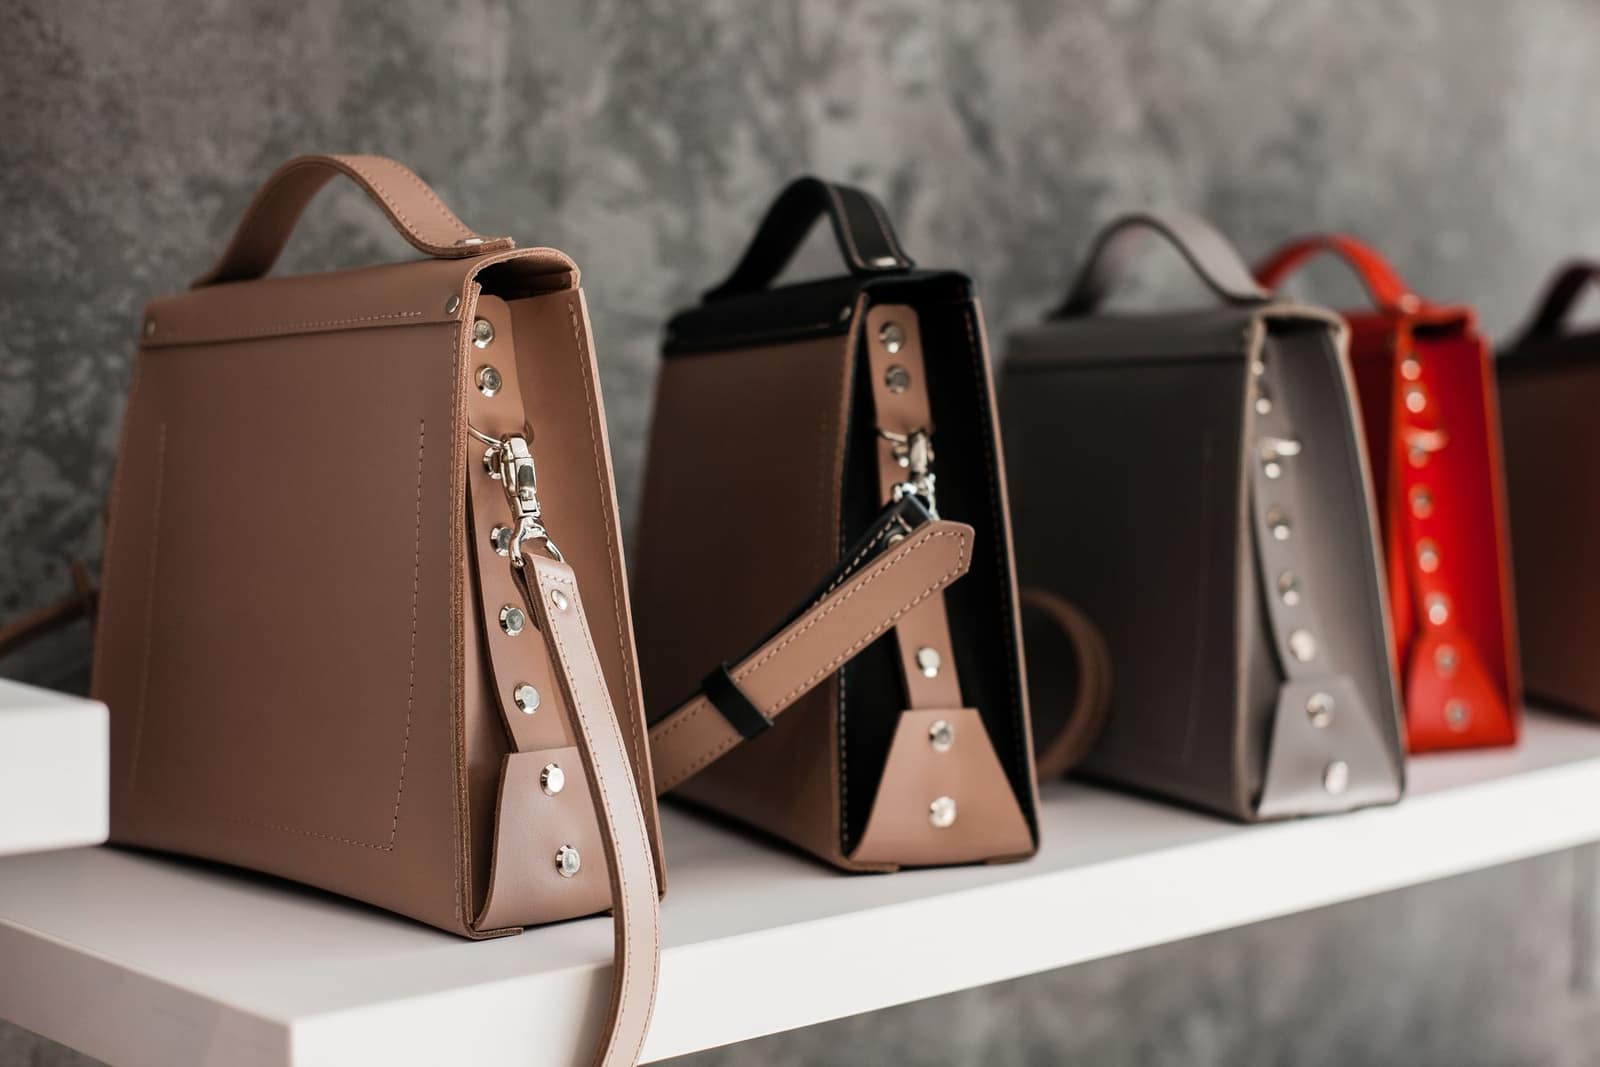 Free to importConsumer goodsHandbags and luggage15% BCD, 10% SWS and 18% IGST (5% for cotton and jute shopping bags and handbags).Basic duty15%IGST5–18%India imported 2025-26US$ 504 mn
 Free to importConsumer goodsPerfumes20% BCD, 10% SWS and 18% IGST. Perfumes are cosmetics, so the importer needs CDSCO import registration.Basic duty20%IGST18%India imported 2025-26US$ 209 mn
 Free to importConsumer goodsArtificial flowers and decor20% BCD, 10% SWS and 18% IGST. Almost all supply comes from China.Basic duty20%IGST18%India imported 2025-26US$ 32.9 mn
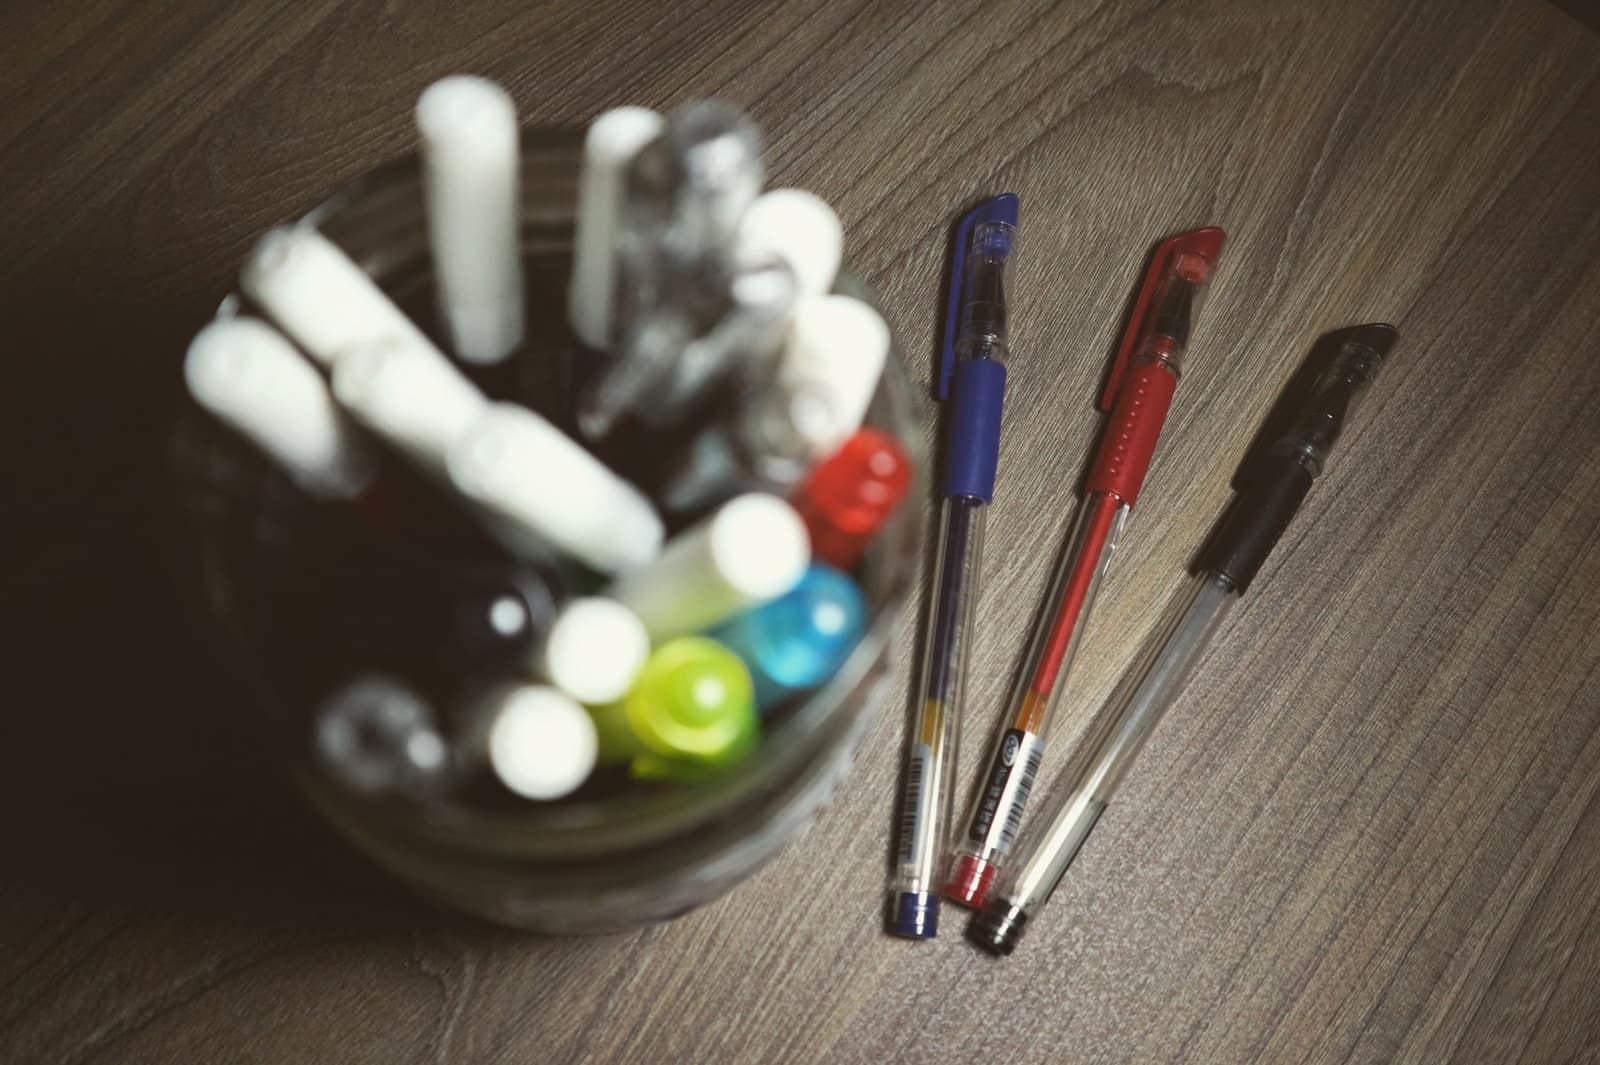 Free to importConsumer goodsPens and stationery10% BCD and 10% SWS. IGST is 18% on pens but nil on pencils, crayons and pastels since September 2025.Basic duty5–10%IGST18%India imported 2025-26US$ 116 mn
 Free to importConsumer goodsCeramic and vitrified tiles15% BCD, 10% SWS and 18% IGST. Anti-dumping duty applies to Chinese vitrified tiles; a BIS QCO on tiles has been notified.Basic duty15%IGST18%India imported 2025-26US$ 32.4 mn
 Free to importConsumer goodsGlassware20% BCD, 10% SWS and 18% IGST. Anti-dumping duty applies to opal glassware from China and the UAE.Basic duty20%IGST18%India imported 2025-26US$ 134 mn
Where India buys from
US$ 775.7 bn of imports, from across the world
Imports in 2025-26. The thicker the route, the more India buys there. Tap a country.
Official figures
How much India imports of each
India’s imports in 2025-26 (TradeStat, Department of Commerce). Change is against 2024-25.
Read first
Import guides
- 01How importing into India worksFrom IEC to “out of charge”: the steps every importer goes through, and who does what.7 min →
- 02Customs duty: what you pay and how to work it outBasic customs duty, Social Welfare Surcharge, IGST and cess — how they stack, how to read the tariff, and a worked example.8 min →
- 03Is your product free to import? ITC(HS) Schedule 1Every import falls into one of four policy classes. Check yours before you sign a purchase order.5 min →
- 04BIS, FSSAI, quarantine, labelling and EPR: the checks after the dutyPaying duty is not enough. Many goods must also meet Indian standards, food law, plant health rules, label rules and waste rules.8 min →
- 05Importing from China: a practical checklistHow to check a supplier, inspect goods, pay safely, and avoid surprise anti-dumping duty and BIS holds.7 min →
- 06Importing duty-free or at lower duty: AA, EPCG, SEZ and FTAsThe legal ways to import without duty, or at a preferential rate — and the CAROTAR rules you must follow when you claim an FTA rate.7 min →
- 07Paying for imports: RBI rules from 1 October 2026RBI’s new Export and Import Regulations, 2026 replace the old Master Direction approach. Here is what changes for an importer.6 min →
Work out the landed cost
Invoice value, freight and the duty rates for your HS code — see what the goods cost at your door.
Papers
Documents for importing
- ShippingBothCommercial invoiceThe final bill you raise on the overseas buyer. Customs in India and in the buyer's country both read it.
- The dealBothProforma invoiceA priced offer that looks like an invoice. The buyer uses it to approve the deal, open an LC or send an advance.
- ShippingBothPacking listA package-by-package list of what is inside the shipment, with weights and sizes.
- ShippingBothBill of lading (BL)The sea-freight receipt and contract of carriage. An original ‘to order’ BL is also the title to the goods.
- ShippingBothAir waybill (AWB)The air-freight receipt and contract of carriage. Unlike a sea BL, it is not a title document.
- ShippingBothMarine insurance certificateProof that the goods are insured for transit. Under CIF and CIP the seller must provide it.
- The dealBothLetter of credit (LC)A bank's promise to pay you if you present documents that match its terms exactly, on time.
- ShippingImportBill of entryThe import declaration to Indian Customs. Duty is assessed and paid on it before goods are released.
- The dealBothPurchase order (PO)The buyer's written order. Once you accept it, it becomes the contract.
- Setting upBothIEC certificate (Importer-Exporter Code)Your 10-character business ID for foreign trade. Customs and banks will not process an export or import without it, except for listed exemptions.