

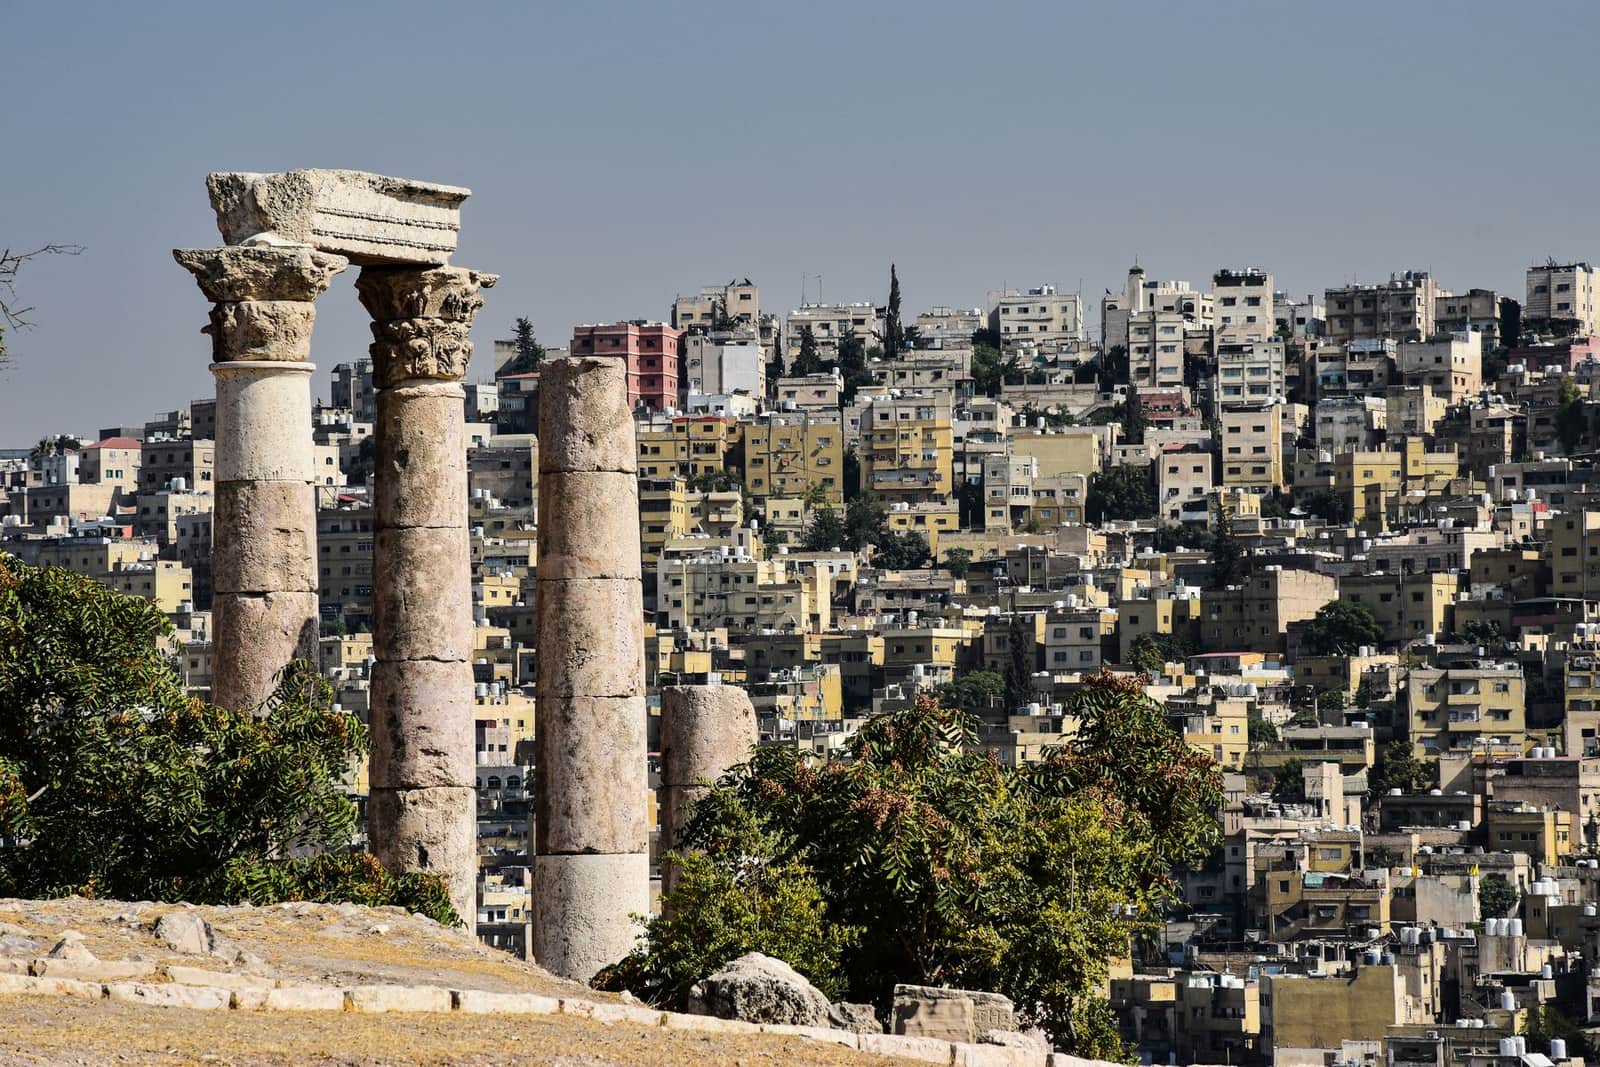
Gulf & Middle East
Export to Jordan
Small, stable market reached through Aqaba. Buys Indian rice, meat, sugar, chemicals and machinery.
- Capital
- Amman
- Currency
- JOD
- Trade agreement with India
- None
- Main ports
- Aqaba, Queen Alia International Airport (Amman)
Jordan is one of India’s main sources of phosphate and potash fertiliser, and it buys Indian rice, buffalo meat, sugar, chemicals, machinery and garments. All sea cargo arrives at Aqaba on the Red Sea. Rules follow Jordanian standards, and food and medicines go through the Jordan Food and Drug Administration.
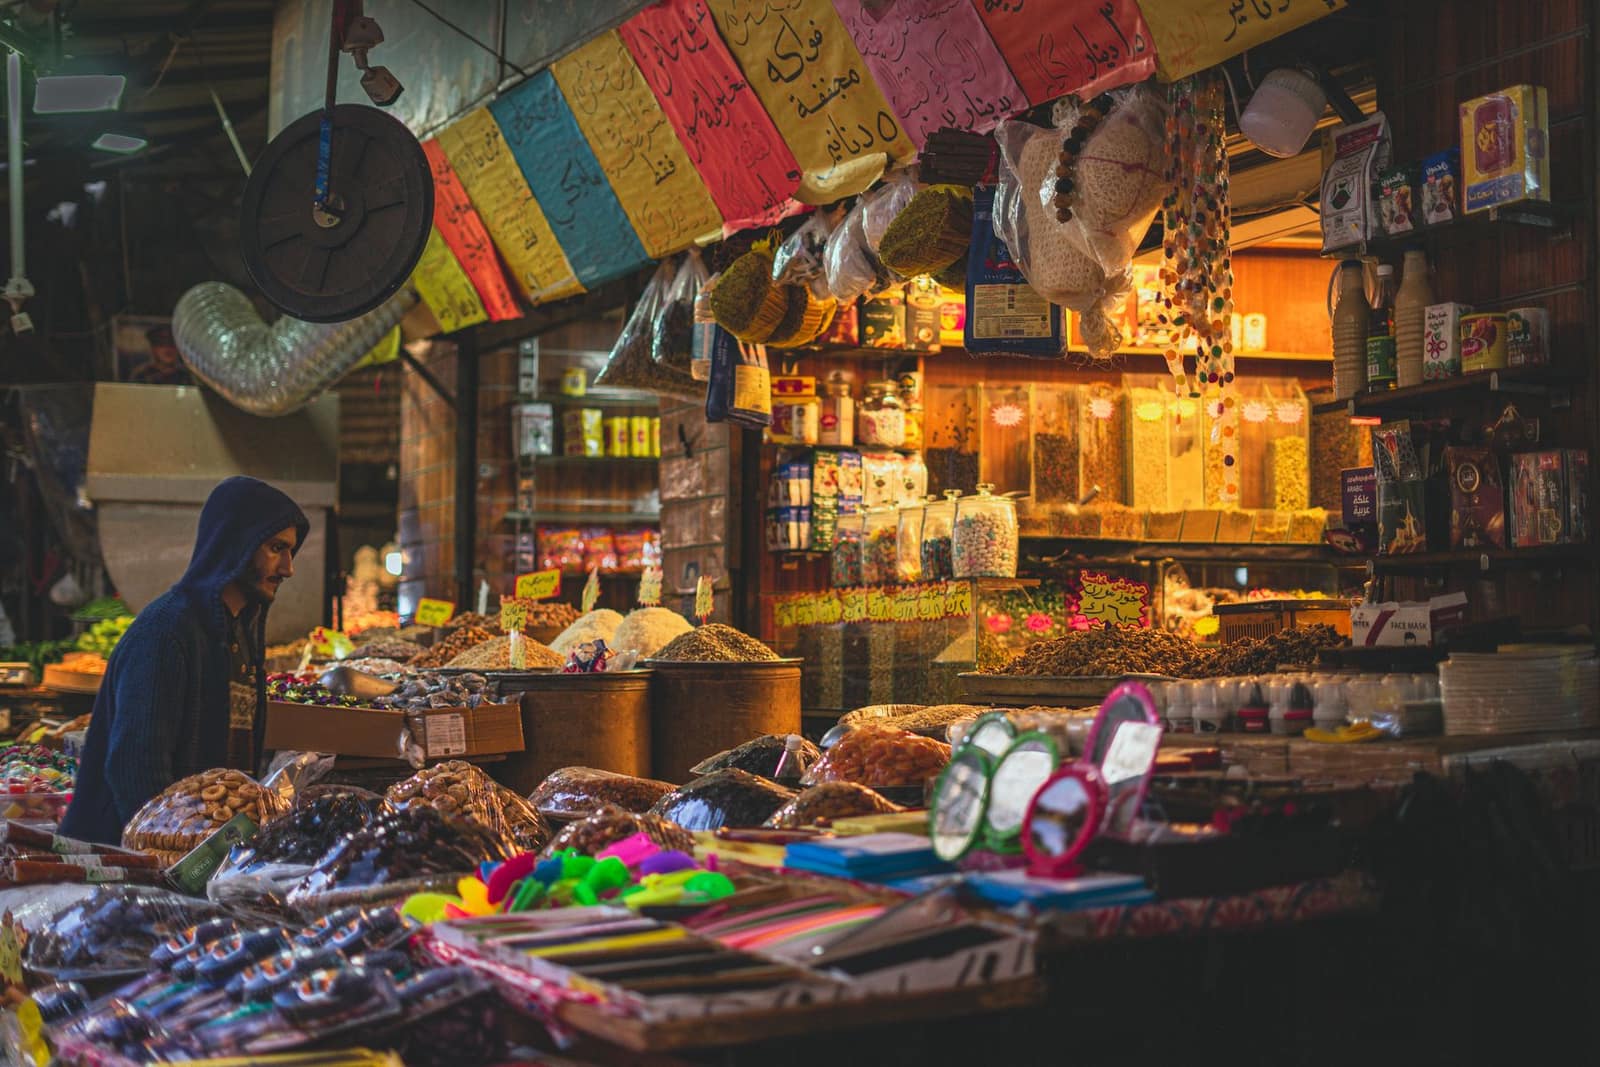
What it buys from India
- Rice, buffalo meat, sugar and spices
- Organic chemicals and medicines
- Machinery, vehicles and garments
Import rules on their side
- Food, medicines and cosmetics need clearance from the Jordan Food and Drug Administration (JFDA); meat needs a halal certificate from an accepted body.
- Industrial goods covered by Jordanian technical regulations are checked by the Jordan Standards and Metrology Organization (JSMO).
- Labels need Arabic (Arabic and English is common), with production and expiry dates.
Practical tips
- There is no trade agreement, so the buyer pays the normal (most-favoured-nation) duty. Ask the buyer or a local customs broker for the duty on your exact HS code before you quote a landed price.
- Jordanian importers often supply Iraq and neighbouring markets too; ask where the goods will finally be sold.
- Use an advance or LC for first orders; ECGC cover helps if you move to credit terms.
Sources (6)
Trade data
India’s exports to Jordan in numbers
From the Department of Commerce’s TradeStat (Indian financial years, April–March), the country’s imports from the world from UN Comtrade, and its basics from the World Bank.
- India’s exports here, 2025-26
- US$ 1.17 bn No. 52 of our 80 countries
- Change from 2024-25
- ↑ +54.3% US$ 755 mn → US$ 1.17 bn
- Share of all Indian exports
- 0.26%
- Its imports from the world
- —
What India sells here most
By HS chapter, 2025-26. Change is against 2024-25.
What is rising and what is falling
Chapters where India sells at least US$ 5 million. Change from 2024-25 to 2025-26.
↑ High demand
- Fuels and petroleum productsUS$ 2.1 mn → US$ 342 mn↑+16,563.4%
- Salt, stone, cementUS$ 1.9 mn → US$ 30.1 mn↑+1,526.5%
- Vehicles and partsUS$ 5 mn → US$ 15.2 mn↑+204.8%
- Gems, jewellery, precious metalsUS$ 2.9 mn → US$ 6.3 mn↑+120.1%
- Ceramics and tilesUS$ 9.7 mn → US$ 16.9 mn↑+73.6%
- Coffee, tea, spicesUS$ 49.4 mn → US$ 84.9 mn↑+72%
- AluminiumUS$ 4.6 mn → US$ 6.8 mn↑+47.9%
- Other food preparationsUS$ 8.5 mn → US$ 12.4 mn↑+46.5%
↓ Low demand
- TobaccoUS$ 29.6 mn → US$ 9.5 mn↓-67.9%
- CottonUS$ 23.9 mn → US$ 19.7 mn↓-17.5%
- Iron and steel articlesUS$ 9.9 mn → US$ 8.4 mn↓-15.1%
- Man-made staple fibresUS$ 9.6 mn → US$ 8.5 mn↓-11.2%
- RubberUS$ 7.4 mn → US$ 6.6 mn↓-10.7%
Our product guides that sell here
India’s exports of each product to this country, 2025-26.
The 20 biggest export lines
4-digit HS lines, 2025-26, with their Harmonized System descriptions.
What India buys from Jordan
India’s imports from this country in 2025-26 by HS chapter, from TradeStat — this country can be your supplier too.
- India’s imports, 2025-26
- US$ 1.88 bn US$ 1.91 bn → US$ 1.88 bn
- India’s exports, 2025-26
- US$ 1.17 bn
- Trade balance
- −US$ 712 mn exports minus imports
- Change in imports
- -1.8%
The country at a glance
- Population
- 11.5 mn 2025
- GDP
- US$ 61.6 bn 2025
- GDP per person
- US$ 5,348 2025
- Imports (goods and services)
- US$ 15.7 bn 2007
Sources: TradeStat — Export Import Data Bank, Department of Commerce · World Bank — World Development Indicators · Figures taken 29 October 2026.
What to send to Jordan
All products →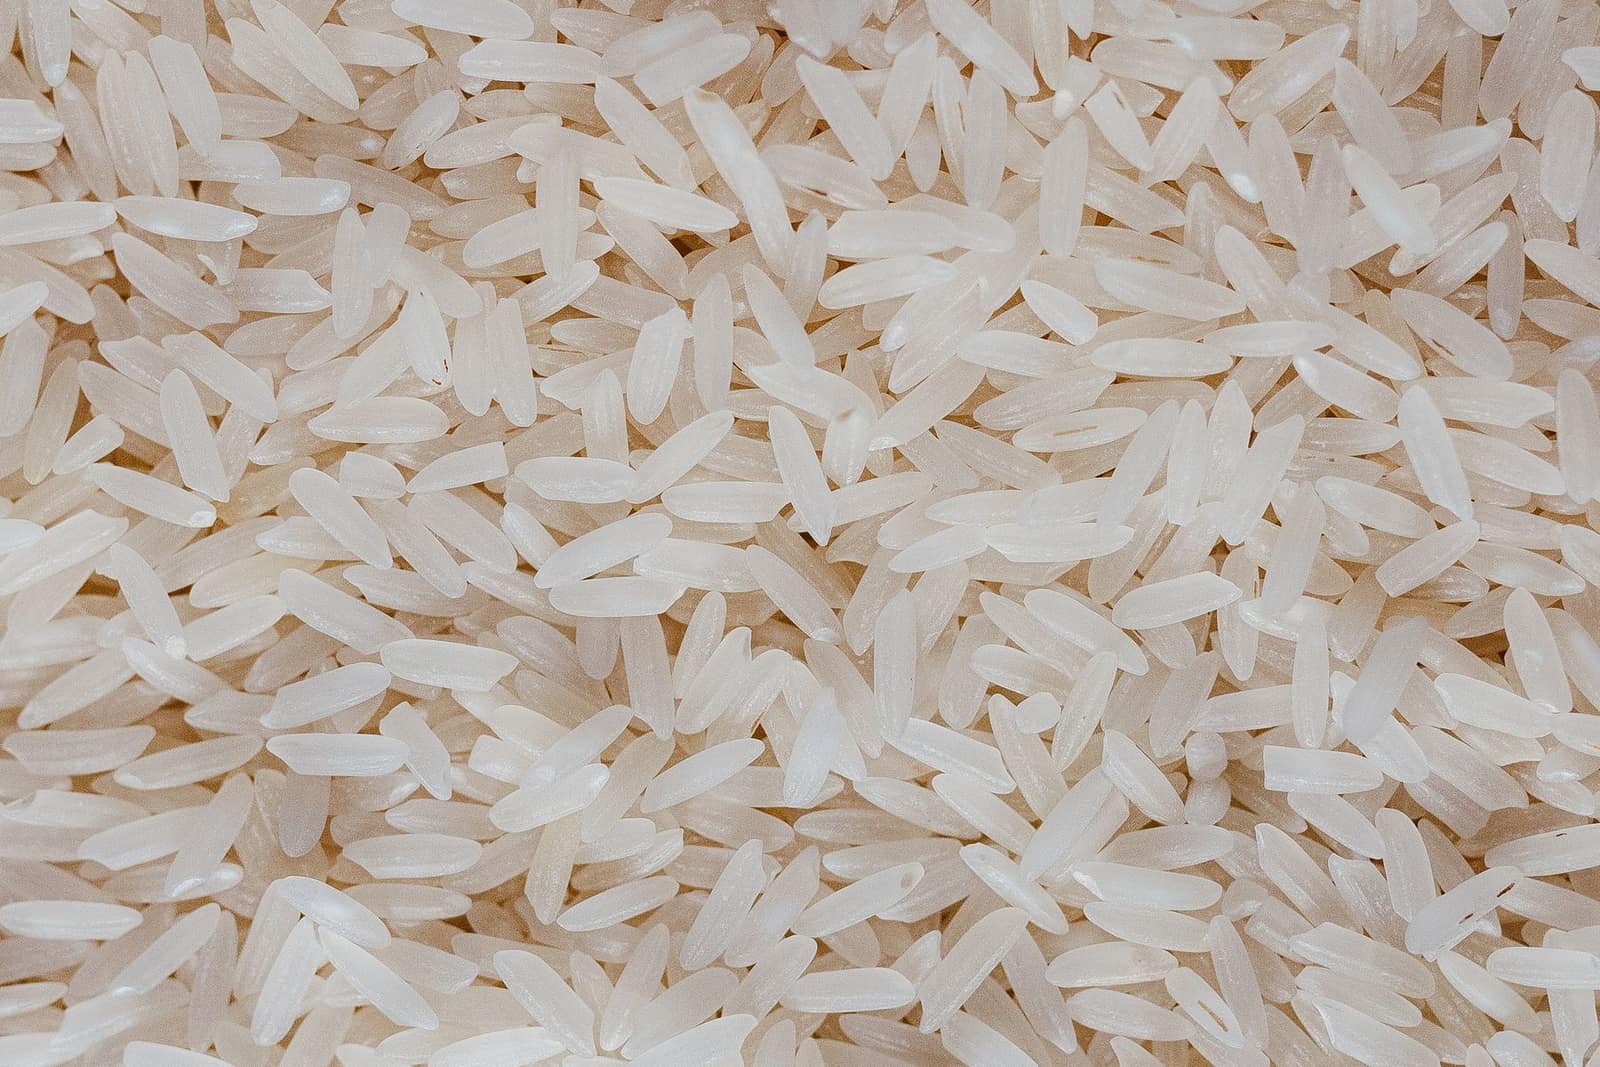 Free, with conditionsFarm produceBasmati riceIndia’s top agri export by value. Free to export, but every contract must be registered with APEDA first.HS1006.30Exports 2025-26US$ 5.67 bn ↓4.6%
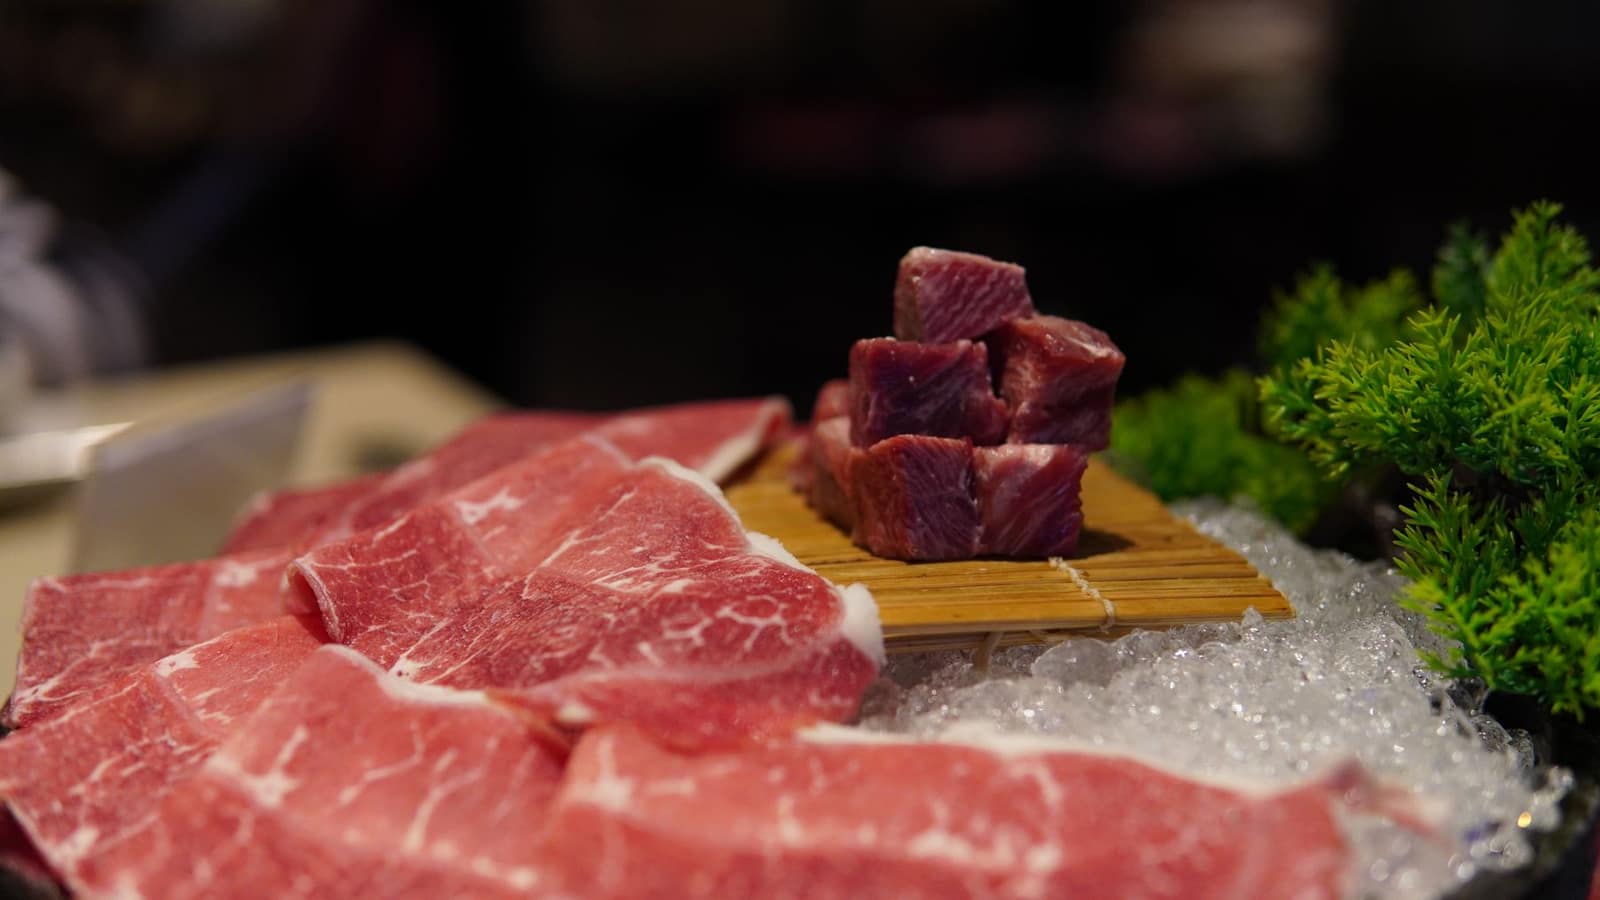 Free, with conditionsProcessed foodBuffalo meat (frozen)India is the world’s largest buffalo meat exporter. Only APEDA-registered plants, halal under i-CAS, and strict veterinary rules.HS0202Exports 2025-26US$ 4.61 bn ↑25.7%
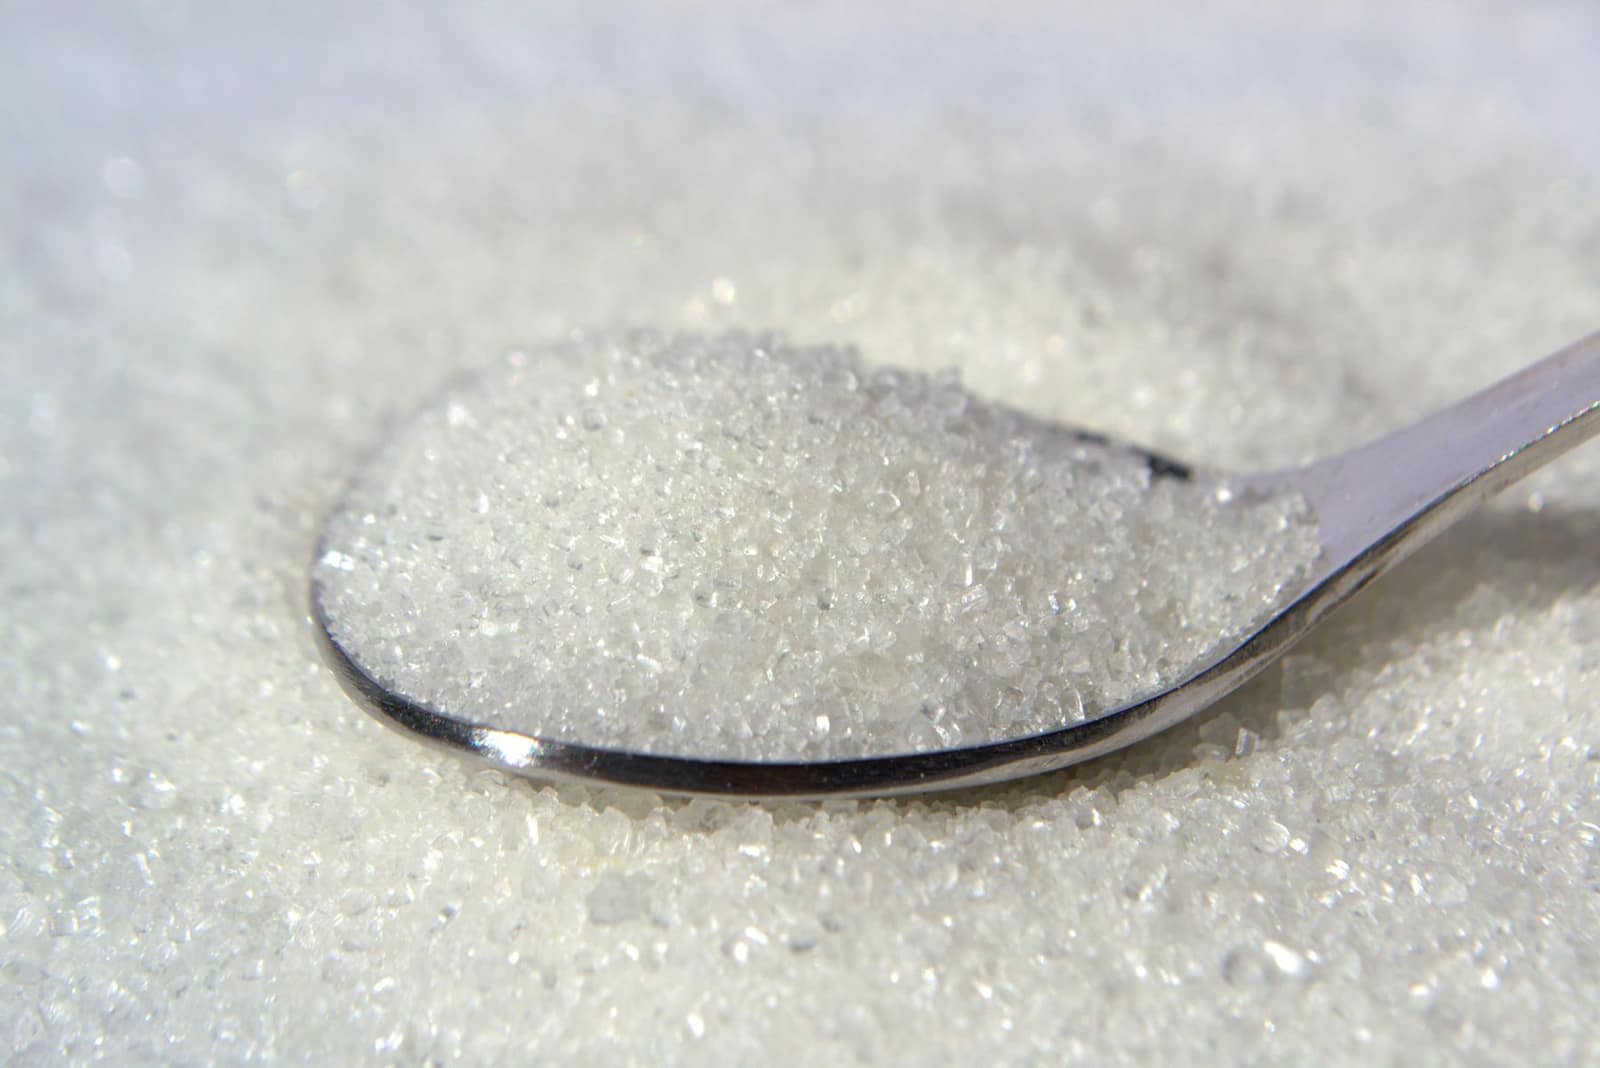 Restricted — licence neededProcessed foodSugarRestricted: exported only under quotas the Food Ministry gives to sugar mills each season. Organic sugar has a separate 50,000 MT yearly ceiling.HS1701Exports 2025-26US$ 2.04 bn ↓3.5%
 Free to exportFarm produceSpicesWhole, ground and blended spices. Spices Board registration (CRES) is compulsory; residue and ethylene oxide tests keep buyers.HS0904–0910Exports 2025-26US$ 3.12 bn ↓5.1%
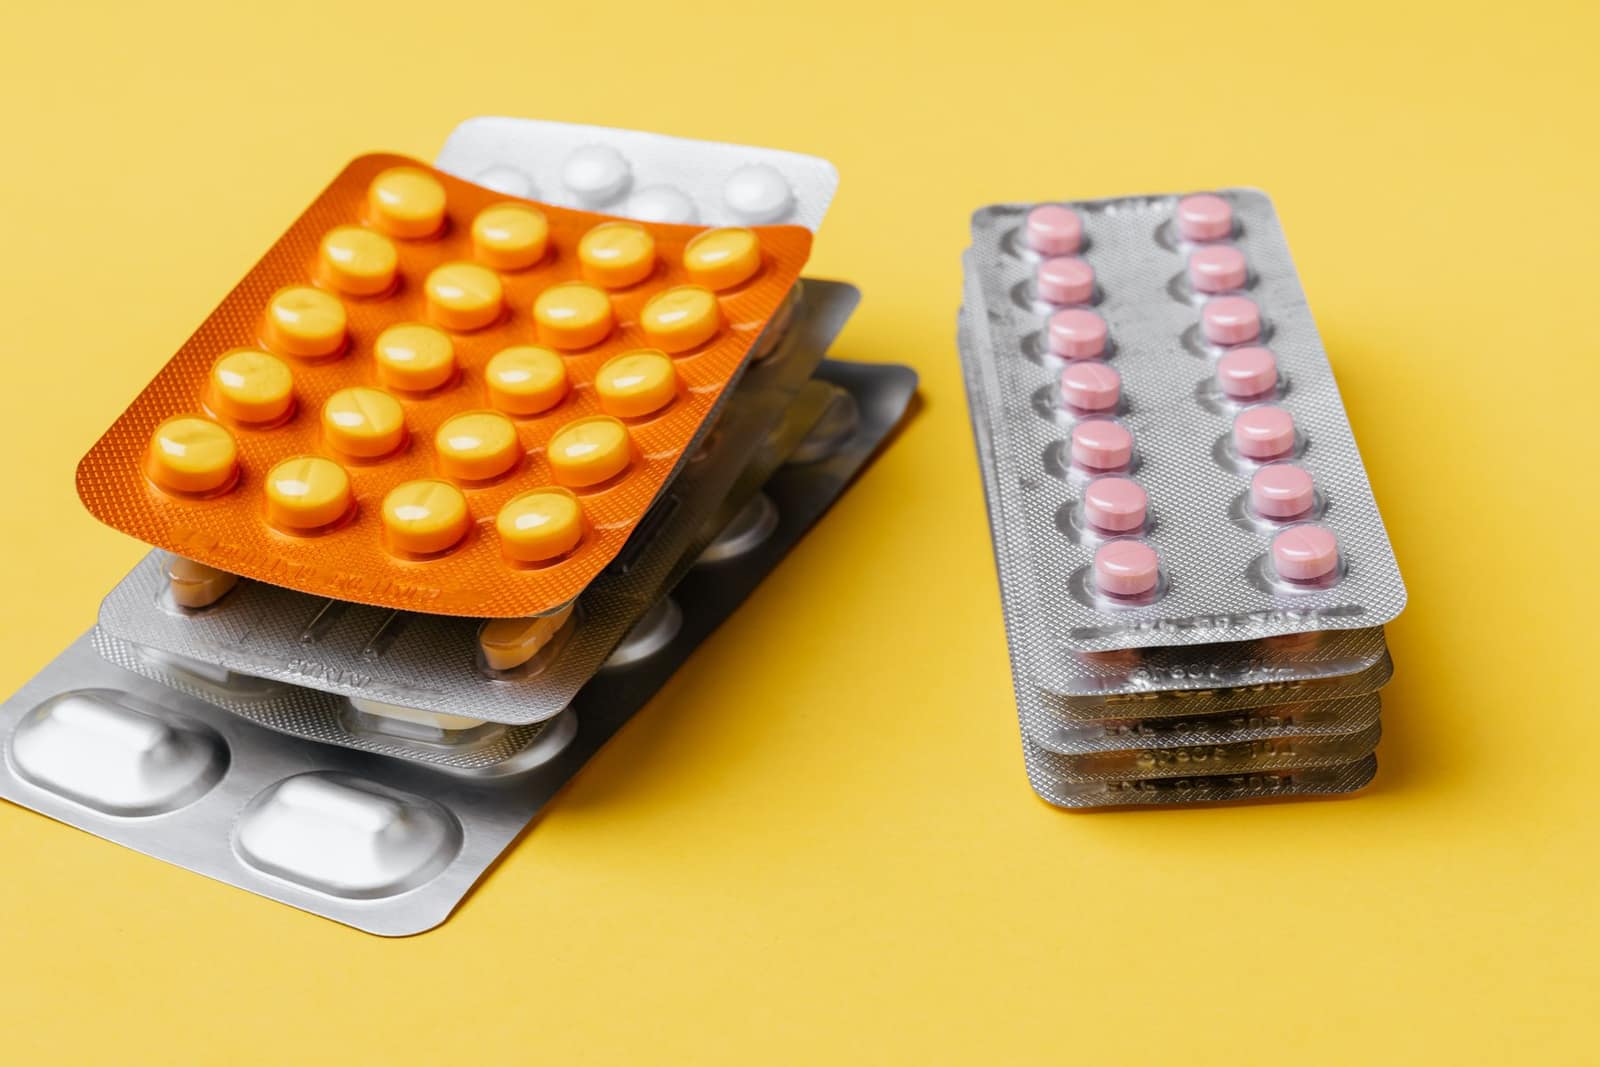 Free to exportPharma & chemicalsGeneric medicines (formulations)Tablets, capsules and injectables; every market needs product registration. The USA buys the most.HS3004Exports 2025-26US$ 21.9 bn ↓0.7%
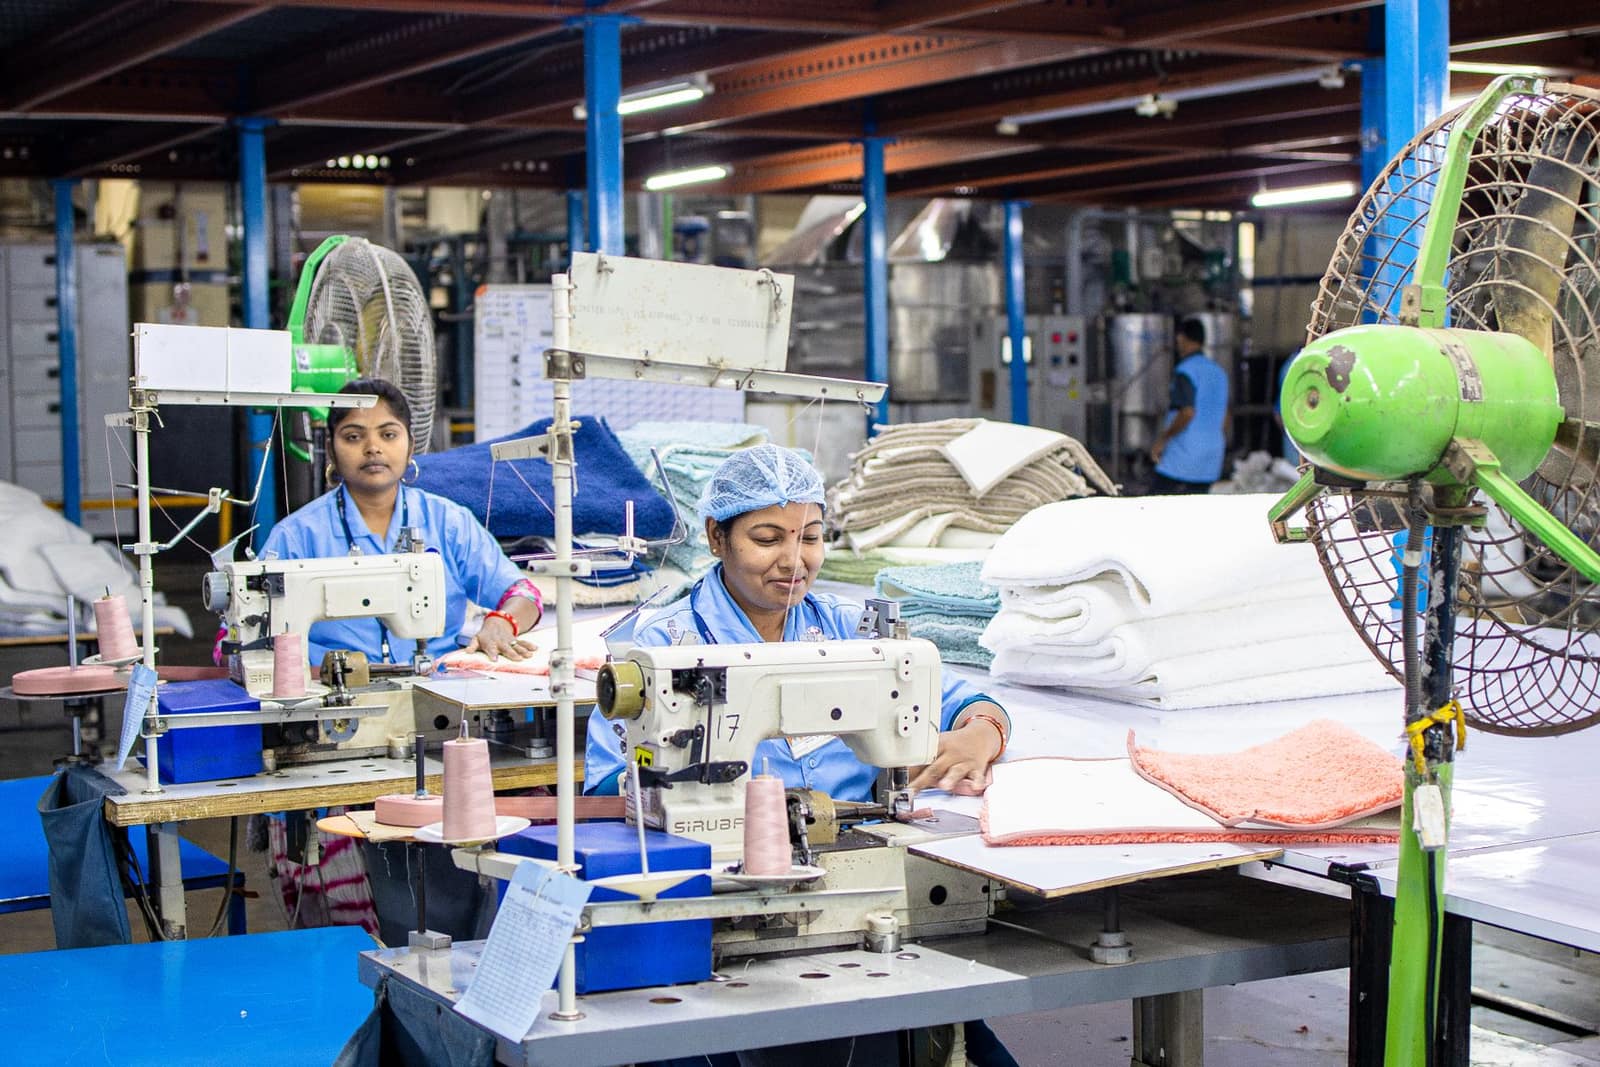 Free to exportTextiles & apparelReadymade garmentsKnitted and woven clothing for brands and retailers; the USA, UK, UAE and the EU are the big buyers.HS6109.10Exports 2025-26US$ 15.8 bn ↓1.2%
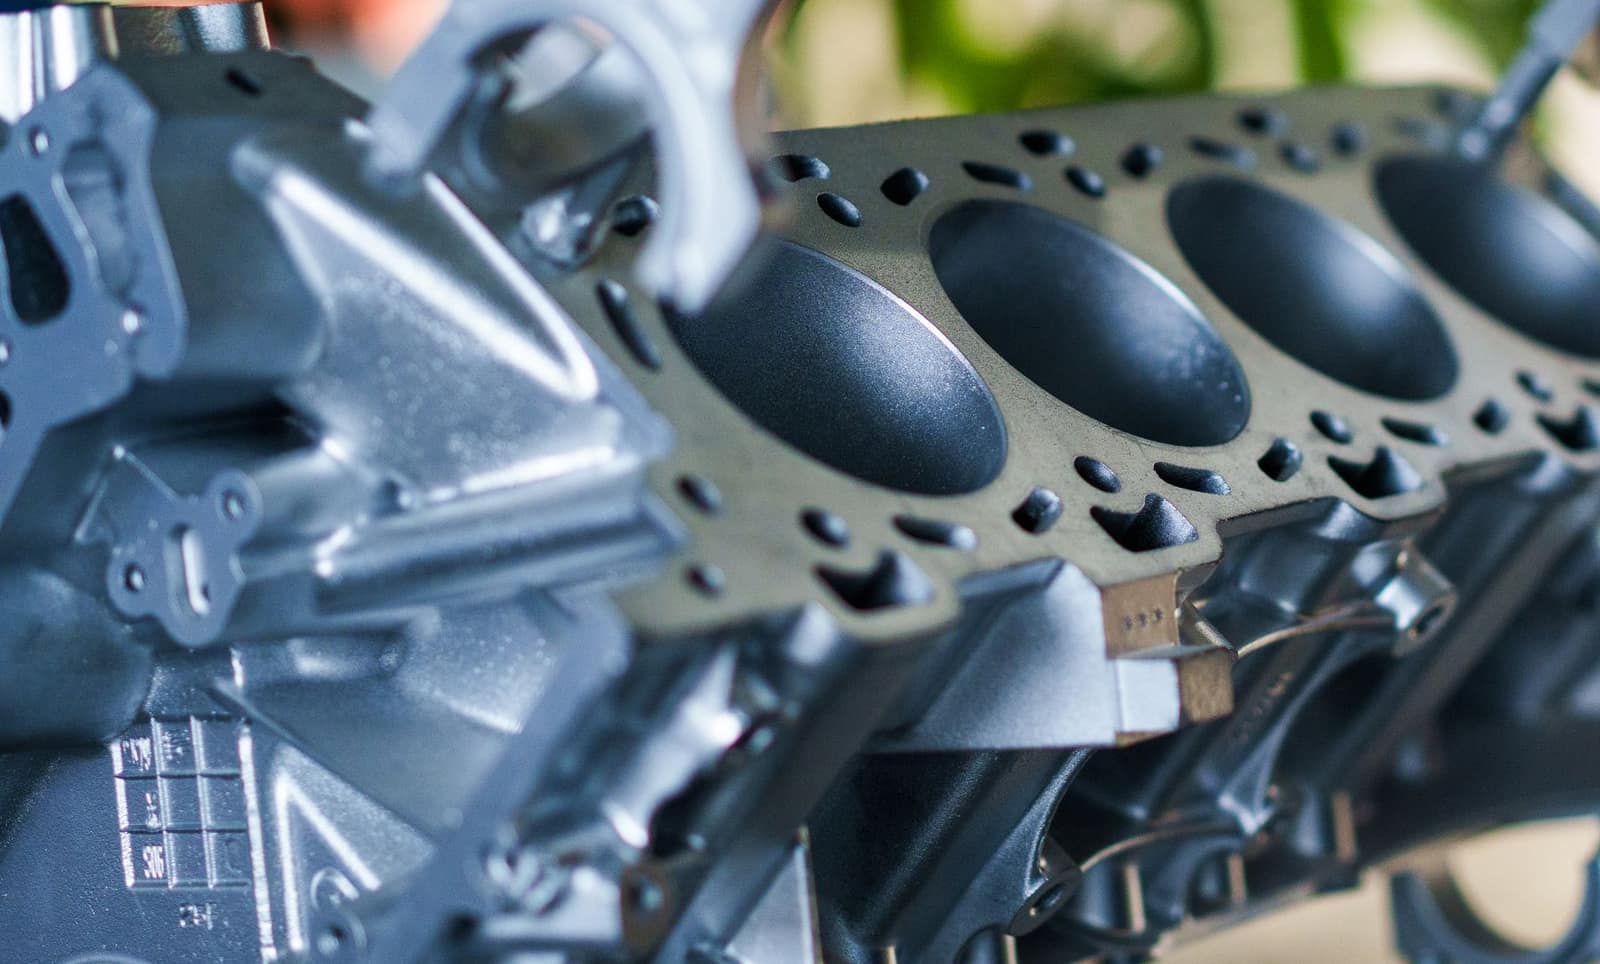 Free to exportEngineering goodsAuto parts and componentsOEM and aftermarket vehicle parts; the USA, Germany and Italy buy most, with strong demand in Latin America.HS8708Exports 2025-26US$ 7.64 bn ↑1.8%
More in Gulf & Middle East
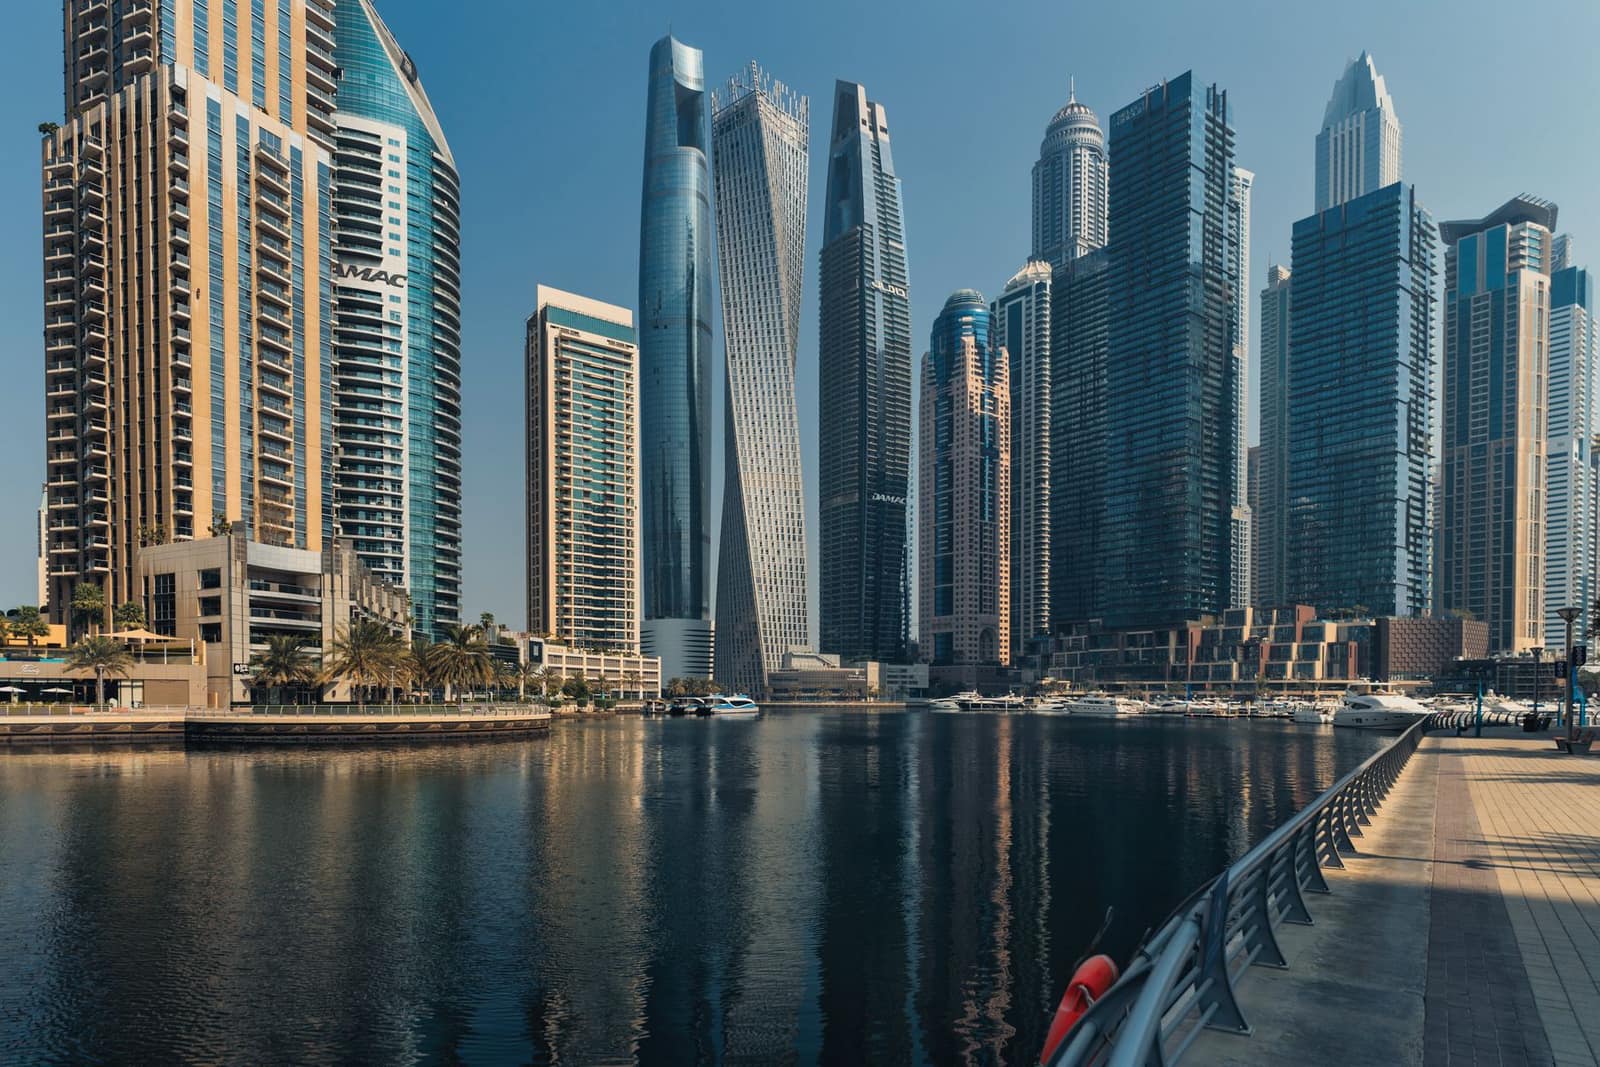 CEPAAEDAbu DhabiUnited Arab EmiratesIndia's biggest Gulf buyer and a re-export hub for the Middle East and Africa. CEPA in force since 2022.From India 2025-26US$ 37.4 bn
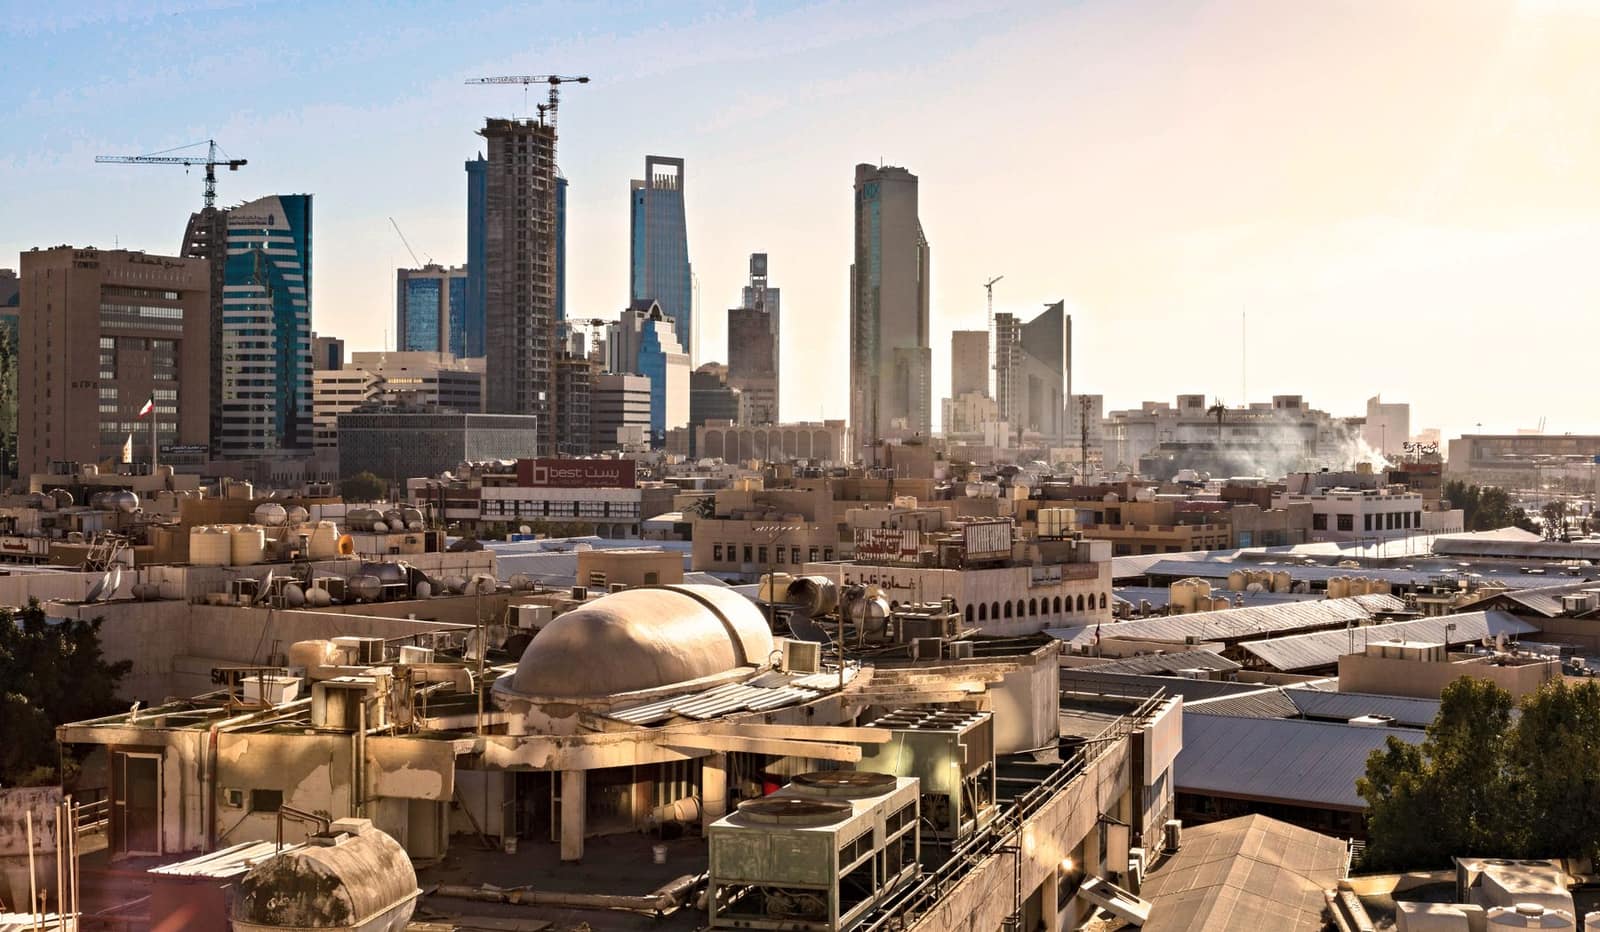 SARRiyadhSaudi ArabiaLarge Gulf market for rice, food and engineering goods. Strict SFDA food rules and SABER certification for regulated goods.From India 2025-26US$ 10.3 bn
 CEPAOMRMuscatOmanNew CEPA in force since June 2026 — almost all Indian goods now enter duty-free. Short sea route from Gujarat.From India 2025-26US$ 4.02 bn
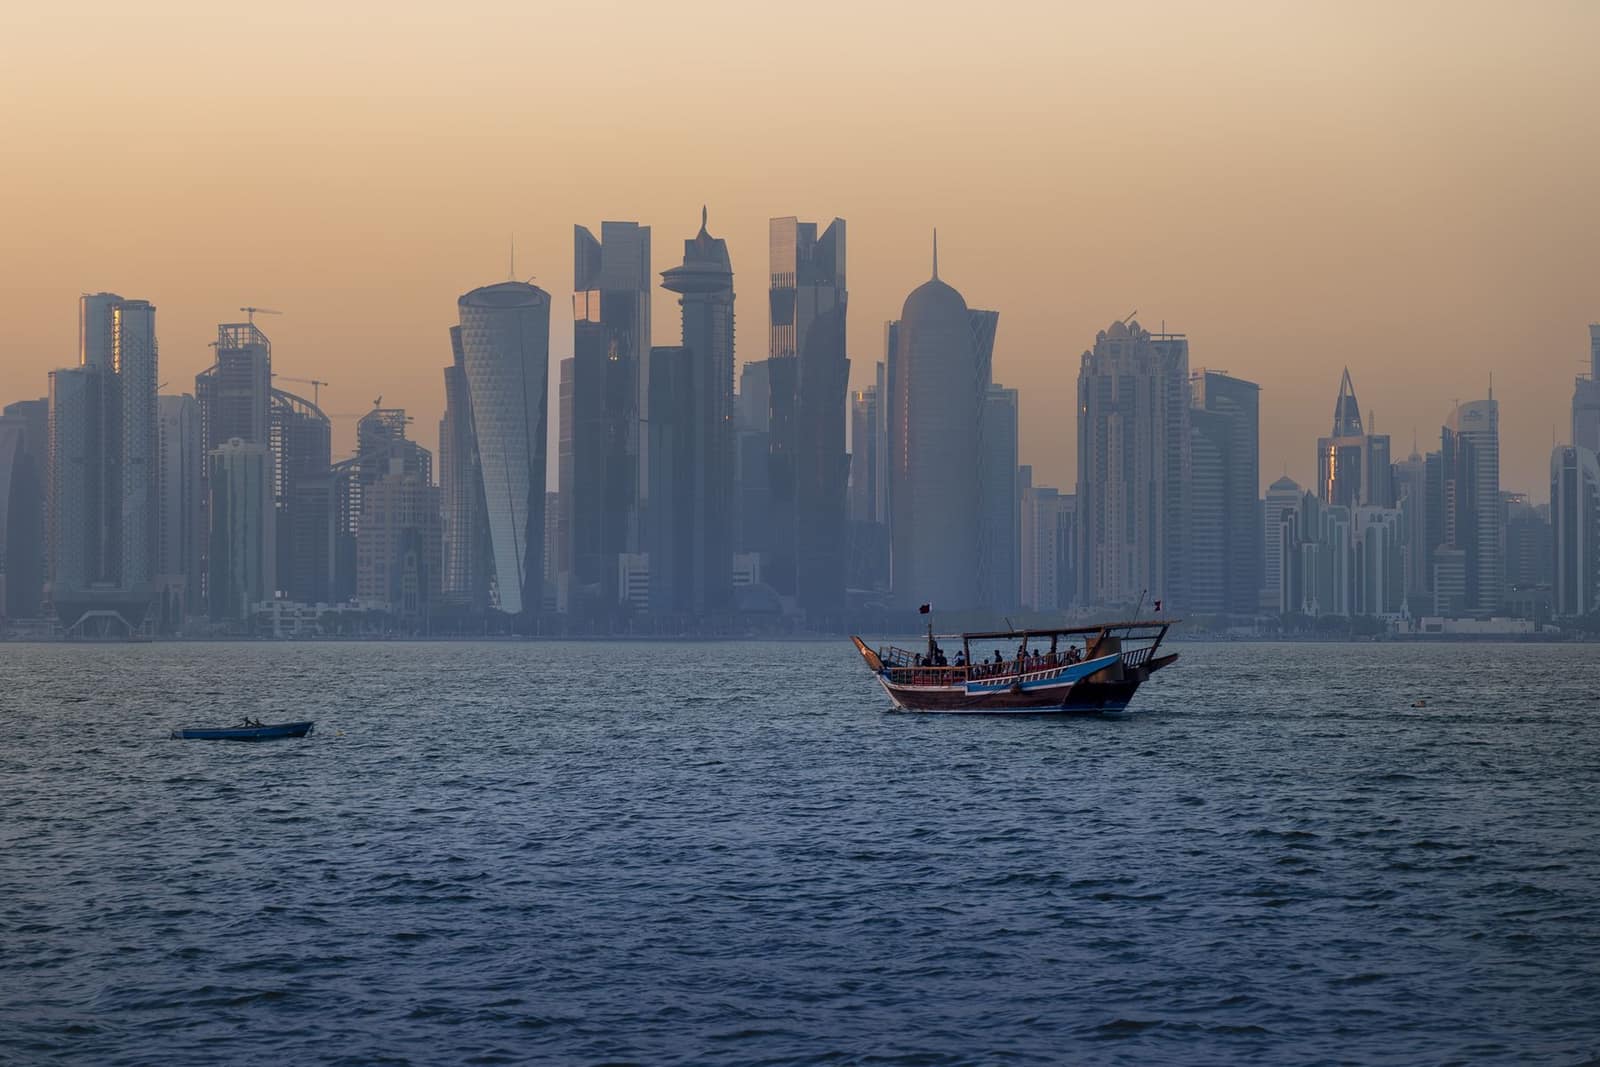 QARDohaQatarSmall, wealthy Gulf market with a huge Indian workforce. Imports nearly all its food.From India 2025-26US$ 1.62 bn