


Gulf & Middle East
Export to Saudi Arabia
Large Gulf market for rice, food and engineering goods. Strict SFDA food rules and SABER certification for regulated goods.
- Capital
- Riyadh
- Currency
- SAR
- Trade agreement with India
- India–GCC Free Trade Agreement (under negotiation) Not in force yetNot in force
- Main ports
- Jeddah Islamic Port, King Abdulaziz Port, Dammam, Riyadh Dry Port
Saudi Arabia is one of the biggest buyers of Indian basmati rice and also buys meat, spices, vegetables, textiles, machinery and chemicals. It is a rule-heavy market: food goes through the Saudi Food and Drug Authority (SFDA) and many non-food goods need certificates on the SABER platform before they ship. Get these right and the market is steady and large.

There is no India–Saudi trade agreement in force. India and the six-nation Gulf Cooperation Council (which includes Saudi Arabia) signed terms of reference in February 2026 and launched FTA negotiations; until a deal is signed and in force, normal GCC customs duties apply. Confirm current status on commerce.gov.in.
What it buys from India
- Basmati rice and other cereals
- Meat, spices, fruit, vegetables and processed food
- Machinery, vehicles and auto parts, steel products
- Chemicals, textiles, garments and ceramic tiles
Import rules on their side
- Food importers and food products are controlled by the SFDA. Labels must be in Arabic (Arabic and English is common) and follow GCC/Saudi labelling standards, including shelf life.
- Meat and poultry need a halal certificate from a body accepted by Saudi authorities; meat plants must be approved for export to Saudi Arabia.
- Regulated non-food products (for example electrical goods, building materials, toys, auto parts) need a Product Certificate and a Shipment Certificate issued through the SABER platform before customs clearance.
Practical tips
- Ask the buyer to start the SABER request early — your shipment cannot clear without the Shipment Certificate.
- LCs are common for larger orders. Have commercial invoices and certificates of origin attested if the buyer or bank asks for it.
- Business slows in Ramadan; demand for rice, dates and food peaks before it. Plan shipments a few weeks ahead.
Sources (7)
- PIB backgrounder — India's Trade Partnerships (27 Feb 2026)
- All India Radio News — India and GCC sign Joint Statement on FTA (24 Feb 2026)
- Saudi Food and Drug Authority (SFDA) — regulations
- SABER — Saudi product conformity platform (SASO)
- Zakat, Tax and Customs Authority (ZATCA), Saudi Arabia
- GCC Standardization Organization (GSO)
- Department of Commerce — TradeStat export-import data bank
Trade data
India’s exports to Saudi Arabia in numbers
From the Department of Commerce’s TradeStat (Indian financial years, April–March), the country’s imports from the world from UN Comtrade, and its basics from the World Bank.
- India’s exports here, 2025-26
- US$ 10.3 bn No. 9 of our 30 countries
- Change from 2024-25
- ↓ -12.6% US$ 11.8 bn → US$ 10.3 bn
- Share of all Indian exports
- 2.33%
- Its imports from the world
- US$ 232.8 bn 2024 · India’s share 5.67%
What India sells here most
By HS chapter, 2025-26. Change is against 2024-25.
What is rising and what is falling
Chapters where India sells at least US$ 5 million. Change from 2024-25 to 2025-26.
↑ High demand
- CopperUS$ 532 mn → US$ 983 mn↑+84.8%
- ZincUS$ 76.5 mn → US$ 135 mn↑+76.2%
- Ships and boatsUS$ 66 mn → US$ 114 mn↑+72.9%
- Gems, jewellery, precious metalsUS$ 152 mn → US$ 247 mn↑+62.6%
- Coffee, tea, spicesUS$ 169 mn → US$ 239 mn↑+41%
- AluminiumUS$ 107 mn → US$ 132 mn↑+23.5%
- Fruit and vegetable preparationsUS$ 76.5 mn → US$ 87.5 mn↑+14.4%
- MeatUS$ 318 mn → US$ 361 mn↑+13.5%
↓ Low demand
- Fuels and petroleum productsUS$ 495 mn → US$ 223 mn↓-54.9%
- Electrical and electronicsUS$ 729 mn → US$ 502 mn↓-31.1%
- Iron and steelUS$ 109 mn → US$ 76.2 mn↓-30.4%
- Salt, stone, cementUS$ 76.7 mn → US$ 54 mn↓-29.6%
- Dairy, eggs, honeyUS$ 82.3 mn → US$ 62.5 mn↓-24.1%
- Iron and steel articlesUS$ 562 mn → US$ 434 mn↓-22.8%
- Cereals (rice, wheat, maize)US$ 1.33 bn → US$ 1.08 bn↓-19%
- Fruit and nutsUS$ 96.2 mn → US$ 80.7 mn↓-16.1%
Opportunity: what this country buys from the world, and from India
The country’s own recorded imports in UN Comtrade, 2024. Chapters with the biggest gap between what it buys from the world and what it buys from India.
Our product guides that sell here
India’s exports of each product to this country, 2025-26.
The 20 biggest export lines
4-digit HS lines, 2025-26, with their Harmonized System descriptions.
What India buys from Saudi Arabia
India’s imports from this country in 2025-26 by HS chapter, from TradeStat — this country can be your supplier too.
- India’s imports, 2025-26
- US$ 30.8 bn US$ 30.1 bn → US$ 30.8 bn
- India’s exports, 2025-26
- US$ 10.3 bn
- Trade balance
- −US$ 20.5 bn exports minus imports
- Change in imports
- +2.2%
The country at a glance
- Population
- 37.0 mn 2025
- GDP
- US$ 1,276.9 bn 2025
- GDP per person
- US$ 34,537 2025
- Imports (goods and services)
- US$ 359.8 bn 2025
Sources: TradeStat — Export Import Data Bank, Department of Commerce · UN Comtrade database (United Nations Statistics Division) · World Bank — World Development Indicators · Figures taken 29 October 2026.
What to send to Saudi Arabia
All products → Free, with conditionsFarm produceBasmati riceIndia’s top agri export by value. Free to export, but every contract must be registered with APEDA first.HS1006.30Exports 2025-26US$ 5.67 bn ↓4.6%
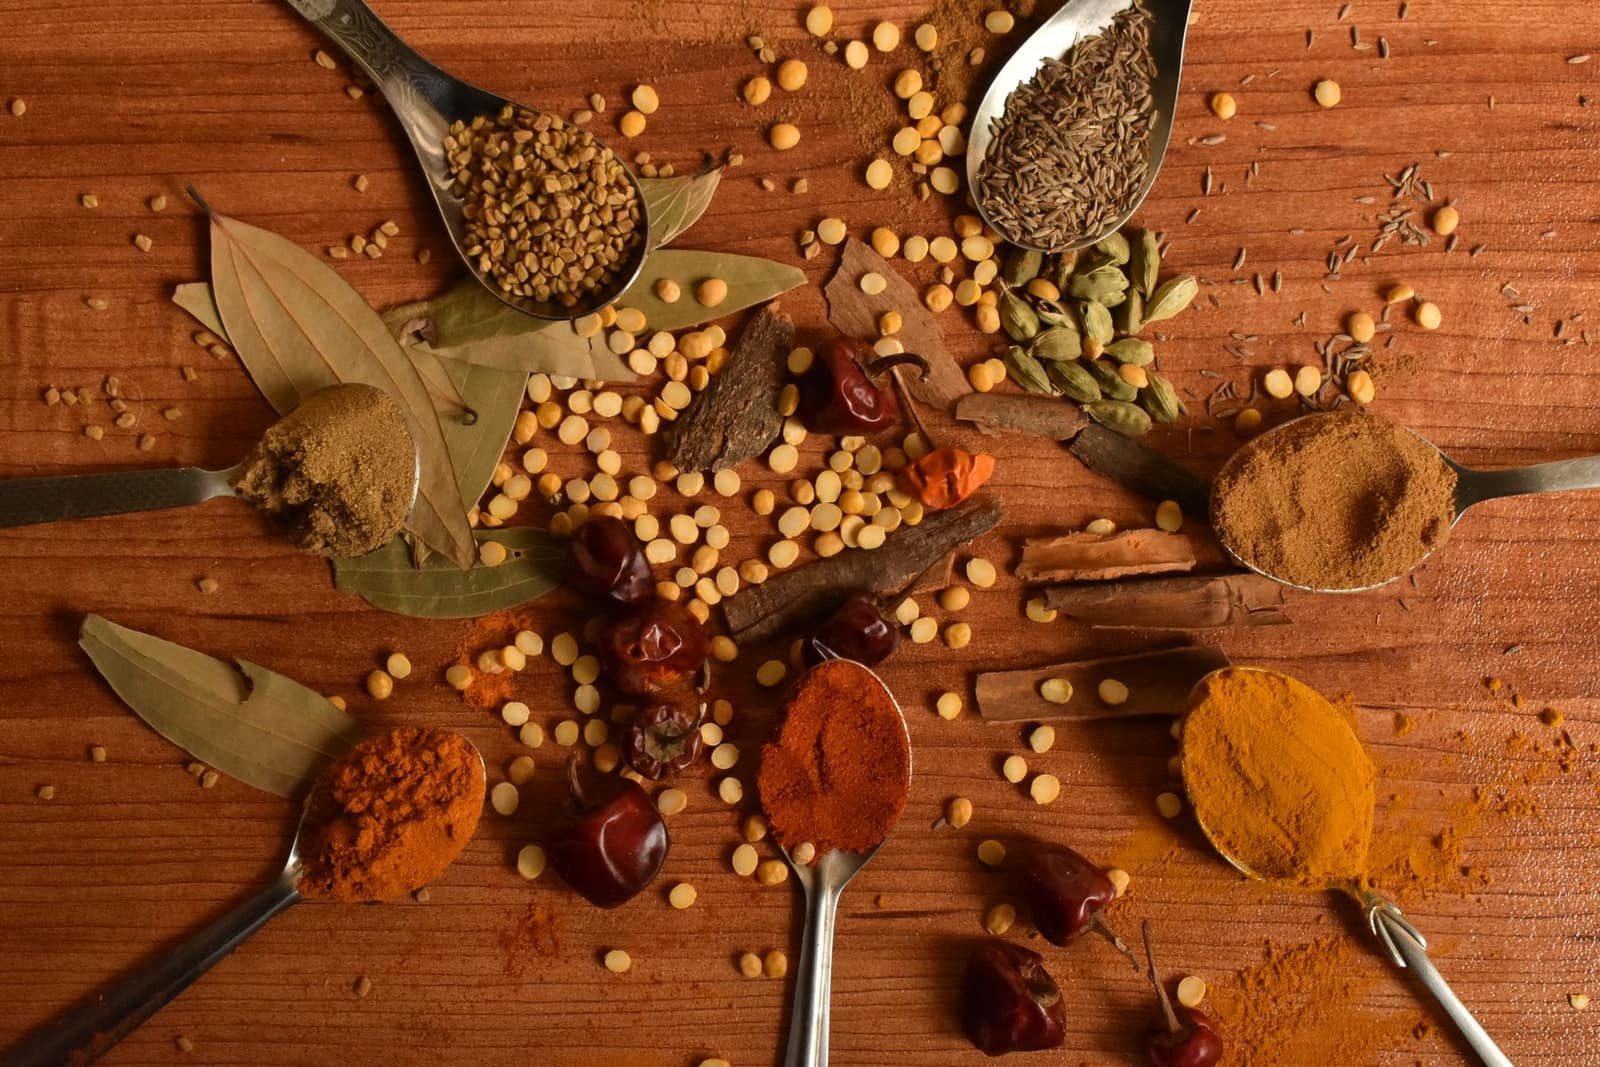 Free to exportFarm produceSpicesWhole, ground and blended spices. Spices Board registration (CRES) is compulsory; residue and ethylene oxide tests keep buyers.HS0904–0910Exports 2025-26US$ 3.12 bn ↓5.1%
 Free to exportProcessed foodTeaAssam, Darjeeling, Nilgiri and CTC tea. You need a Tea Board exporter licence; residues and GI rules matter.HS0902Exports 2025-26US$ 899 mn ↑8%
 Free to exportFarm produceFresh onionBig-volume fresh export to Asia and the Gulf. Policy swings with domestic prices — check DGFT and CBIC before every season.HS0703.10Exports 2025-26US$ 430 mn ↓8.3%
 Free to exportFarm produceFresh vegetablesOkra, green chilli, drumstick, gourds and potatoes for Gulf and UK ethnic markets. Fast, perishable and residue-sensitive.HS07Exports 2025-26US$ 2.26 bn ↑3%
 Free to exportFarm produceFresh bananaCavendish bananas by reefer to the Gulf and Central Asia. Harvest maturity, cold chain and ripening control decide profit.HS0803.90Exports 2025-26US$ 496 mn ↑30.5%
 Free to exportProcessed foodProcessed foodSnacks, pickles, ready-to-eat meals, sauces, biscuits and mixes. FSSAI licence plus the buyer country’s labelling and registration rules.HS19–21Exports 2025-26US$ 4.19 bn ↑8.9%
 Free to exportTextiles & apparelReadymade garmentsKnitted and woven clothing for brands and retailers; the USA, UK, UAE and the EU are the big buyers.HS6109.10Exports 2025-26US$ 15.8 bn ↓1.2%
More in Gulf & Middle East
 CEPAAEDAbu DhabiUnited Arab EmiratesIndia's biggest Gulf buyer and a re-export hub for the Middle East and Africa. CEPA in force since 2022.From India 2025-26US$ 37.4 bn
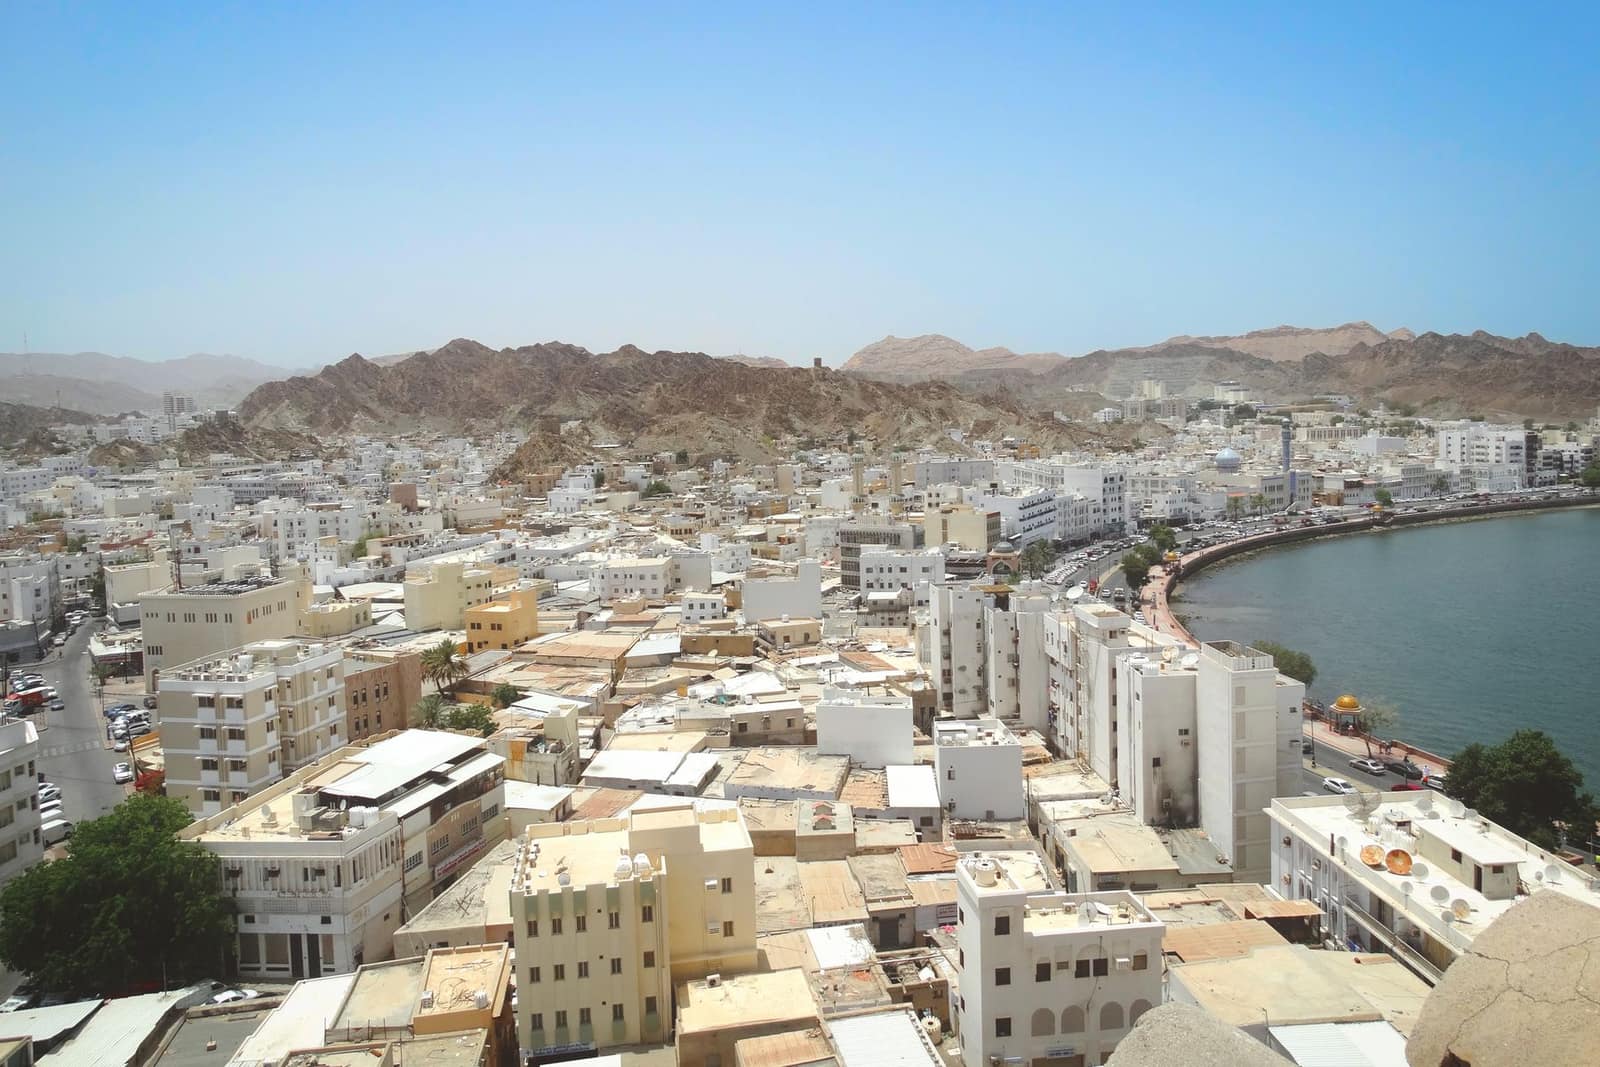 CEPAOMRMuscatOmanNew CEPA in force since June 2026 — almost all Indian goods now enter duty-free. Short sea route from Gujarat.From India 2025-26US$ 4.02 bn
 QARDohaQatarSmall, wealthy Gulf market with a huge Indian workforce. Imports nearly all its food.From India 2025-26US$ 1.62 bn
 KWDKuwait CityKuwaitRich Gulf market with a large Indian community. Buys rice, food, garments and engineering goods.From India 2025-26US$ 1.65 bn