

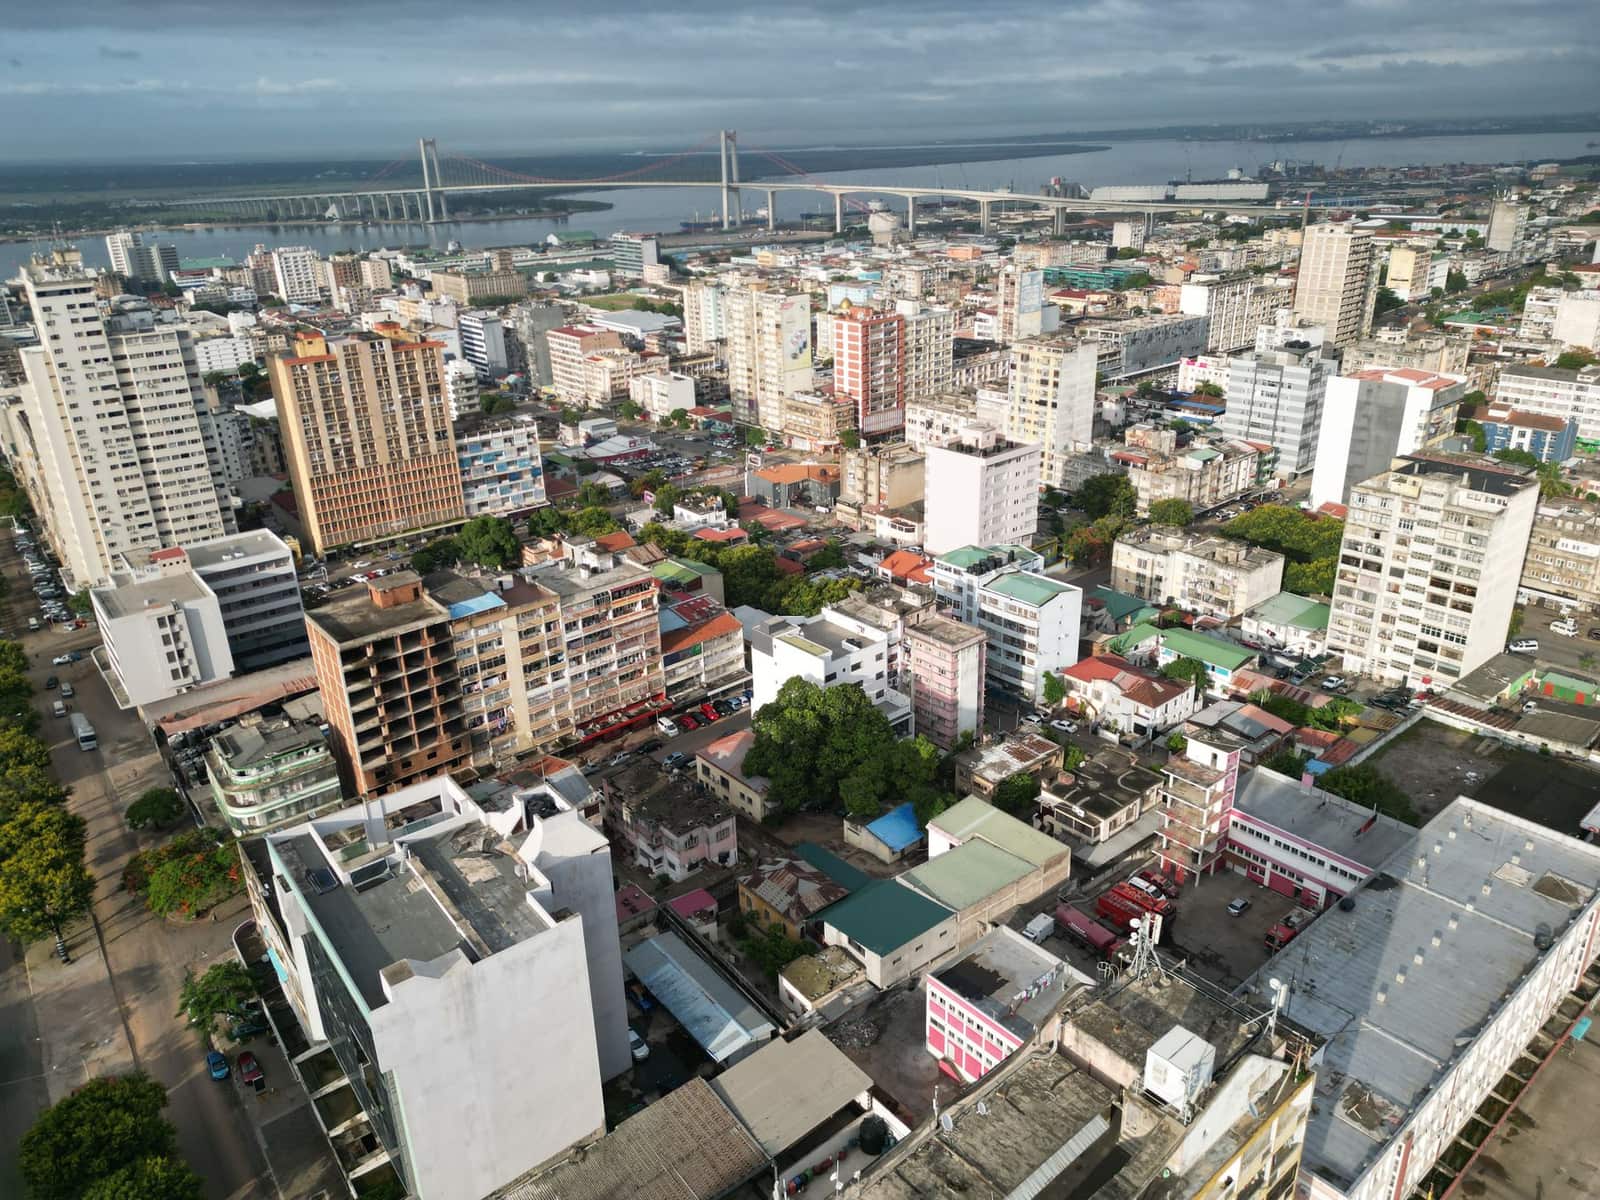
Africa
Export to Mozambique
Indian Ocean neighbour with ports serving southern Africa. Buys Indian fuels, medicines, rice, vehicles and machinery.
- Capital
- Maputo
- Currency
- MZN
- Trade agreement with India
- None
- Main ports
- Maputo, Beira, Nacala
Mozambique has no trade agreement with India but long-standing trade links across the Indian Ocean. Its ports at Maputo, Beira and Nacala also serve landlocked Malawi, Zambia and Zimbabwe. Portuguese is the official language, so labels and documents usually need Portuguese.
What it buys from India
- Petroleum products
- Medicines and pharmaceutical products
- Rice and other food
- Vehicles, machinery and steel products
Import rules on their side
- Customs is run by the Tax Authority of Mozambique (Autoridade Tributária); declarations go through the electronic single window.
- Medicines need registration with Mozambique's national medicines regulator before import.
- Plant products need an import permit from the agriculture ministry and an Indian phytosanitary certificate; food labels need Portuguese.
Practical tips
- Ask for advance payment or a confirmed LC; check ECGC cover for Mozambique before giving credit.
- If the goods go on to Malawi or Zambia, confirm the transit route (Beira or Nacala corridor) and who pays inland freight.
- Check the Indian High Commission in Maputo for buyer verification and local trade contacts.
Trade data
India’s exports to Mozambique in numbers
From the Department of Commerce’s TradeStat (Indian financial years, April–March), the country’s imports from the world from UN Comtrade, and its basics from the World Bank.
- India’s exports here, 2025-26
- US$ 1.5 bn No. 44 of our 80 countries
- Change from 2024-25
- ↑ +13.1% US$ 1.32 bn → US$ 1.5 bn
- Share of all Indian exports
- 0.34%
- Its imports from the world
- —
What India sells here most
By HS chapter, 2025-26. Change is against 2024-25.
What is rising and what is falling
Chapters where India sells at least US$ 5 million. Change from 2024-25 to 2025-26.
↑ High demand
- Railway equipmentUS$ 10.6 mn → US$ 35 mn↑+231.2%
- Explosives, matchesUS$ 8.1 mn → US$ 20.7 mn↑+155.1%
- Bakery and cereal foodsUS$ 5.6 mn → US$ 9.2 mn↑+63.2%
- Sugar and confectioneryUS$ 10.5 mn → US$ 15.9 mn↑+50.9%
- RubberUS$ 9.6 mn → US$ 12.2 mn↑+27.5%
- Iron and steel articlesUS$ 15.3 mn → US$ 18.6 mn↑+21.5%
- Fuels and petroleum productsUS$ 613 mn → US$ 739 mn↑+20.4%
- Ceramics and tilesUS$ 8.1 mn → US$ 9.5 mn↑+16.5%
↓ Low demand
- Organic chemicalsUS$ 10.6 mn → US$ 8.4 mn↓-20.7%
- Glass and glasswareUS$ 9.8 mn → US$ 8.2 mn↓-16.7%
- TobaccoUS$ 8.6 mn → US$ 7.5 mn↓-12.8%
- PlasticsUS$ 35.2 mn → US$ 31.1 mn↓-11.5%
Our product guides that sell here
India’s exports of each product to this country, 2025-26.
The 20 biggest export lines
4-digit HS lines, 2025-26, with their Harmonized System descriptions.
What India buys from Mozambique
India’s imports from this country in 2025-26 by HS chapter, from TradeStat — this country can be your supplier too.
- India’s imports, 2025-26
- US$ 2.29 bn US$ 2.1 bn → US$ 2.29 bn
- India’s exports, 2025-26
- US$ 1.5 bn
- Trade balance
- −US$ 793 mn exports minus imports
- Change in imports
- +9.2%
The country at a glance
- Population
- 35.6 mn 2025
- GDP
- US$ 22.3 bn 2025
- GDP per person
- US$ 627 2025
- Imports (goods and services)
- US$ 12.4 bn 2025
Sources: TradeStat — Export Import Data Bank, Department of Commerce · World Bank — World Development Indicators · Figures taken 29 October 2026.
What to send to Mozambique
All products → Free, with conditionsFarm produceNon-basmati riceHigh-volume staple sold mainly to Africa and Bangladesh. Export reopened in 2024–25, but contracts must now be registered with APEDA.HS1006.30Exports 2025-26US$ 5.86 bn ↓10.2%
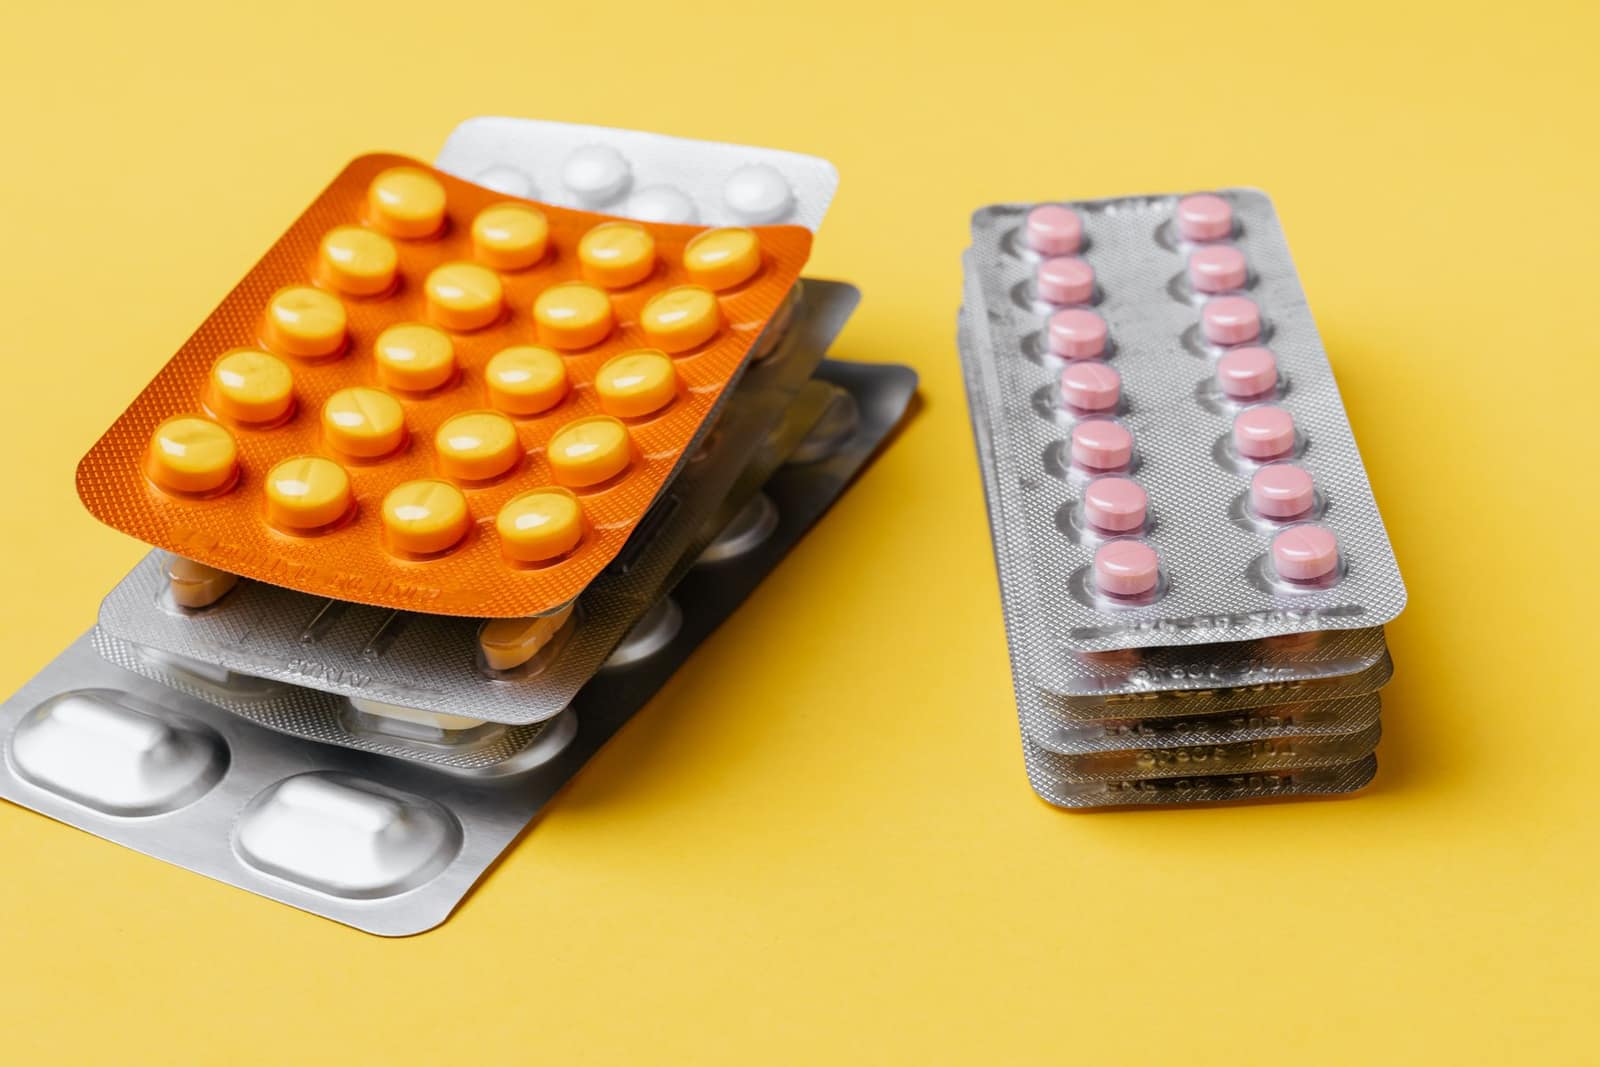 Free to exportPharma & chemicalsGeneric medicines (formulations)Tablets, capsules and injectables; every market needs product registration. The USA buys the most.HS3004Exports 2025-26US$ 21.9 bn ↓0.7%
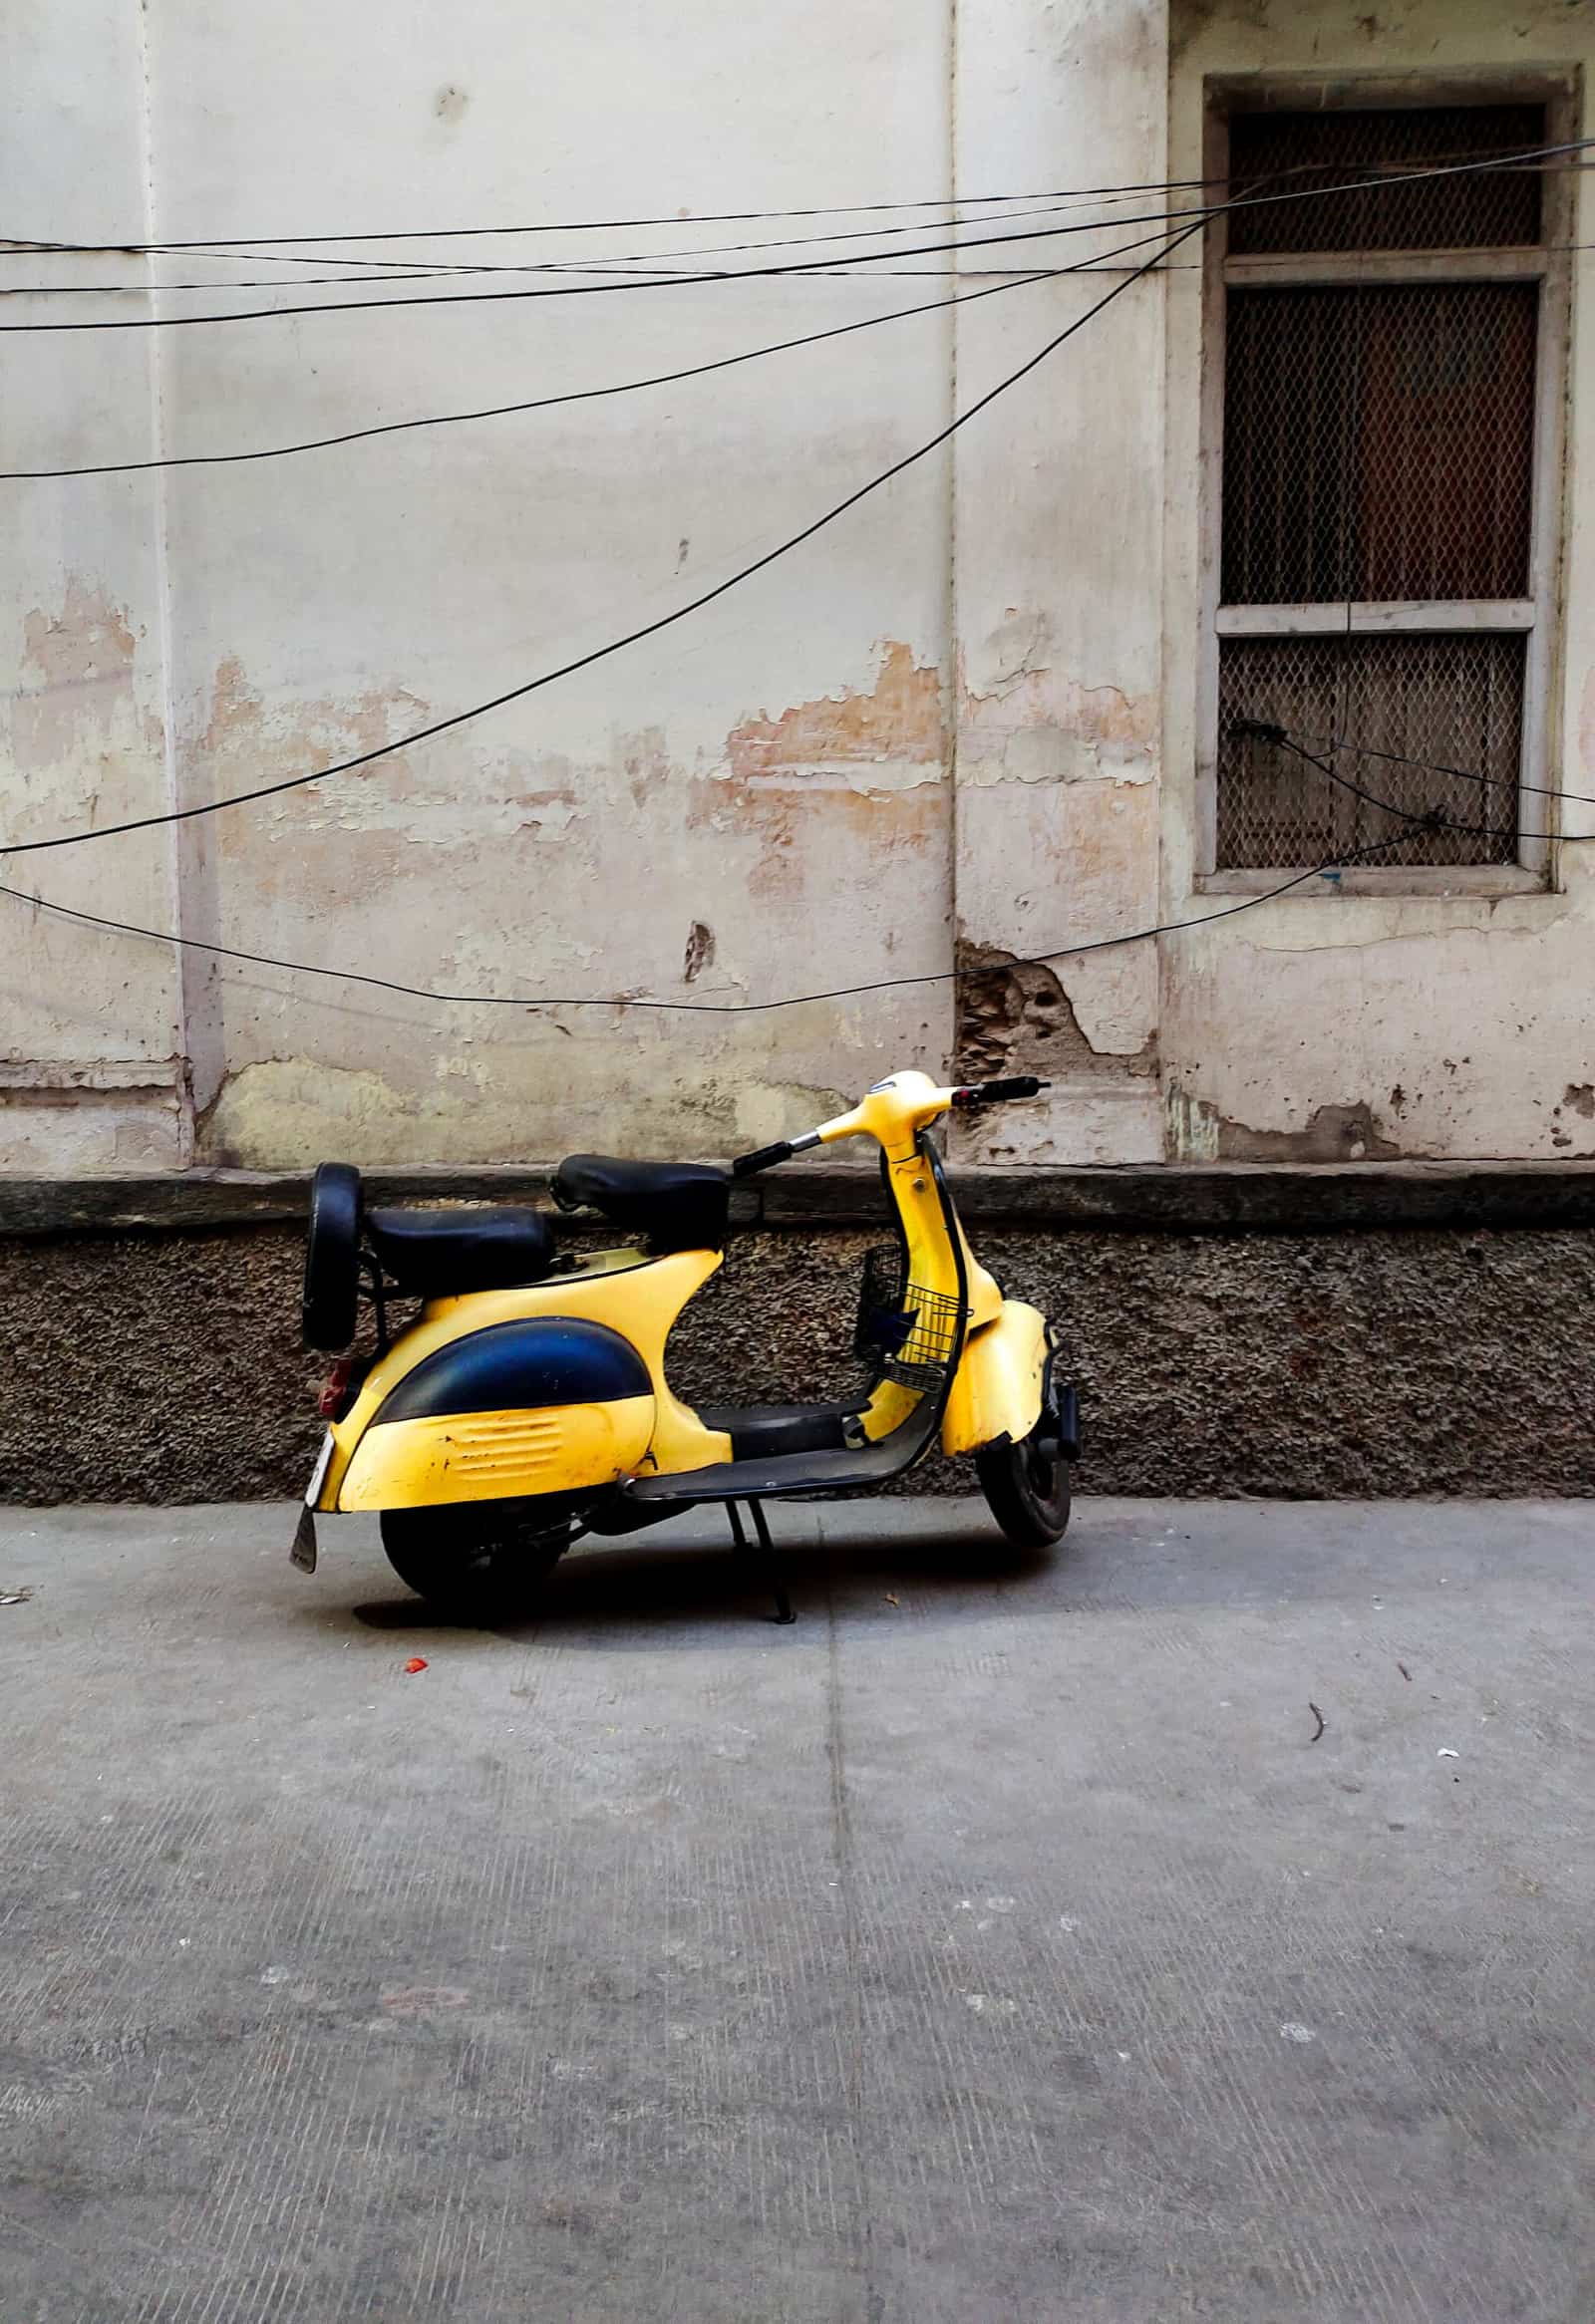 Free to exportEngineering goodsMotorcycles and scootersCommuter motorcycles and scooters for Latin America, Africa and South Asia; India is a top exporter.HS8711Exports 2025-26US$ 3.98 bn ↑24.2%
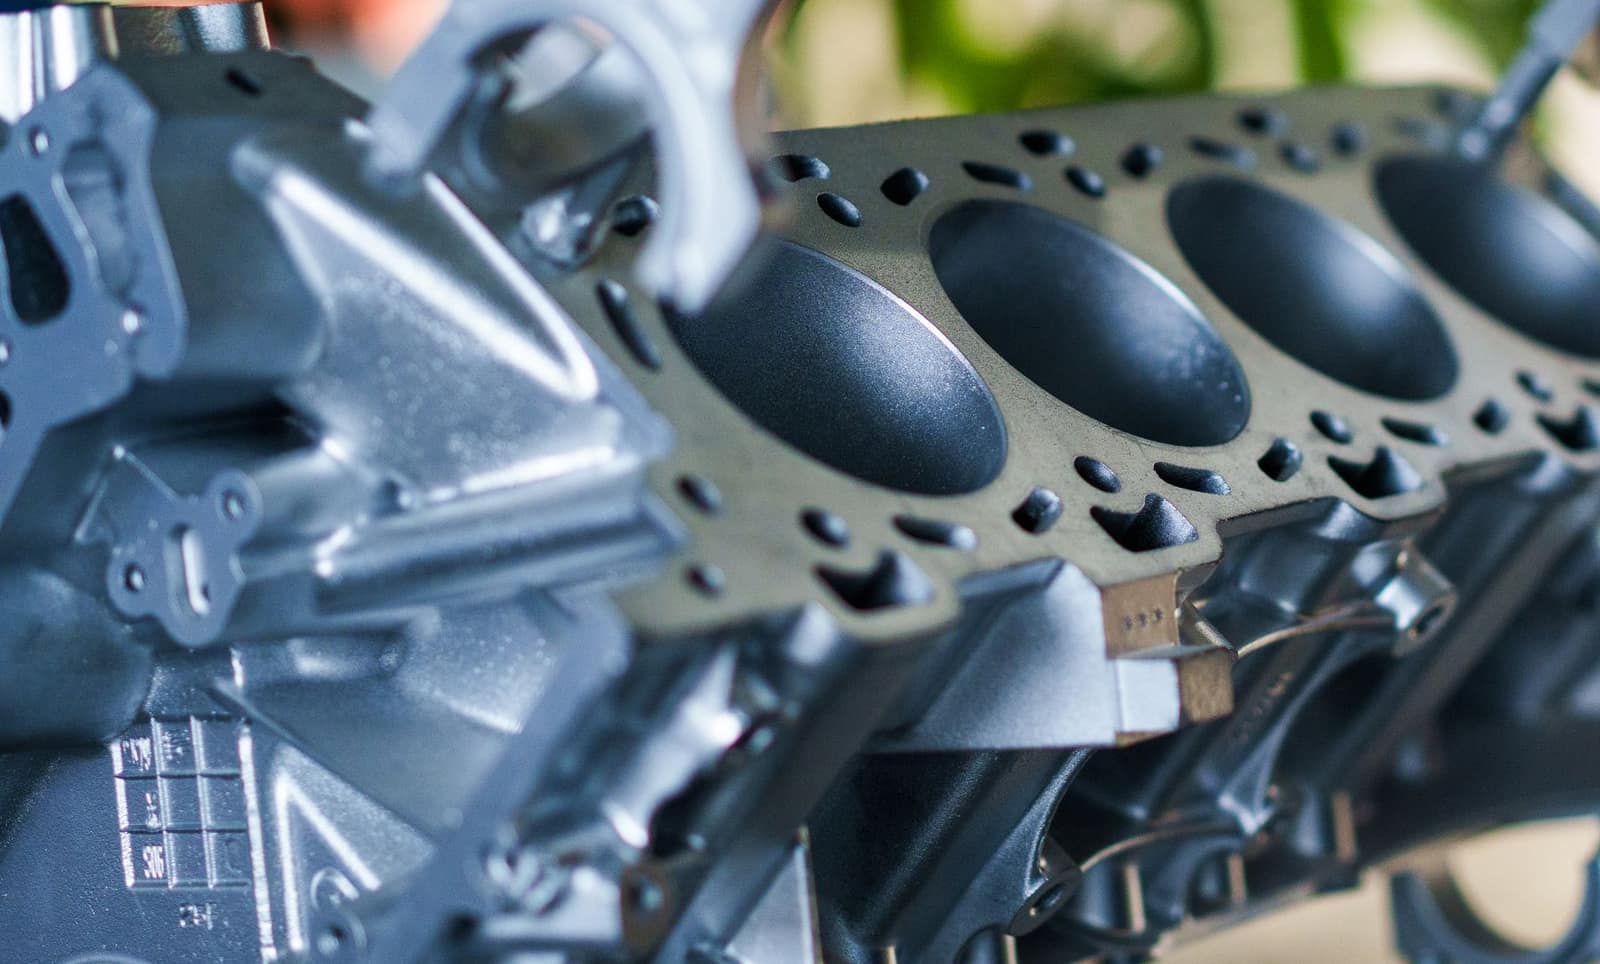 Free to exportEngineering goodsAuto parts and componentsOEM and aftermarket vehicle parts; the USA, Germany and Italy buy most, with strong demand in Latin America.HS8708Exports 2025-26US$ 7.64 bn ↑1.8%
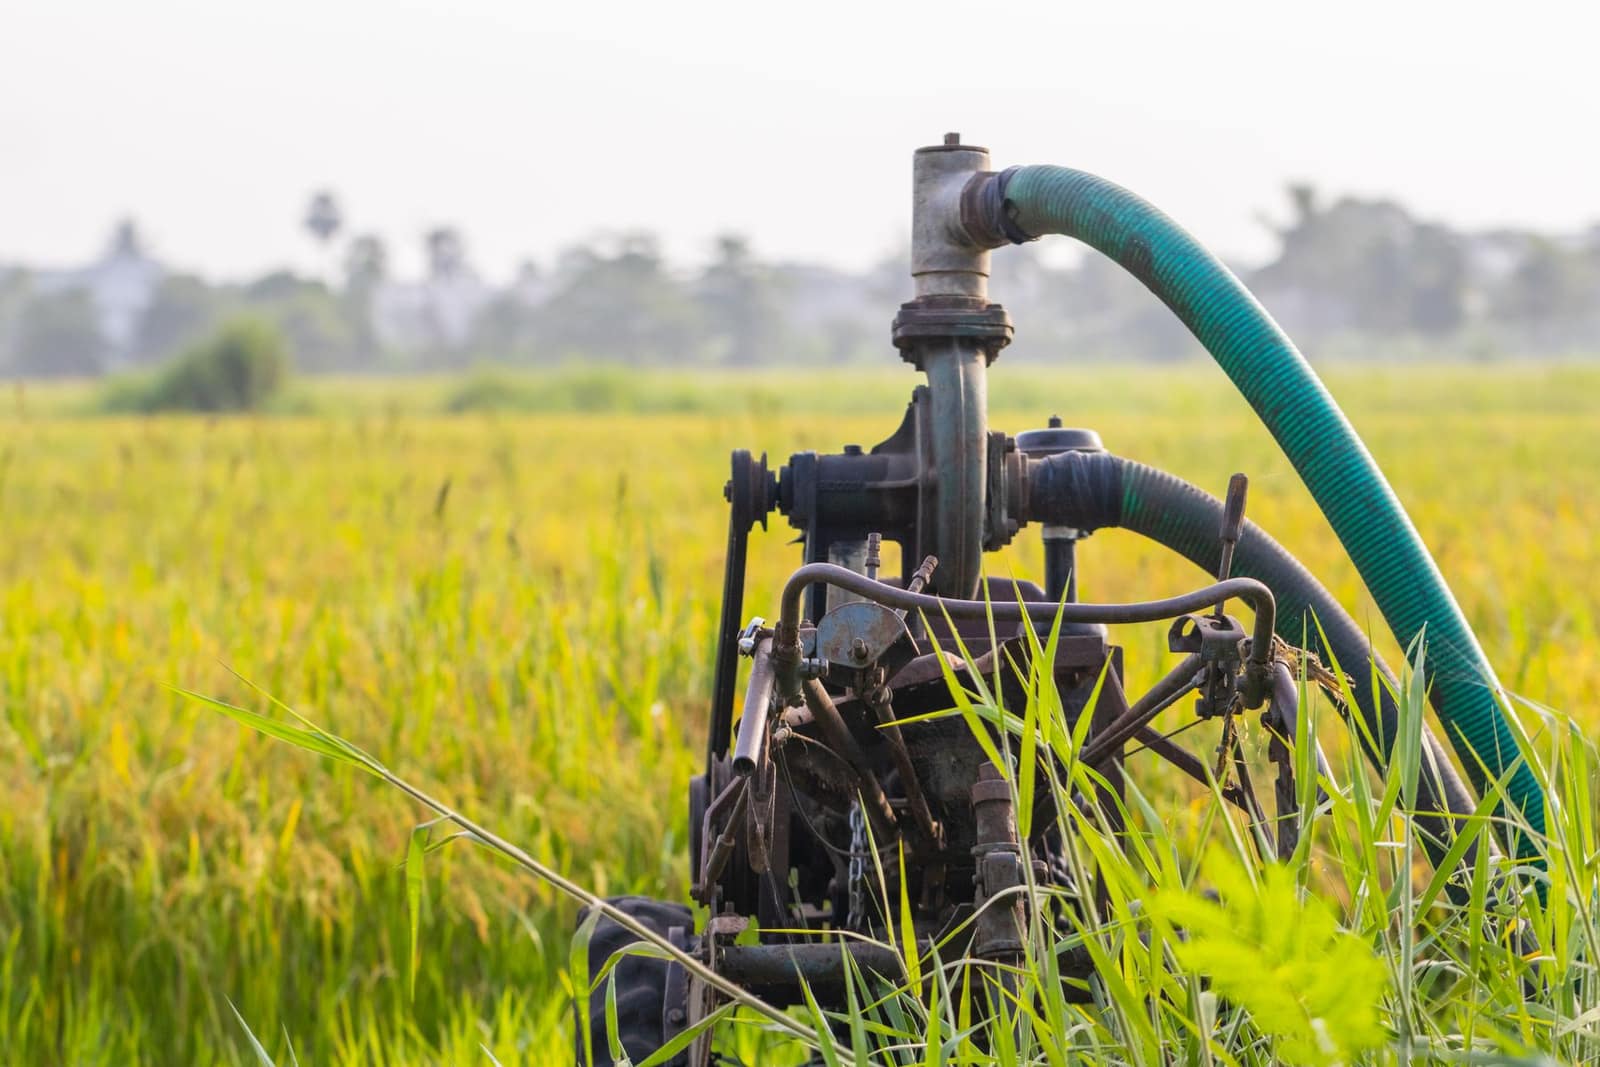 Free to exportEngineering goodsPumpsAgricultural, domestic and industrial pumps from Coimbatore, Rajkot and Ahmedabad; the USA leads.HS8413Exports 2025-26US$ 1.6 bn ↑5.2%
 Free to exportEngineering goodsFarm machineryRotavators, harrows, threshers and implements from Punjab, Gujarat and Maharashtra; the USA, Germany and Sri Lanka lead.HS8432Exports 2025-26US$ 390 mn ↑18.9%
 Free to exportOther goodsPlastic goods and packagingWoven sacks, FIBC bags, containers and household plastics; the USA leads, then the UAE and UK.HS3923Exports 2025-26US$ 1.21 bn ↑3.3%
 Free to exportFarm produceSpicesWhole, ground and blended spices. Spices Board registration (CRES) is compulsory; residue and ethylene oxide tests keep buyers.HS0904–0910Exports 2025-26US$ 3.12 bn ↓5.1%
More in Africa
 KESNairobiKenyaEast Africa's trade gateway via Mombasa. Buys medicines, vehicles, steel and rice; KEBS pre-shipment checks apply.From India 2025-26US$ 4.02 bn
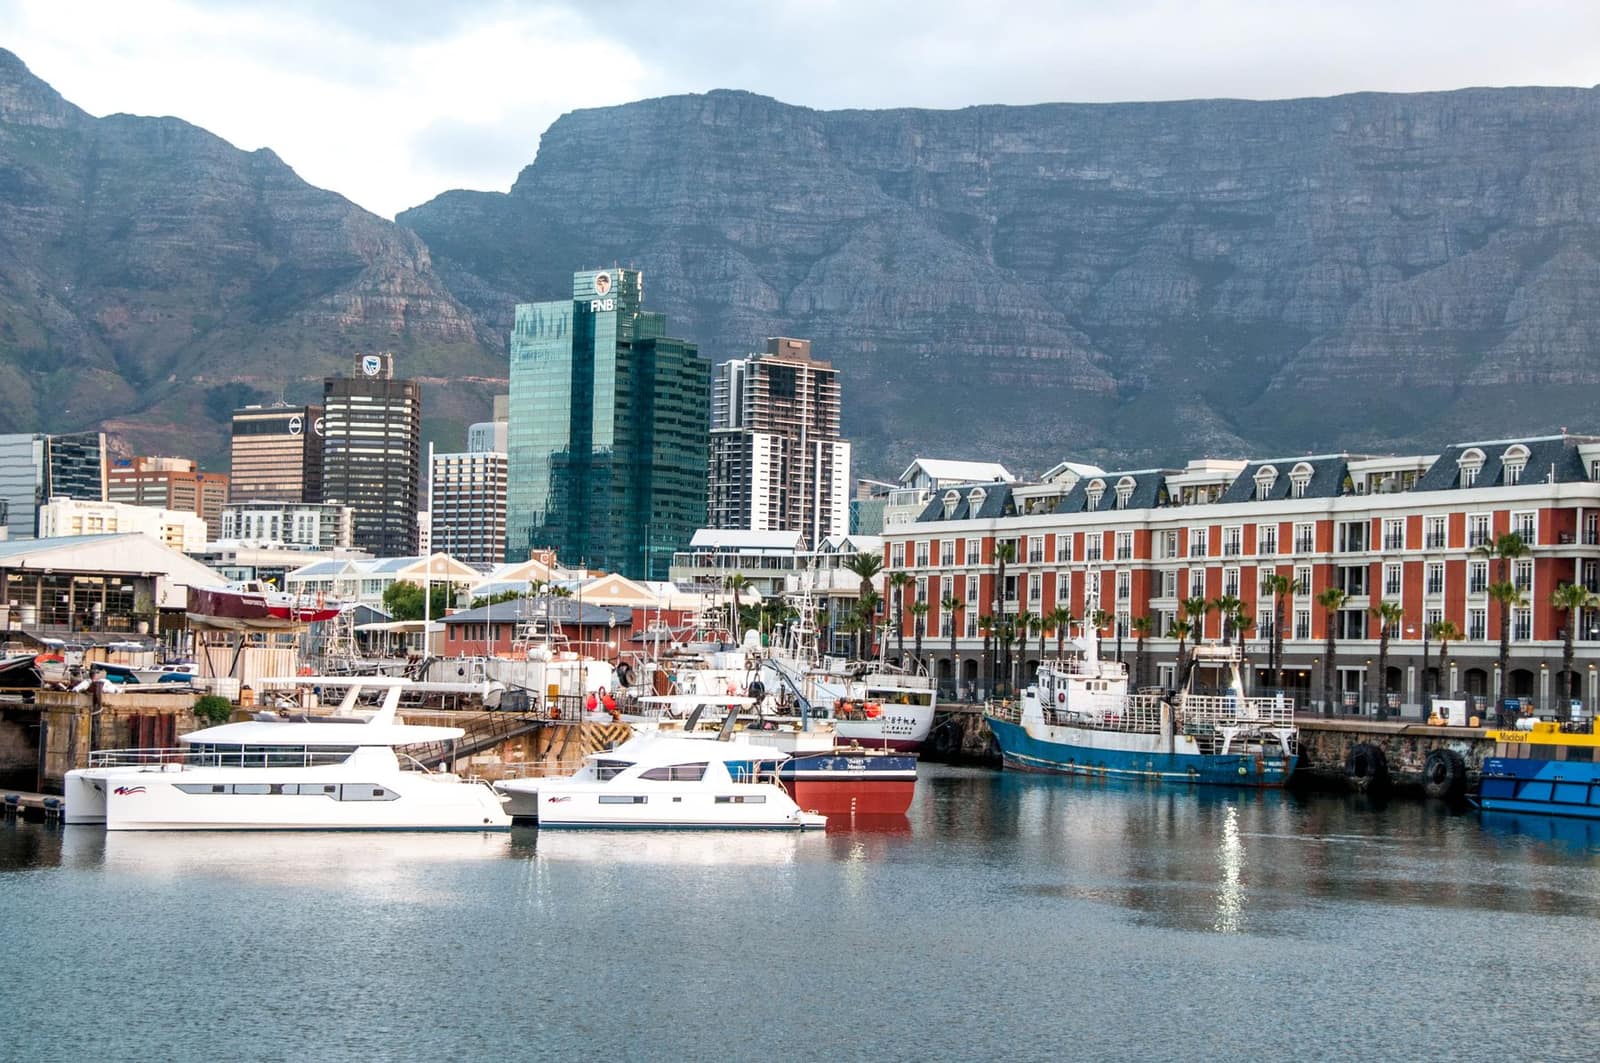 ZARPretoria (executive capital)South AfricaAfrica's most industrial economy. Buys vehicles, medicines, rice and chemicals; NRCS approval for regulated goods.From India 2025-26US$ 7.01 bn
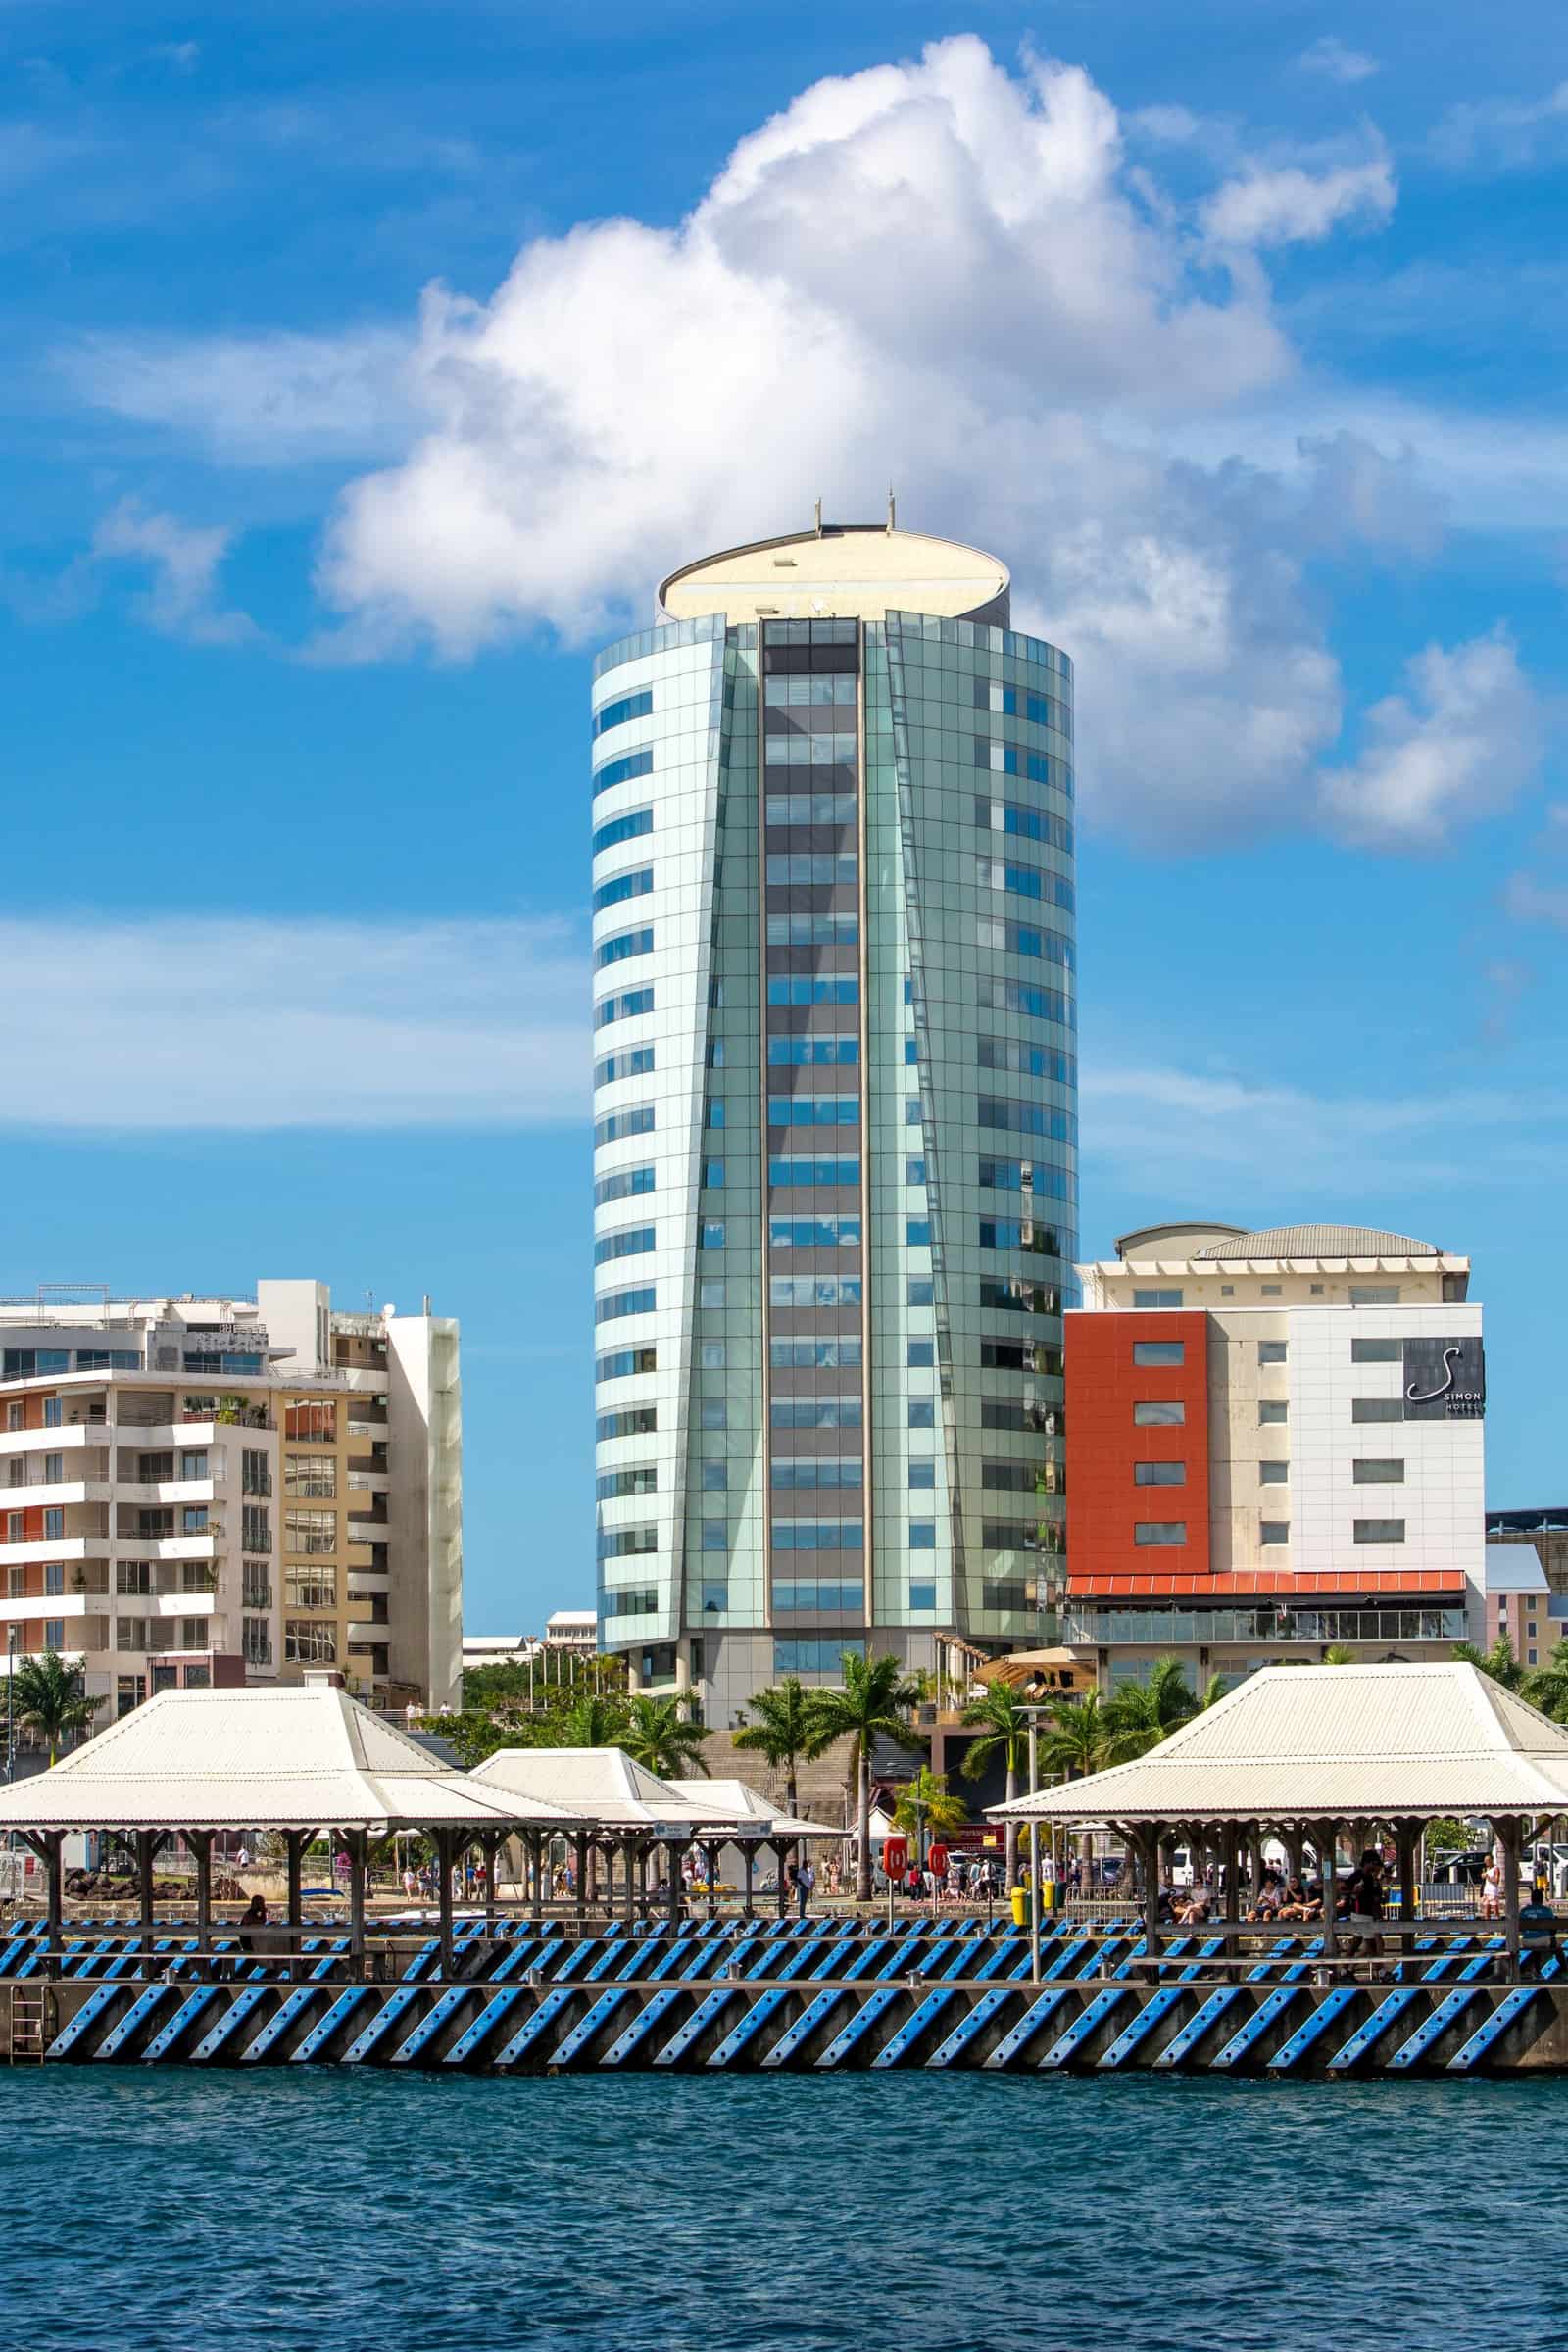 CECPAMURPort LouisMauritiusSmall island market with deep Indian roots and a CECPA covering 300+ products.From India 2025-26US$ 474 mn
 EGPCairoEgyptLarge North African market. Every shipment must be pre-registered on Egypt's ACI system before loading.From India 2025-26US$ 3.87 bn