

Engineering goods
Export bicycles and parts
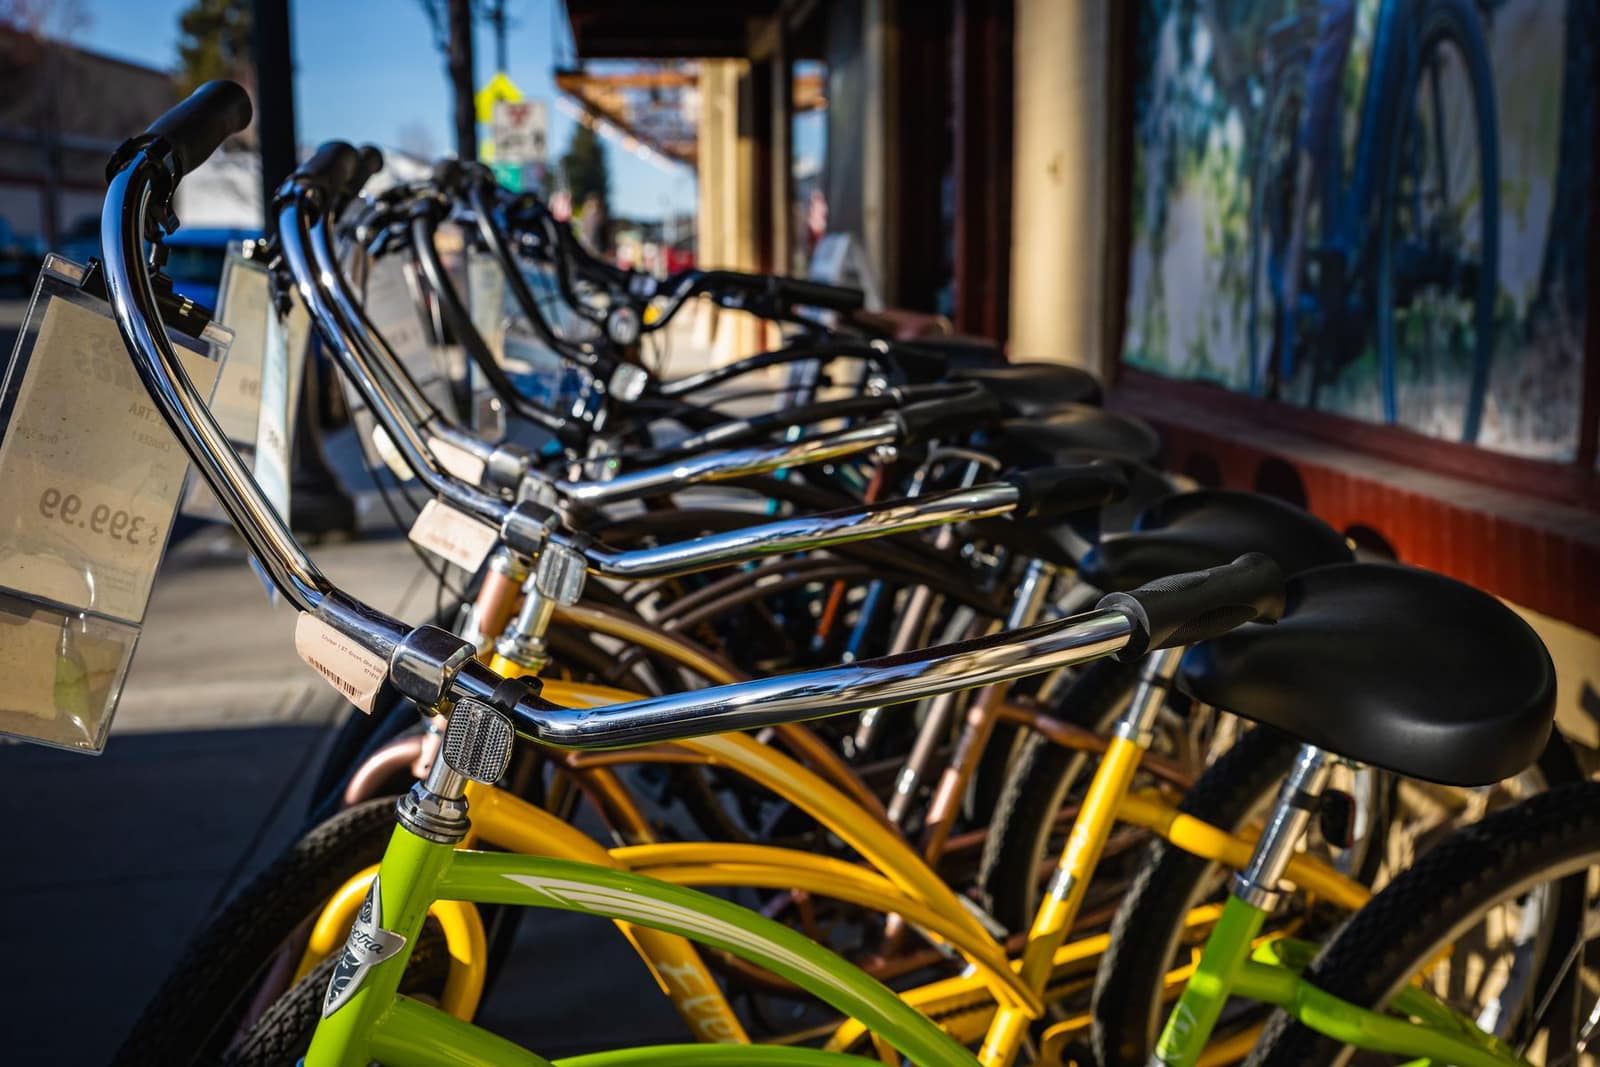
Ludhiana cycles and cycle parts; parts sell far more than complete bikes, mainly to South Asia.
- HS code
- 8712 Bicycles and other cycles, not motorised (HS 8712). Bicycle and two-wheeler parts and accessories are HS 8714.
- Export policy
- Free to export Free to export under ITC(HS) Schedule 2. Confirm the exact 8-digit line on the DGFT ITC(HS) search before shipping.
- Registrations
- 3 IEC, GST and those below
- India’s exports, 2025-26
- US$ 1.35 bn to 145 countries
What is exported
Ludhiana makes most of India's bicycles and parts. In 2025-26 India exported about US$ 77 million of complete bicycles (HS 8712), mainly to the USA, Mozambique, the UK, the Netherlands and Nepal, and about US$ 1.27 billion of parts under HS 8714 (which also covers motorcycle parts), led by Bangladesh, Brazil and Sri Lanka (Commerce Department data).
Varieties, grades and forms
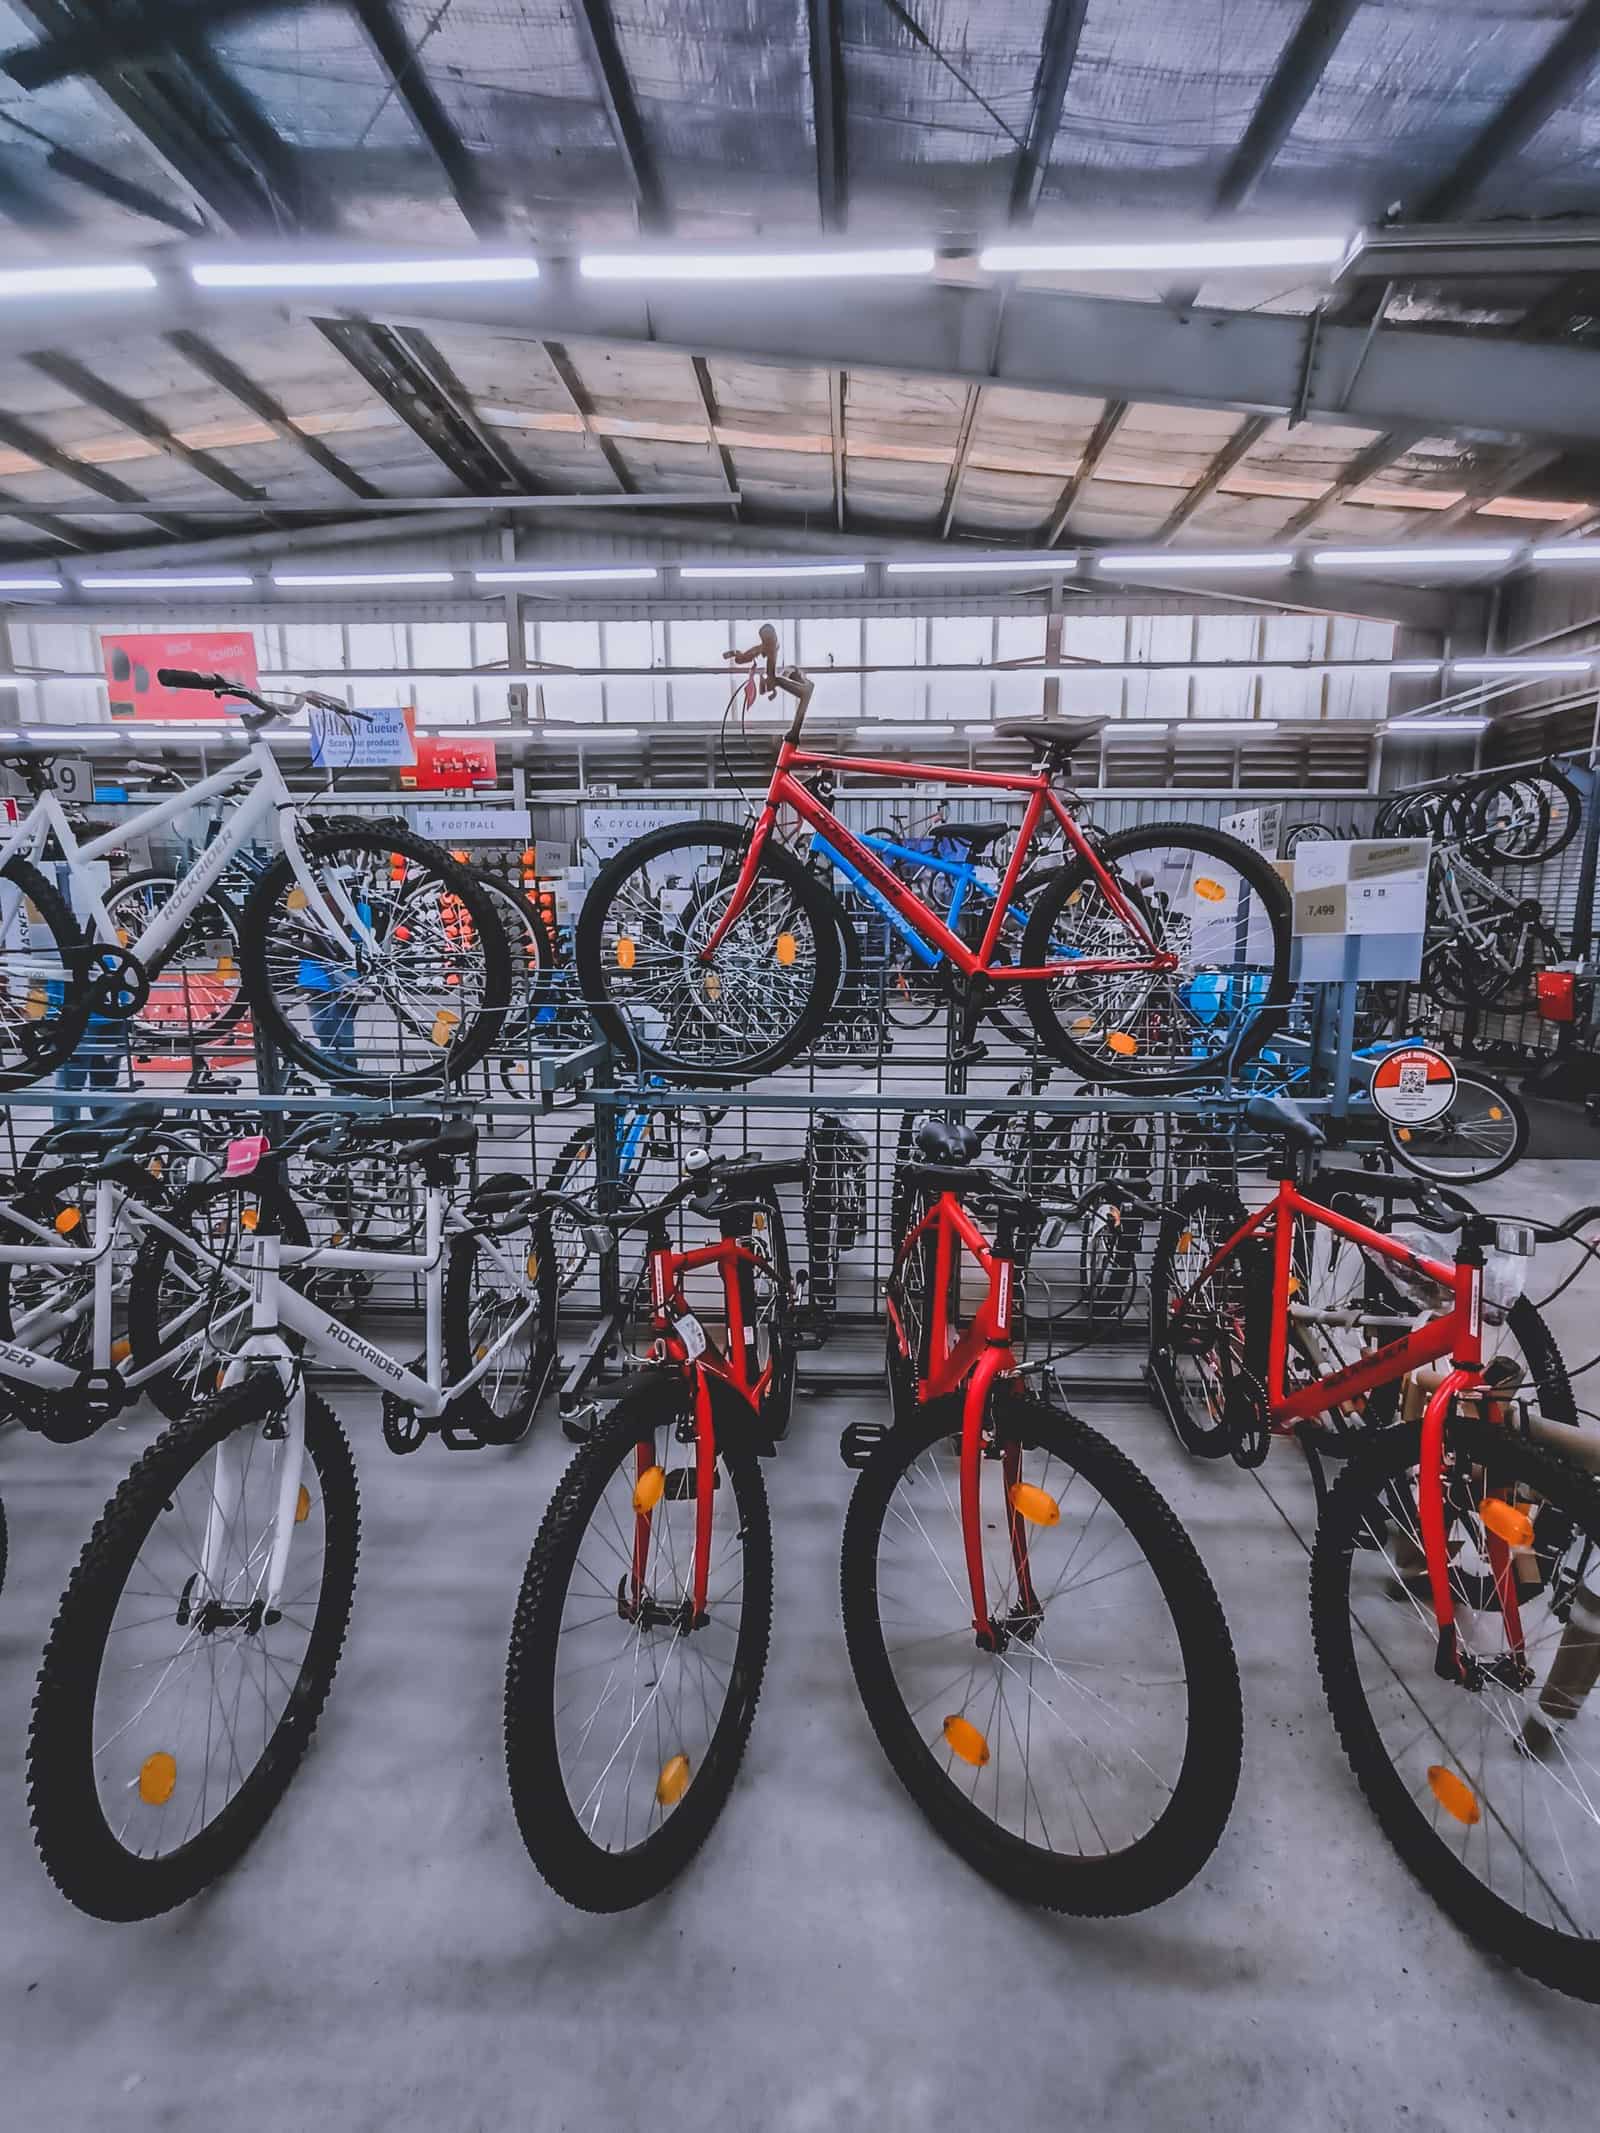
- Standard roadster and utility bicyclesHeavy-duty single-speed steel cycles for Africa and South Asia, often shipped knocked down.
- Multi-speed, mountain and hybrid bicyclesGeared cycles for Europe and the USA, where buyers want alloy frames and branded components.
- Children's bicyclesSmall-wheel cycles; strict toy-like safety rules in many markets.
- Bicycle parts (HS 8714)Rims, hubs, chains, free-wheels, frames, saddles and spokes — a far bigger export than complete cycles.
- Two-wheeler parts (HS 8714 10)Motorcycle parts and accessories, also under HS 8714.
Where it is grown or made
- PunjabLudhiana — India's bicycle and cycle-parts centre
- Tamil NaduChennai (Ambattur)
- Haryana and Uttar PradeshSonipat, Ghaziabad and Noida
The quality buyers ask for
- Safety standard
- ISO 4210 (city, trekking, mountain, racing bicycles) and ISO 8098 (children's bicycles); EU buyers cite EN ISO 4210
- USA
- 16 CFR Part 1512: brakes, reflectors, frame strength and assembly tests, with a Children's Product Certificate for kids' bikes
- Frame and finish
- Steel or alloy grade, frame size, paint adhesion and salt-spray test for chrome parts
- Parts
- Chain pitch, rim size (ISO/ETRTO), spoke gauge and hub dimensions to the buyer's drawing
Certificates
- Test report to ISO 4210 / EN ISO 4210RequiredEU and UK buyers ask for it; the General Product Safety Regulation makes the importer responsible for safety.
- CPSC certificate (USA)RequiredGeneral Certificate of Conformity, or Children's Product Certificate based on a CPSC-accepted lab test for kids' bikes.
- CE marking (e-bikes only)Often askedElectric bicycles fall under the EU Machinery rules and need CE marking; plain bicycles do not.
- ISO 9001Often askedQuality management system; expected by most industrial buyers.
Shipping, storage and shelf life
A 40-ft high-cube container typically takes about 400–600 boxed adult bicycles, or many more as CKD kits (trade practice).
Sea from Mundra or Nhava Sheva via ICD Ludhiana; road to Nepal and Bangladesh.
Dry storage to protect chrome and paint from rust.
What goes on the pack and carton
- Frame serial number and the buyer's brand decals; country of origin on the frame or carton.
- Owner's manual in the market language with assembly and safety instructions (required in the EU and USA).
- USA: permanent tracking label on children's bicycles.
The Research and Development Centre for Bicycle and Sewing Machine (RDCBSM), Ludhiana, tests bicycles and parts. For CPSC children's product tests, use a CPSC-accepted lab (listed on cpsc.gov). Search the NABL directory for 'bicycle' for other labs.
Benefits of exporting this product
- RoDTEP: 1.8% of FOB
Tariff item 8712 00 10 (bicycles) earns 1.8% of FOB value, capped at ₹70 per unit, as a duty credit scrip on ICEGATE. Most bicycle parts under 8714 91–8714 99 (frames, rims, spokes, hubs, free-wheels) carry 1.9% with small per-unit or per-kg caps; saddles (8714 10 10) carry 0.8%. These rates continue to 31 Dec 2026 (DGFT Notification 41/2026-27). Confirm your exact 8-digit line on the DGFT RoDTEP page before you price an order.
DGFT — Appendix 4R, RoDTEP schedule for DTA exports w.e.f. 10.10.2024 (Notification 32/2024-25); rates continued to 31.12.2026 by Notification 41/2026-27 ↗ - Duty drawback: 2% of FOB
Drawback item 871201 (single-speed bicycles) has an All Industry Rate of 2% of FOB, capped at ₹68.3 per unit, paid into your bank account. It is not available on exports under Advance Authorisation or from EOU/SEZ units. Multi-speed bicycles (871202) get 8.6%, capped at ₹463.7; mountain bicycles (871203) get 8.2%, capped at ₹323. Most cycle parts under 8714 get 2% with item-wise caps. Check the current schedule on the CBIC drawback page before shipping.
Gazette of India — Notification 77/2023-Customs (N.T.) dated 20.10.2023: All Industry Rates of duty drawback ↗ - Zero duty into the UK (CETA)
The India-UK CETA came into force on 15 July 2026 and gives zero-duty access to nearly 99% of India's exports; the Commerce Ministry named engineering goods among the sectors that gain. Claim it with a CETA certificate of origin and check the line for your code on the UK Trade Tariff.
PIB — India-UK CETA enters into force (15 Jul 2026): textiles, leather, gems and jewellery and engineering goods among the gainers ↗
Where to register
- EEPC India (Engineering Export Promotion Council)RCMC — DGFT Appendix 2T lists bicycles, bicycle components and accessories under EEPC.eepcindia.org ↗
Quality and checks
- EU and UK: safety tests to EN ISO 4210 (ISO 8098 for children's bikes); the importer is responsible under the General Product Safety Regulation.
- USA: 16 CFR Part 1512 requirements and a certificate of conformity; children's bikes need CPSC-accepted lab testing.
- Wood pallets and crates must carry the ISPM 15 mark.
Start with parts — rims, spokes, free-wheels or saddles — for assemblers in Bangladesh, Nepal, Sri Lanka or Africa, who buy mixed containers. Join EEPC and use Ludhiana's supplier base; move to complete bikes once you can pass ISO 4210 tests.
Where new exporters go wrong
- Rust on chrome and steel parts after a humid sea voyage.
- Shipping children's bikes to the USA without CPSC testing.
- Underquoting freight: complete bikes are bulky.
Documents this product needs
Schemes that apply
- RoDTEP Remission of Duties and Taxes on Exported Products
- Drawback Duty Drawback (All Industry Rates)
- Advance Authorisation Advance Authorisation
- EPCG Export Promotion Capital Goods Scheme
- ECGC ECGC export credit insurance for small exporters
- LUT Letter of Undertaking for zero-rated exports under GST
- MAI / MAS Market Access Initiative (now Market Access Support under EPM)
- CGSE Credit Guarantee Scheme for Exporters
- Districts as Export Hubs Districts as Export Hubs
Sources (6)
- Department of Commerce, Export Import Data Bank — India's exports of HS 8712 and 8714 by country, 2025-26
- DGFT — Appendix 2T: Export Promotion Councils and the products under each
- DGFT — ITC(HS) export policy search (Schedule 2)
- eCFR — 16 CFR Part 1512, Requirements for bicycles (US CPSC)
- EUR-Lex — General Product Safety Regulation (EU) 2023/988, summary
- EEPC India (Engineering Export Promotion Council) — official site
Trade data
Indian bicycles and parts exports in numbers
From the Department of Commerce’s TradeStat, country by country. US$, Indian financial years (April–March).
- Exports in 2025-26
- US$ 1.35 bn +12.2% a year on average, 2020-21 to 2025-26
- Change from 2024-25
- ↑ +11.9% US$ 1.2 bn → US$ 1.35 bn
- Buyer countries
- 145
- Average export price
- US$ 5.82 per kg · 2,31,244 tonnes shipped · US$ 5.79 the year before
The price cycle
India’s average export price per kg each year (total value ÷ total quantity). Highest in 2025-26, lowest in 2020-21 — a 52% swing between them. Keep this swing in mind when you quote.
What next: a projection from the trend
The past trend carried forward — not a forecast by any authority. Sudden changes in policy, prices or demand are not in it.
Likely range US$ 1.39 bn to US$ 1.85 bn.
- Trend
- +10% a year
- Fit (R²)
- 0.82
- Based on
- 6 years of official figures
Method: a straight line through the logarithm of yearly exports (log-linear regression); range = ±1 standard error.
Biggest buyer countries
By value in 2025-26. Change is against 2024-25.
Where demand is rising and falling
Only countries that buy at least US$ 1 million or 1% of India’s exports of this product. Change from 2024-25 to 2025-26.
↑ High demand
- KenyaUS$ 9.3 mn → US$ 14 mn↑+50.9%
- United States of AmericaUS$ 36 mn → US$ 53.4 mn↑+48.2%
- IndonesiaUS$ 46.4 mn → US$ 60.6 mn↑+30.8%
- BrazilUS$ 142 mn → US$ 184 mn↑+29.2%
- United Arab EmiratesUS$ 23.6 mn → US$ 29.5 mn↑+24.9%
- ColombiaUS$ 57.1 mn → US$ 71.3 mn↑+24.8%
- GermanyUS$ 43.8 mn → US$ 53.9 mn↑+23%
- EgyptUS$ 26.1 mn → US$ 31.7 mn↑+21.2%
↓ Low demand
Which forms sell, and at what price
India’s exports by 8-digit tariff line, 2025-26. Average price = total value ÷ total quantity (TradeStat): the average of every shipment on that line, not the price of any one deal.
| Tariff line | Value 2025-26 | Change | Quantity | Average price |
|---|---|---|---|---|
Parts and accessories of motorcycle excluding saddle8714 10 90 · Motorcycles, parts and accessories | US$ 990 mn | ↑+11.8% | 1,16,244 tonnes | US$ 8.51 per kgwas US$ 8.47 |
Others-of-other prtsandaccssrs of bicyclesand other cycles8714 99 90 · Cycles, parts thereof in item no. 8714.9 | US$ 80.3 mn | ↑+24.2% | 14,248 tonnes | US$ 5.64 per kgwas US$ 5.00 |
Bicycles and other cycles, including delivery tricycles, not motorised — bicycles8712 00 10 | US$ 75.6 mn | ↑+11.9% | 2.0 mn pieces | US$ 37.79 per piecewas US$ 41.07 |
Frames,forks and parts thereof8714 91 00 · Cycles, frames and forks, and parts thereof | US$ 67.5 mn | ↑+10.8% | 35.6 mn pieces | US$ 1.90 per piecewas US$ 1.78 |
Brakes,including coaster braking hubs and hub brakes and parts thereof8714 94 00 · Cycles, parts thereof, brakes, including coaster braking hubs and hub-brakes, and parts thereof | US$ 34.9 mn | ↑+11.1% | 5,638 tonnes | US$ 6.19 per kgwas US$ 6.00 |
Others-of-hubs,excluding coaster brkng hubs and hub brakes,and free-wheel,sprocket-wheels8714 93 90 · Cycles, parts thereof, hubs and free-wheel sprocket-wheels | US$ 16.3 mn | ↑+57.8% | 2,566 tonnes | US$ 6.36 per kgwas US$ 4.43 |
Pedals and crank-gear and parts thereof8714 96 00 · Cycles, parts, pedals and crank-gear, and parts thereof | US$ 15 mn | ↓-3% | 8,061 tonnes | US$ 1.86 per kgwas US$ 1.92 |
Cycles, parts thereof, hubs and free-wheel sprocket-wheels — bicycle free-wheels8714 93 20 | US$ 12.8 mn | ↓-14.8% | 4,577 tonnes | US$ 2.80 per kgwas US$ 2.74 |
Others-of-parts and accssrs of invalid carriages8714 20 90 · Carriages for disabled persons, parts and accessories thereof | US$ 9.9 mn | ↑+18.6% | 1,560 tonnes | US$ 6.36 per kgwas US$ 8.14 |
Others-of-wheel,rims and spokes8714 92 90 · Cycles, parts thereof, wheel rims and spokes | US$ 8.9 mn | ↑+8.8% | 8.0 mn pieces | US$ 1.11 per piecewas US$ 1.05 |
Invalid cargs parts not mechanically proplld8714 20 20 · Carriages for disabled persons, parts and accessories thereof | US$ 7.5 mn | ↓-11.5% | 792 tonnes | US$ 9.40 per kgwas US$ 9.40 |
Cycles, parts thereof, wheel rims and spokes — bicycle rims8714 92 10 | US$ 7.2 mn | ↑+12.8% | 4.5 mn pieces | US$ 1.60 per piecewas US$ 1.78 |
Cycles, parts thereof in item no. 8714.9 — bicycle chain8714 99 10 | US$ 6.6 mn | ↓-11.7% | 4,000 tonnes | US$ 1.66 per kgwas US$ 1.69 |
Cycles, parts thereof, saddles — bicycle saddles8714 95 10 | US$ 4.8 mn | ↑+18% | 2,434 tonnes | US$ 1.97 per kgwas US$ 1.77 |
The world market
Each country’s own recorded exports and imports in UN Comtrade, 2023 (the latest year nearly every country has reported).
- World imports
- US$ 32.4 bn 2023
- India among exporters
- #9 of 160 countries
- India’s share of world exports
- 2.7% US$ 978 mn
- Left for others to win
- US$ 35.6 bn exported by other countries
Top exporters — your competitors
- 1ChinaUS$ 12.6 bn 34.4%
- 2Other Asia, nesUS$ 4.54 bn 12.4%
- 3GermanyUS$ 2.25 bn 6.2%
- 4ItalyUS$ 1.81 bn 4.9%
- 5JapanUS$ 1.64 bn 4.5%
- 6NetherlandsUS$ 1.42 bn 3.9%
- 7IndonesiaUS$ 1.22 bn 3.3%
- 8Viet NamUS$ 997 mn 2.7%
- 9IndiaUS$ 978 mn 2.7%
- 10USAUS$ 885 mn 2.4%
Biggest buyers in the world
- 1GermanyUS$ 4.48 bn 13.8%
- 2USAUS$ 2.96 bn 9.1%
- 3NetherlandsUS$ 2.01 bn 6.2%
- 4FranceUS$ 1.5 bn 4.6%
- 5ItalyUS$ 1.31 bn 4%
- 6AustriaUS$ 1.24 bn 3.8%
- 7JapanUS$ 1.13 bn 3.5%
- 8Other Asia, nesUS$ 1.1 bn 3.4%
- 9ChinaUS$ 1.01 bn 3.1%
- 10BrazilUS$ 948 mn 2.9%
Opportunity: what these countries buy from the world, and from India
Each country’s own recorded imports in UN Comtrade, latest year it has reported. The long light part of each bar is demand other countries are filling today.
TradeStat’s 2023-24 quantities are double-counted, so that year is left out of the price. Sources: TradeStat — Export Import Data Bank, Department of Commerce · UN Comtrade database (United Nations Statistics Division) · Figures taken 29 October 2026.
Step by step
How to export bicycles and parts
India is the world's second-largest bicycle producer after China, but most output is sold at home; exports are led by bicycle parts from Ludhiana rather than complete cycles. China and Taiwan dominate world trade, with Taiwan strong in premium bikes and China in volume. Indian parts go mainly to Bangladesh, Sri Lanka, Brazil and Indonesia, while complete cycles go to the USA, the UK, the Netherlands and Africa. Demand in Europe has shifted to e-bikes and geared bikes. Openings are in parts for assemblers in South Asia and Africa, basic cycles for government programmes, and geared and children's bikes for buyers looking beyond China.
- 01Pick parts or complete cycles
Parts are easier to start with; complete bikes need full safety testing.
- 02Register with EEPC India
Bicycles and parts are under EEPC; take its RCMC.
- 03Match the buyer's specification
Get drawings, standards and finish requirements; make samples.
- 04Test
Get ISO 4210 or CPSC tests done on samples at an accepted lab.
- 05Produce and pack
Inline quality checks, 85% assembled or CKD packing, ISPM 15 pallets.
- 06Ship and claim benefits
File the shipping bill on ICEGATE with the correct 8-digit HS code, declare RoDTEP and drawback, and keep the mill or test certificates with the export file.
- 07Get paid safely
Use an LC or documents against payment with new buyers, take ECGC cover for open-account sales, and close the export with an e-BRC once the money arrives.
Meet buyers
Trade fairs
Questions
Questions about exporting bicycles and parts
Which council covers bicycles?
Should I ship complete bikes or kits?
What is the RoDTEP on a bicycle?
Do e-bikes count as bicycles?
What causes claims?
Sources (8)
- EEPC India (Engineering Export Promotion Council) — official site
- DGFT — Appendix 2T: Export Promotion Councils and the products under each
- eCFR — 16 CFR Part 1512, Requirements for bicycles (US CPSC)
- EUR-Lex — General Product Safety Regulation (EU) 2023/988, summary
- European Commission — Machinery (Directive 2006/42/EC and Regulation (EU) 2023/1230)
- DGFT — Appendix 4R, RoDTEP schedule for DTA exports w.e.f. 10.10.2024 (Notification 32/2024-25); rates continued to 31.12.2026 by Notification 41/2026-27
- Gazette of India — Notification 77/2023-Customs (N.T.) dated 20.10.2023: All Industry Rates of duty drawback
- Department of Commerce, Export Import Data Bank — India's exports of HS 8712 and 8714 by country, 2025-26
Who buys Indian bicycles and parts
All countries → USDWashington, D.C.United States of AmericaIndia's largest single-country export market. Strict FDA rules for food; extra 10% US duty on most goods since July 2026.From India 2025-26US$ 87.3 bn
 CETAGBPLondonUnited KingdomNew CETA in force since July 2026 — most Indian goods now enter duty-free. Strong market for garments, food and engineering.From India 2025-26US$ 13.4 bn
 EURAmsterdamNetherlandsEurope's main gateway: Rotterdam handles goods for the whole EU. EU food-safety and residue rules apply.From India 2025-26US$ 17.5 bn
 SAFTANPRKathmanduNepalOpen land border, rupee payments and a market that relies on Indian goods — an easy first market by road.From India 2025-26US$ 7.45 bn
 SAFTABDTDhakaBangladeshBig neighbour market for cotton, yarn, food and machinery. Mostly LC-based; land and sea routes.From India 2025-26US$ 10.6 bn
 ISFTALKRSri Jayawardenepura Kotte (Colombo is the commercial capital)Sri LankaClose island market with India's oldest FTA. Buys food, medicines, vehicles, yarn and building materials.From India 2025-26US$ 5.52 bn
 AITIGAIDRJakartaIndonesiaWorld's fourth most populous country. Buys Indian vehicles, steel, chemicals, groundnuts and meat; halal and BPOM rules for food.From India 2025-26US$ 4.49 bn
 EURBerlinGermanyEurope's largest economy and India's biggest EU partner. Values quality, certificates and supply-chain transparency.From India 2025-26US$ 11.5 bn
More in engineering goods
All products → Free to exportEngineering goodsAuto parts and componentsOEM and aftermarket vehicle parts; the USA, Germany and Italy buy most, with strong demand in Latin America.HS8708Exports 2025-26US$ 7.64 bn ↑1.8%
 Free to exportEngineering goodsIron and steel castingsGrey and ductile iron and steel castings from Kolhapur, Rajkot, Coimbatore and Howrah; the USA leads.HS7325Exports 2025-26US$ 1.25 bn ↑3.2%
 Free to exportEngineering goodsHand toolsHammers, wrenches, pliers and garden tools from Jalandhar and Ludhiana; the USA buys most.HS8205Exports 2025-26US$ 161 mn ↓7%
 Free to exportEngineering goodsPumpsAgricultural, domestic and industrial pumps from Coimbatore, Rajkot and Ahmedabad; the USA leads.HS8413Exports 2025-26US$ 1.6 bn ↑5.2%