


South-East Asia
Export to Philippines
Fast-growing market of over 100 million people. Buys Indian medicines, vehicles, rice and meat; strict FDA registration.
- Capital
- Manila
- Currency
- PHP
- Trade agreement with India
- ASEAN–India Trade in Goods Agreement (AITIGA) In force (India applied it from 1 January 2010; member dates vary)
- Main ports
- Manila (MICT and South Harbor), Batangas, Cebu
The Philippines is a large, English-speaking market. It buys Indian medicines, two-wheelers and vehicles, rice, buffalo meat, iron and steel and machinery. Food, medicines and cosmetics must be registered with the Philippine FDA, and farm products need import clearances from the Department of Agriculture’s bureaus.

The Philippines is an ASEAN member, so Indian goods on its tariff-reduction lists enter at a lower or zero duty when they carry an AITIGA certificate of origin (Form AI), issued online through DGFT’s certificate-of-origin platform. A review to upgrade AITIGA was still under negotiation in October 2026 (15th Joint Committee, Jakarta). Check the duty for your HS code before quoting a price.
What it buys from India
- Medicines and pharmaceutical products
- Two-wheelers, vehicles and auto parts
- Rice, buffalo meat and other food products
Import rules on their side
- Food, medicines and cosmetics need the importer’s FDA licence to operate and product registration before sale.
- Plant products need a sanitary and phytosanitary import clearance from the Bureau of Plant Industry before shipment; meat clearances come from the Bureau of Animal Industry.
- Products under mandatory Philippine standards (for example some steel, electrical goods and tyres) need a PS mark or Import Commodity Clearance from the Bureau of Philippine Standards.
Practical tips
- Business is done in English, which makes it easier for first-time Indian exporters. Distributors expect support on FDA registration.
- Rice and onion imports are managed by the government and can be paused or capped; check the current import policy with the buyer.
- Meet buyers at IFEX Philippines (food) in Manila; ask for an LC or advance for first orders.
Sources (7)
- Department of Commerce — ASEAN-India Trade in Goods Agreement
- ASEAN Secretariat — ASEAN-India Free Trade Area
- Food and Drug Administration Philippines
- Bureau of Plant Industry, Philippines
- Bureau of Customs, Philippines
- Bureau of Philippine Standards (DTI)
- Department of Commerce — TradeStat export-import data bank
Trade data
India’s exports to Philippines in numbers
From the Department of Commerce’s TradeStat (Indian financial years, April–March), the country’s imports from the world from UN Comtrade, and its basics from the World Bank.
- India’s exports here, 2025-26
- US$ 2.33 bn No. 38 of our 80 countries
- Change from 2024-25
- ↑ +7.9% US$ 2.16 bn → US$ 2.33 bn
- Share of all Indian exports
- 0.53%
- Its imports from the world
- —
What India sells here most
By HS chapter, 2025-26. Change is against 2024-25.
What is rising and what is falling
Chapters where India sells at least US$ 5 million. Change from 2024-25 to 2025-26.
↑ High demand
- HeadgearUS$ 1.8 mn → US$ 11.9 mn↑+570.1%
- VegetablesUS$ 5 mn → US$ 22 mn↑+337.2%
- MeatUS$ 115 mn → US$ 177 mn↑+54%
- Cereals (rice, wheat, maize)US$ 37.8 mn → US$ 57.1 mn↑+51.4%
- Instruments, medical devicesUS$ 25.1 mn → US$ 36.2 mn↑+44.3%
- Vehicles and partsUS$ 279 mn → US$ 401 mn↑+43.8%
- Explosives, matchesUS$ 9.4 mn → US$ 12.8 mn↑+37%
- Iron and steelUS$ 22.2 mn → US$ 29.9 mn↑+34.4%
↓ Low demand
- Arms and ammunitionUS$ 95.5 mn → US$ 53.2 mn↓-44.3%
- Fuels and petroleum productsUS$ 112 mn → US$ 79.1 mn↓-29.7%
- Oilseeds and seedsUS$ 78.9 mn → US$ 58 mn↓-26.4%
- Paper and paperboardUS$ 18.3 mn → US$ 14.7 mn↓-19.3%
- CottonUS$ 26.2 mn → US$ 21.4 mn↓-18.3%
- Electrical and electronicsUS$ 103 mn → US$ 84.5 mn↓-17.9%
- Inorganic chemicalsUS$ 31.8 mn → US$ 26.1 mn↓-17.9%
- Iron and steel articlesUS$ 30.3 mn → US$ 26.7 mn↓-11.9%
Our product guides that sell here
India’s exports of each product to this country, 2025-26.
The 20 biggest export lines
4-digit HS lines, 2025-26, with their Harmonized System descriptions.
What India buys from Philippines
India’s imports from this country in 2025-26 by HS chapter, from TradeStat — this country can be your supplier too.
- India’s imports, 2025-26
- US$ 1.57 bn US$ 1.18 bn → US$ 1.57 bn
- India’s exports, 2025-26
- US$ 2.33 bn
- Trade balance
- +US$ 764 mn exports minus imports
- Change in imports
- +33.1%
The country at a glance
- Population
- 117 mn 2025
- GDP
- US$ 487.1 bn 2025
- GDP per person
- US$ 4,171 2025
- Imports (goods and services)
- US$ 196 bn 2025
Sources: TradeStat — Export Import Data Bank, Department of Commerce · World Bank — World Development Indicators · Figures taken 29 October 2026.
What to send to Philippines
All products →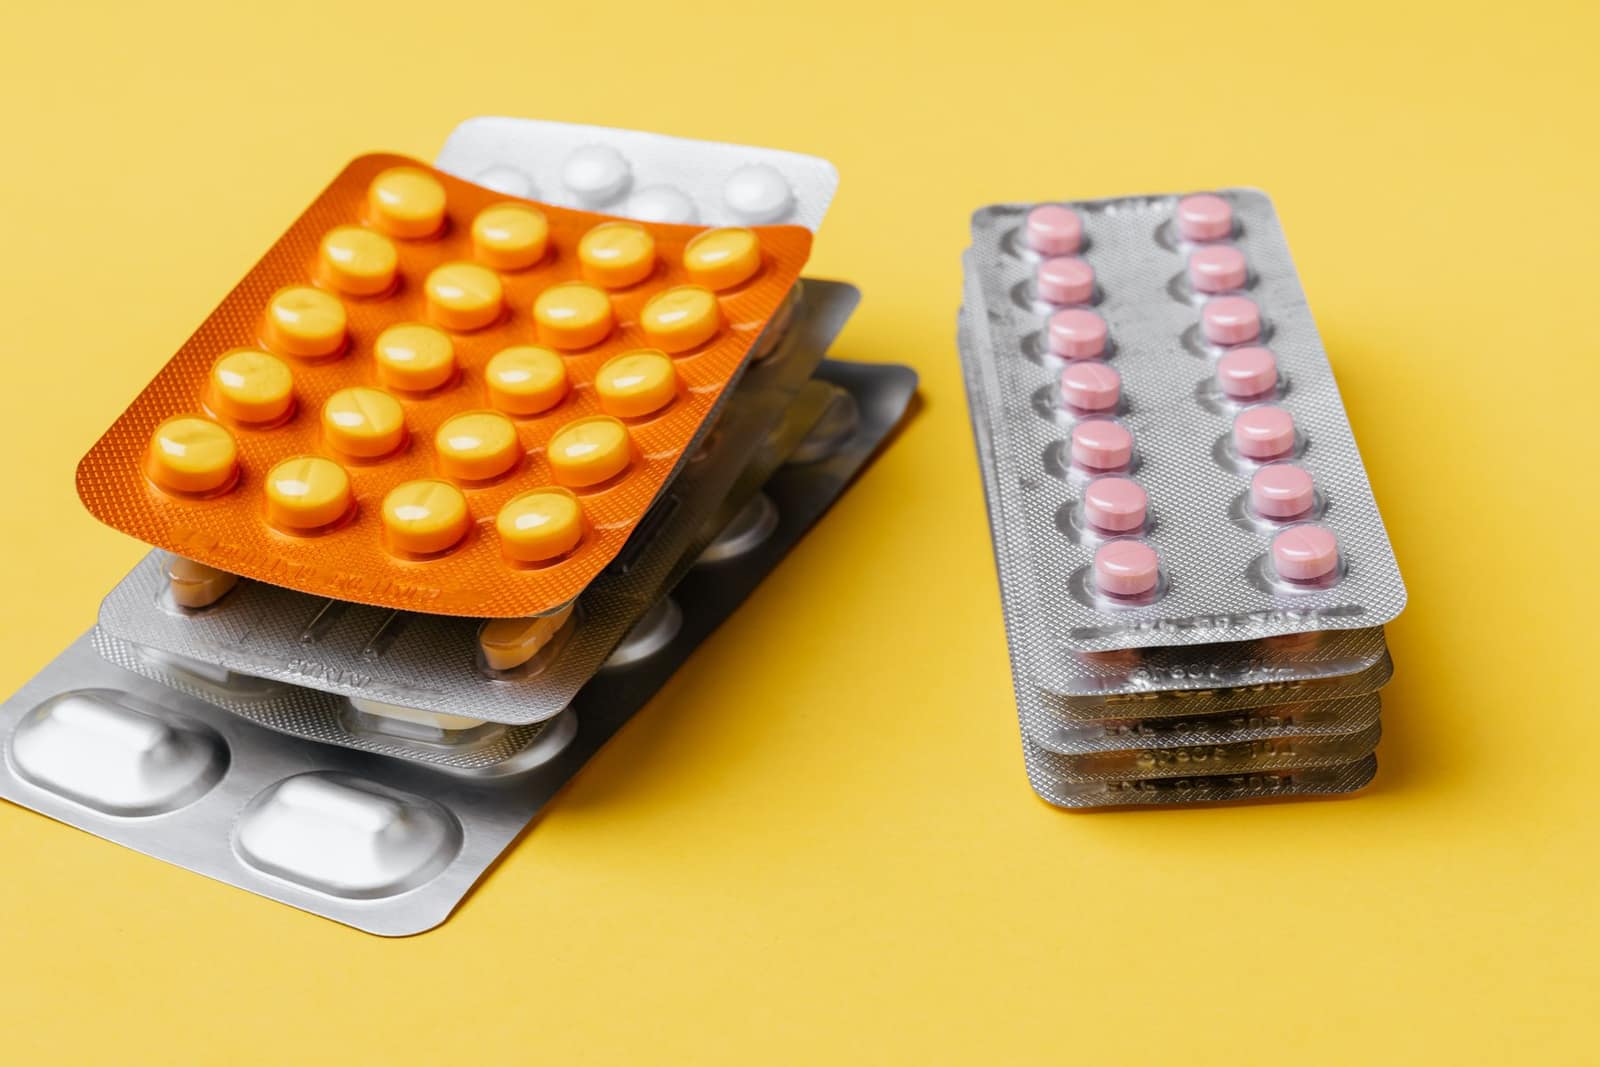 Free to exportPharma & chemicalsGeneric medicines (formulations)Tablets, capsules and injectables; every market needs product registration. The USA buys the most.HS3004Exports 2025-26US$ 21.9 bn ↓0.7%
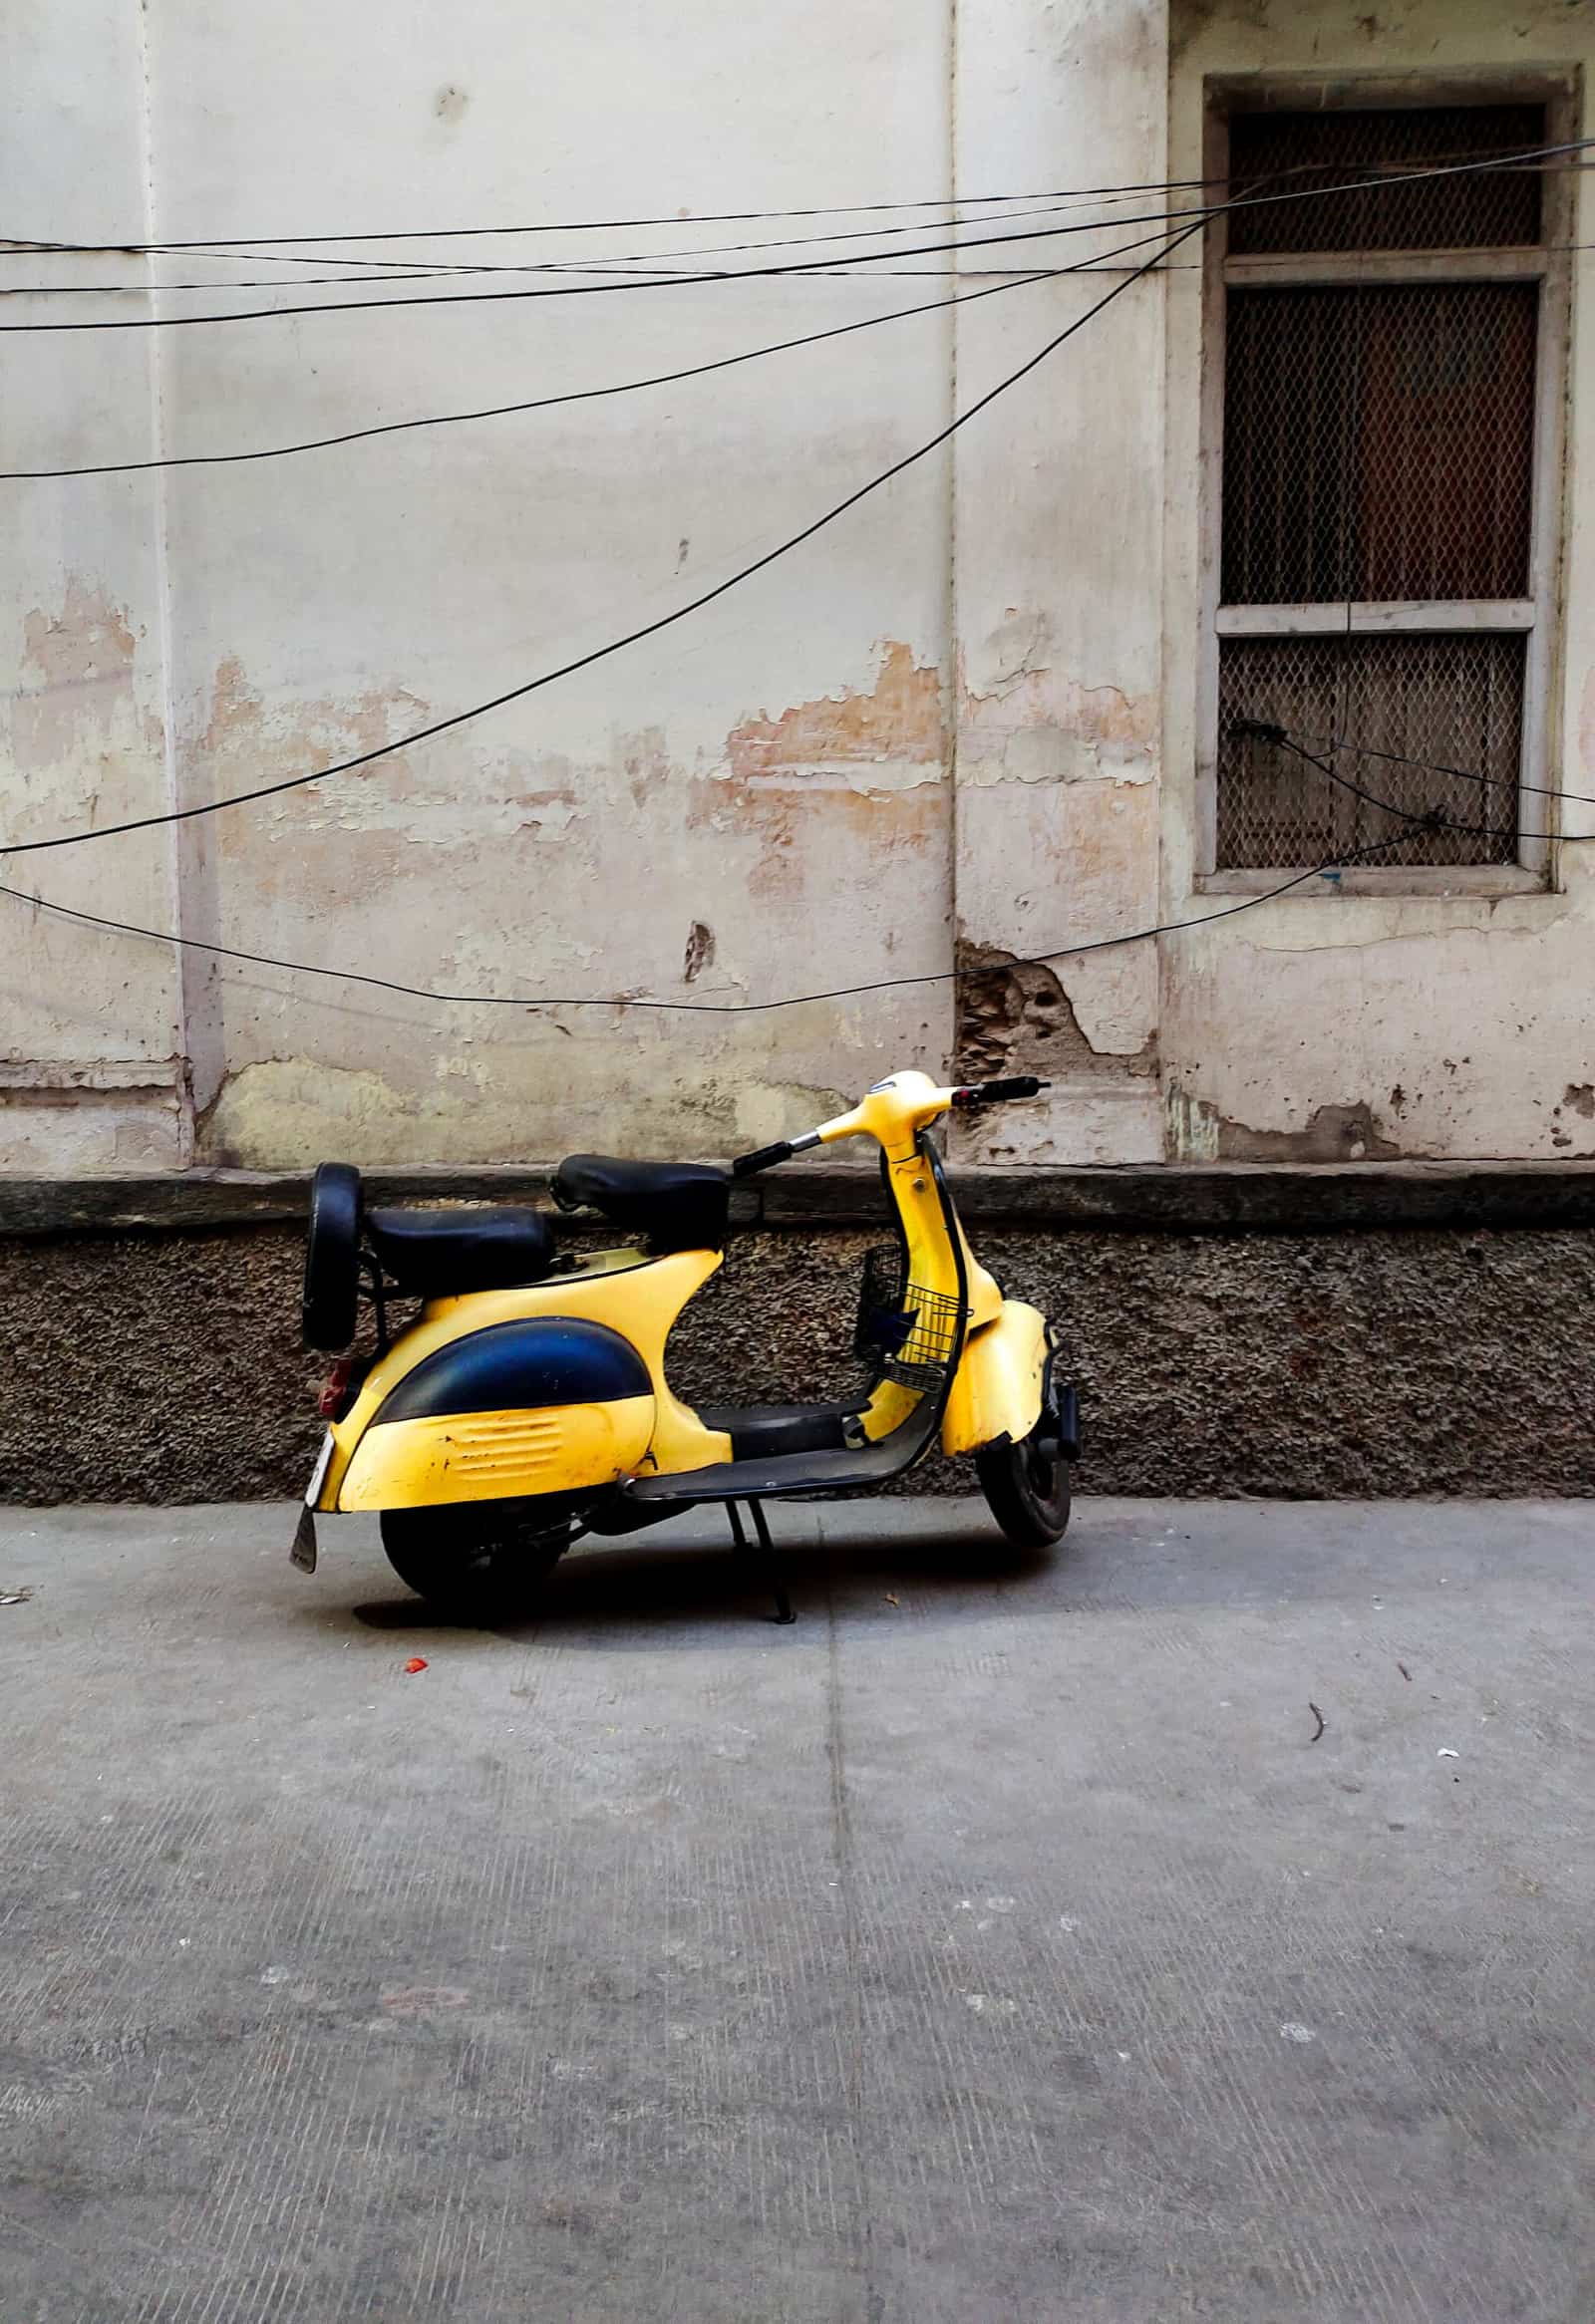 Free to exportEngineering goodsMotorcycles and scootersCommuter motorcycles and scooters for Latin America, Africa and South Asia; India is a top exporter.HS8711Exports 2025-26US$ 3.98 bn ↑24.2%
 Free to exportEngineering goodsAuto parts and componentsOEM and aftermarket vehicle parts; the USA, Germany and Italy buy most, with strong demand in Latin America.HS8708Exports 2025-26US$ 7.64 bn ↑1.8%
 Free, with conditionsFarm produceNon-basmati riceHigh-volume staple sold mainly to Africa and Bangladesh. Export reopened in 2024–25, but contracts must now be registered with APEDA.HS1006.30Exports 2025-26US$ 5.86 bn ↓10.2%
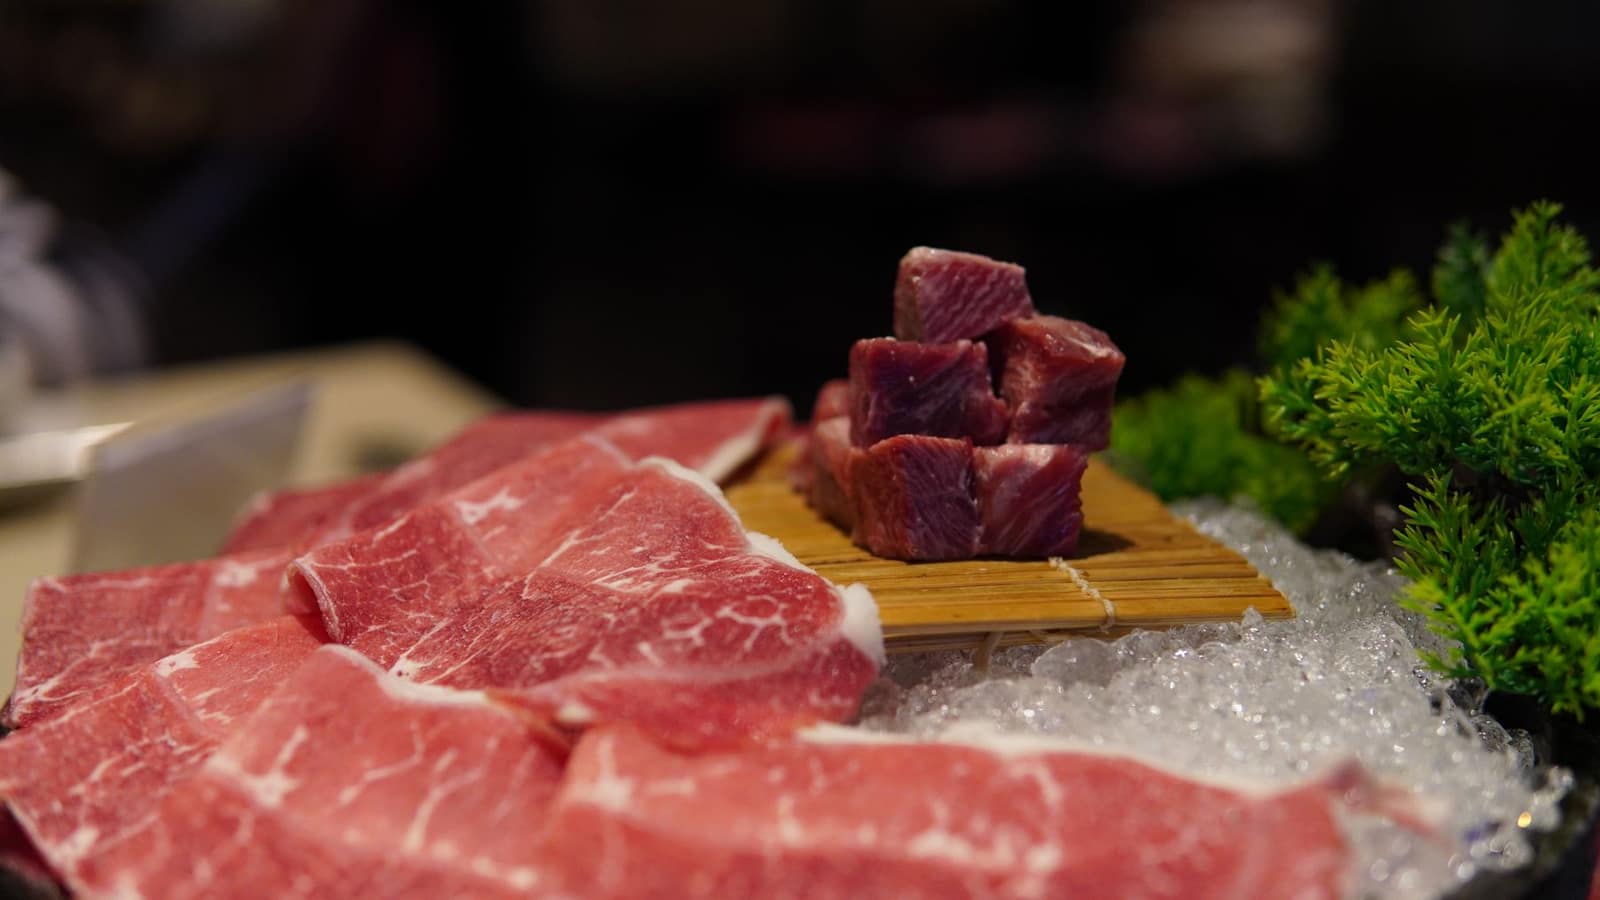 Free, with conditionsProcessed foodBuffalo meat (frozen)India is the world’s largest buffalo meat exporter. Only APEDA-registered plants, halal under i-CAS, and strict veterinary rules.HS0202Exports 2025-26US$ 4.61 bn ↑25.7%
 Free to exportFarm produceFresh onionBig-volume fresh export to Asia and the Gulf. Policy swings with domestic prices — check DGFT and CBIC before every season.HS0703.10Exports 2025-26US$ 430 mn ↓8.3%
 Free to exportFarm produceSpicesWhole, ground and blended spices. Spices Board registration (CRES) is compulsory; residue and ethylene oxide tests keep buyers.HS0904–0910Exports 2025-26US$ 3.12 bn ↓5.1%
 Free to exportEngineering goodsSteel pipes and tubesSeamless, line pipe and welded steel pipes; the USA, the Gulf and Canada are the main buyers.HS7304Exports 2025-26US$ 2.32 bn ↑7.2%
More in South-East Asia
 CECASGDSingaporeSingaporeDuty-free trading hub for South-East Asia. Strict food licensing by SFA; big Indian community.From India 2025-26US$ 11.9 bn
 CECAMYRKuala LumpurMalaysiaMulti-ethnic market with a large Indian-origin community. Halal expectations for food; CECA and AITIGA both apply.From India 2025-26US$ 6.83 bn
 AITIGAVNDHanoiVietnamFast-growing manufacturing economy buying raw materials, yarn, steel, chemicals and feed ingredients from India.From India 2025-26US$ 6.67 bn
 AITIGAIDRJakartaIndonesiaWorld's fourth most populous country. Buys Indian vehicles, steel, chemicals, groundnuts and meat; halal and BPOM rules for food.From India 2025-26US$ 4.49 bn