

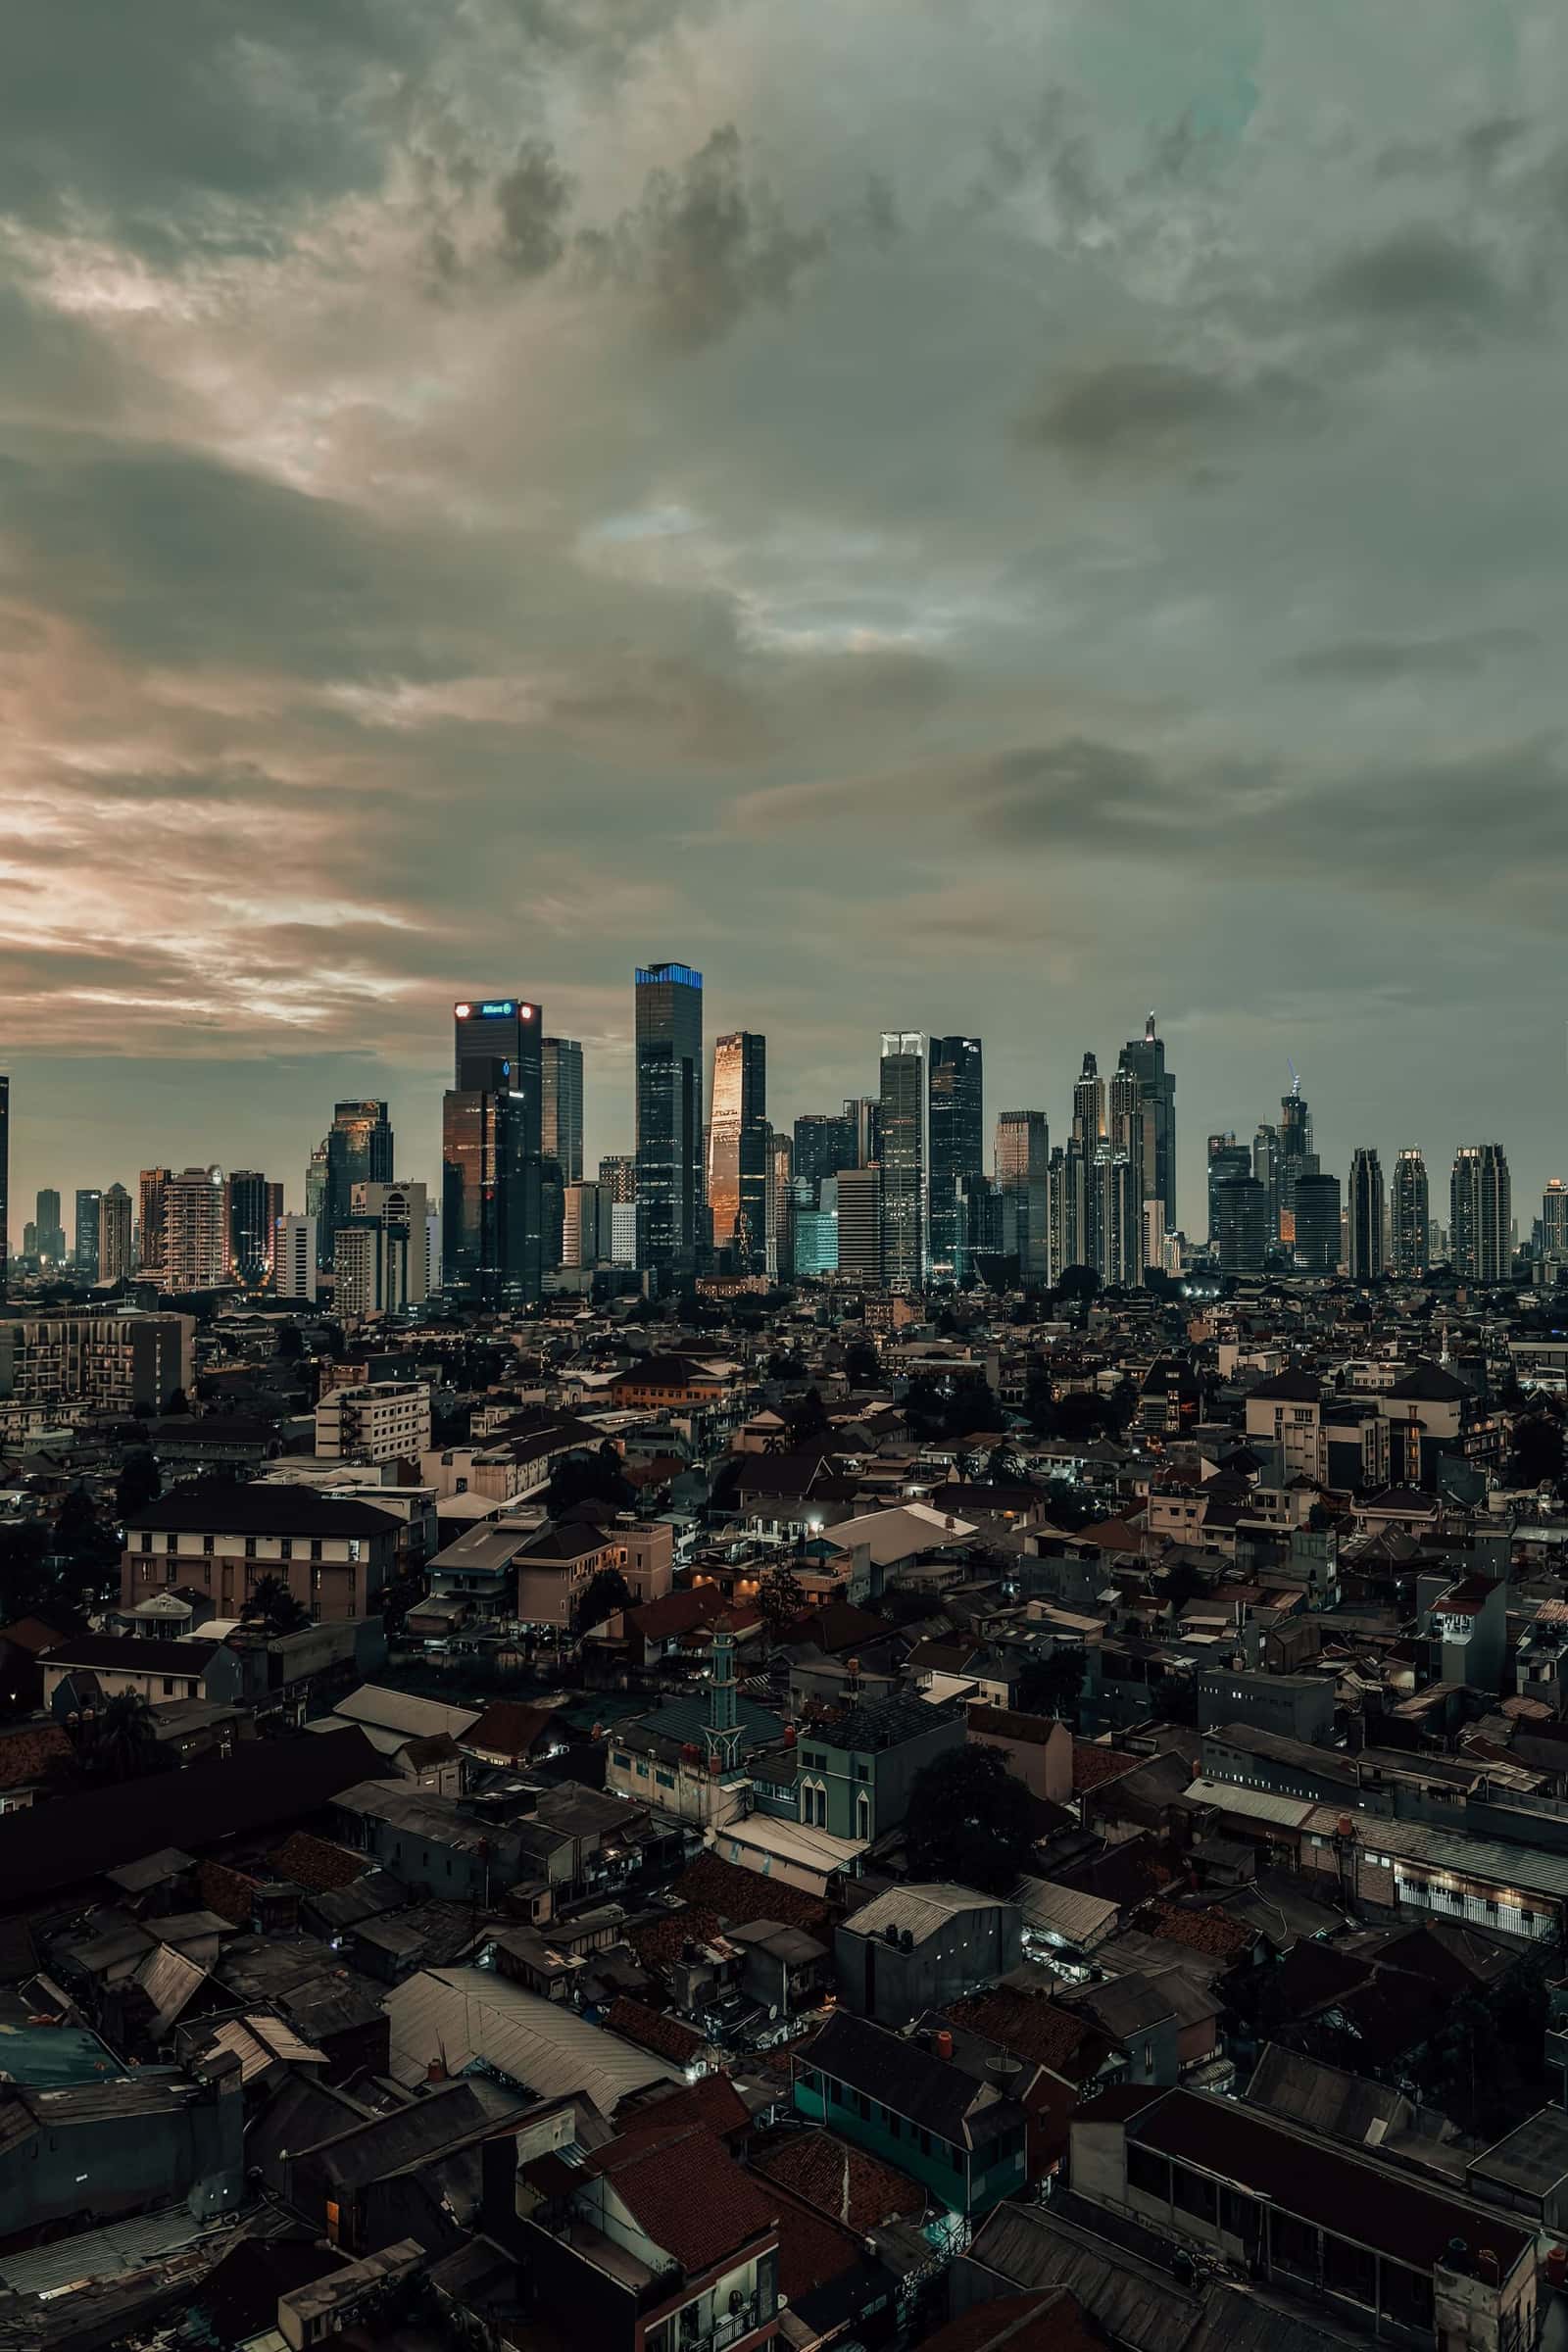
South-East Asia
Export to Indonesia
World's fourth most populous country. Buys Indian vehicles, steel, chemicals, groundnuts and meat; halal and BPOM rules for food.
- Capital
- Jakarta
- Currency
- IDR
- Trade agreement with India
- ASEAN–India Trade in Goods Agreement (AITIGA) 2010
- Main ports
- Tanjung Priok (Jakarta), Tanjung Perak (Surabaya), Belawan (Medan)
Indonesia has a huge domestic market and buys Indian vehicles and parts, steel, organic chemicals, groundnuts, cotton yarn and buffalo meat. Import rules are detailed: processed food needs registration with BPOM, and halal certification is being made compulsory in stages. Importers also need the right import licence for each product group.

Indonesia gives AITIGA rates to Indian goods with a Form AI certificate of origin. The agreement is under review; confirm current status on commerce.gov.in.
What it buys from India
- Vehicles, auto parts and machinery
- Steel, organic chemicals and petroleum products
- Groundnuts, buffalo meat, sugar and rice
- Cotton yarn and medicines
Import rules on their side
- Processed food sold in shops needs a BPOM registration number (ML number) obtained by the Indonesian importer, with labels in Bahasa Indonesia.
- Halal certification is being made compulsory in stages under Indonesia's halal law; foreign halal certificates must be from bodies recognised by Indonesia's halal agency (BPJPH).
- Some goods need the SNI national standard mark, and fresh plant products must come in through approved ports with a phytosanitary certificate.
Practical tips
- Confirm the buyer holds the import licence and quota for your product before you produce — some goods are under import quotas.
- Prefer LC payment with new buyers; check ECGC's buyer and country limits.
- Medan and Surabaya are good secondary markets with less competition than Jakarta.
Sources (6)
- PIB backgrounder — India's Trade Partnerships (27 Feb 2026)
- Department of Commerce — Annual Report 2024-25 (trade agreements chapter)
- BPOM — Indonesian Food and Drug Authority
- Directorate General of Customs and Excise, Indonesia
- WTO — Regional Trade Agreements database
- Department of Commerce — TradeStat export-import data bank
Trade data
India’s exports to Indonesia in numbers
From the Department of Commerce’s TradeStat (Indian financial years, April–March), the country’s imports from the world from UN Comtrade, and its basics from the World Bank.
- India’s exports here, 2025-26
- US$ 4.49 bn No. 23 of our 30 countries
- Change from 2024-25
- ↓ -16.5% US$ 5.38 bn → US$ 4.49 bn
- Share of all Indian exports
- 1.02%
- Its imports from the world
- US$ 235.1 bn 2024 · India’s share 2.43%
What India sells here most
By HS chapter, 2025-26. Change is against 2024-25.
What is rising and what is falling
Chapters where India sells at least US$ 5 million. Change from 2024-25 to 2025-26.
↑ High demand
- Salt, stone, cementUS$ 43.9 mn → US$ 101 mn↑+130.6%
- Animal feed and food residuesUS$ 16.1 mn → US$ 31.1 mn↑+93.3%
- Other food preparationsUS$ 16.5 mn → US$ 30.2 mn↑+82.7%
- LeadUS$ 15.8 mn → US$ 25.9 mn↑+64.3%
- AluminiumUS$ 31.9 mn → US$ 51 mn↑+60%
- Medicines and pharmaUS$ 86 mn → US$ 137 mn↑+59.7%
- Iron and steelUS$ 85.9 mn → US$ 133 mn↑+55.1%
- Dairy, eggs, honeyUS$ 23.7 mn → US$ 34.9 mn↑+47.3%
↓ Low demand
- Cereals (rice, wheat, maize)US$ 113 mn → US$ 27.2 mn↓-76%
- Fuels and petroleum productsUS$ 714 mn → US$ 253 mn↓-64.6%
- Ships and boatsUS$ 306 mn → US$ 154 mn↓-49.7%
- Ceramics and tilesUS$ 41.6 mn → US$ 24.9 mn↓-40.1%
- Oilseeds and seedsUS$ 304 mn → US$ 196 mn↓-35.5%
- Vehicles and partsUS$ 573 mn → US$ 424 mn↓-25.9%
- ZincUS$ 48.6 mn → US$ 36.6 mn↓-24.6%
- OresUS$ 44.3 mn → US$ 34.1 mn↓-22.9%
Opportunity: what this country buys from the world, and from India
The country’s own recorded imports in UN Comtrade, 2024. Chapters with the biggest gap between what it buys from the world and what it buys from India.
Our product guides that sell here
India’s exports of each product to this country, 2025-26.
The 20 biggest export lines
4-digit HS lines, 2025-26, with their Harmonized System descriptions.
What India buys from Indonesia
India’s imports from this country in 2025-26 by HS chapter, from TradeStat — this country can be your supplier too.
- India’s imports, 2025-26
- US$ 20.3 bn US$ 22.8 bn → US$ 20.3 bn
- India’s exports, 2025-26
- US$ 4.49 bn
- Trade balance
- −US$ 15.8 bn exports minus imports
- Change in imports
- -10.9%
The country at a glance
- Population
- 286 mn 2025
- GDP
- US$ 1,445.6 bn 2025
- GDP per person
- US$ 5,060 2025
- Imports (goods and services)
- US$ 297 bn 2025
Sources: TradeStat — Export Import Data Bank, Department of Commerce · UN Comtrade database (United Nations Statistics Division) · World Bank — World Development Indicators · Figures taken 29 October 2026.
What to send to Indonesia
All products → Free, with conditionsFarm produceGroundnut (peanut)Bold and Java kernels from Gujarat and Rajasthan, mainly to South-East Asia. APEDA registration and an aflatoxin certificate are compulsory.HS1202.42Exports 2025-26US$ 691 mn ↓13.1%
 Free, with conditionsFarm produceNon-basmati riceHigh-volume staple sold mainly to Africa and Bangladesh. Export reopened in 2024–25, but contracts must now be registered with APEDA.HS1006.30Exports 2025-26US$ 5.86 bn ↓10.2%
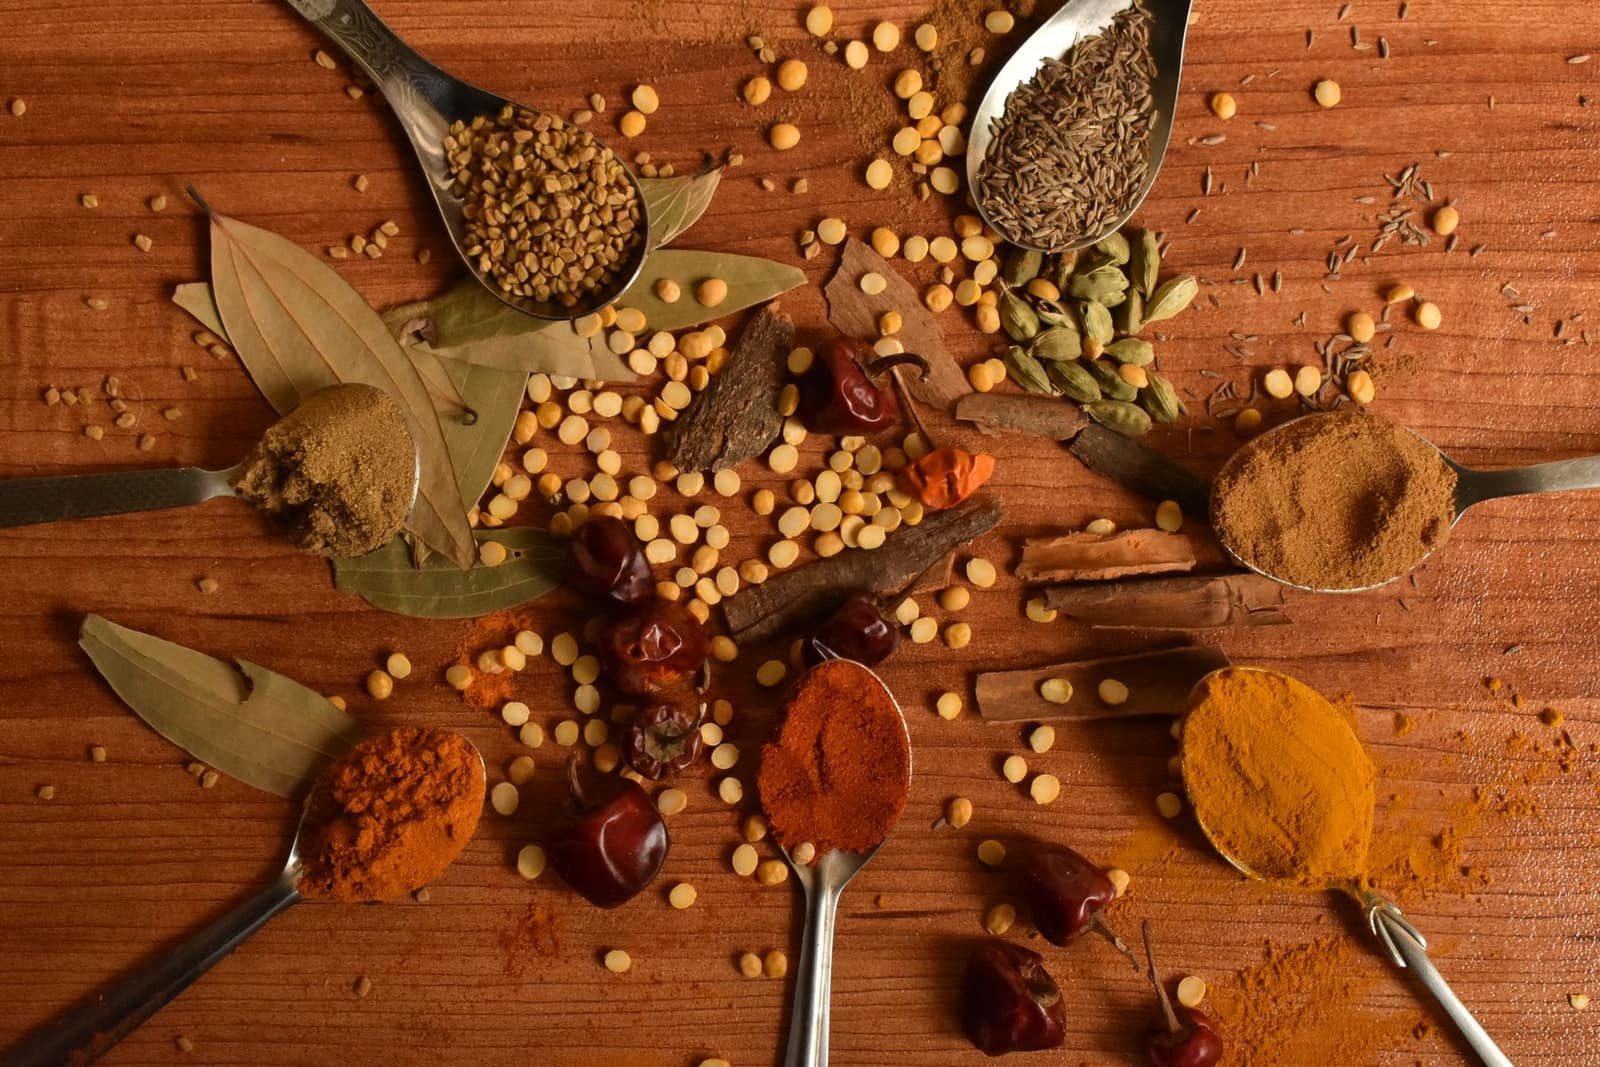 Free to exportFarm produceSpicesWhole, ground and blended spices. Spices Board registration (CRES) is compulsory; residue and ethylene oxide tests keep buyers.HS0904–0910Exports 2025-26US$ 3.12 bn ↓5.1%
 Free to exportTextiles & apparelCotton yarnBulk cotton yarn sold to weaving and knitting mills abroad; Bangladesh is by far the largest buyer.HS5205Exports 2025-26US$ 3.22 bn ↓4.1%
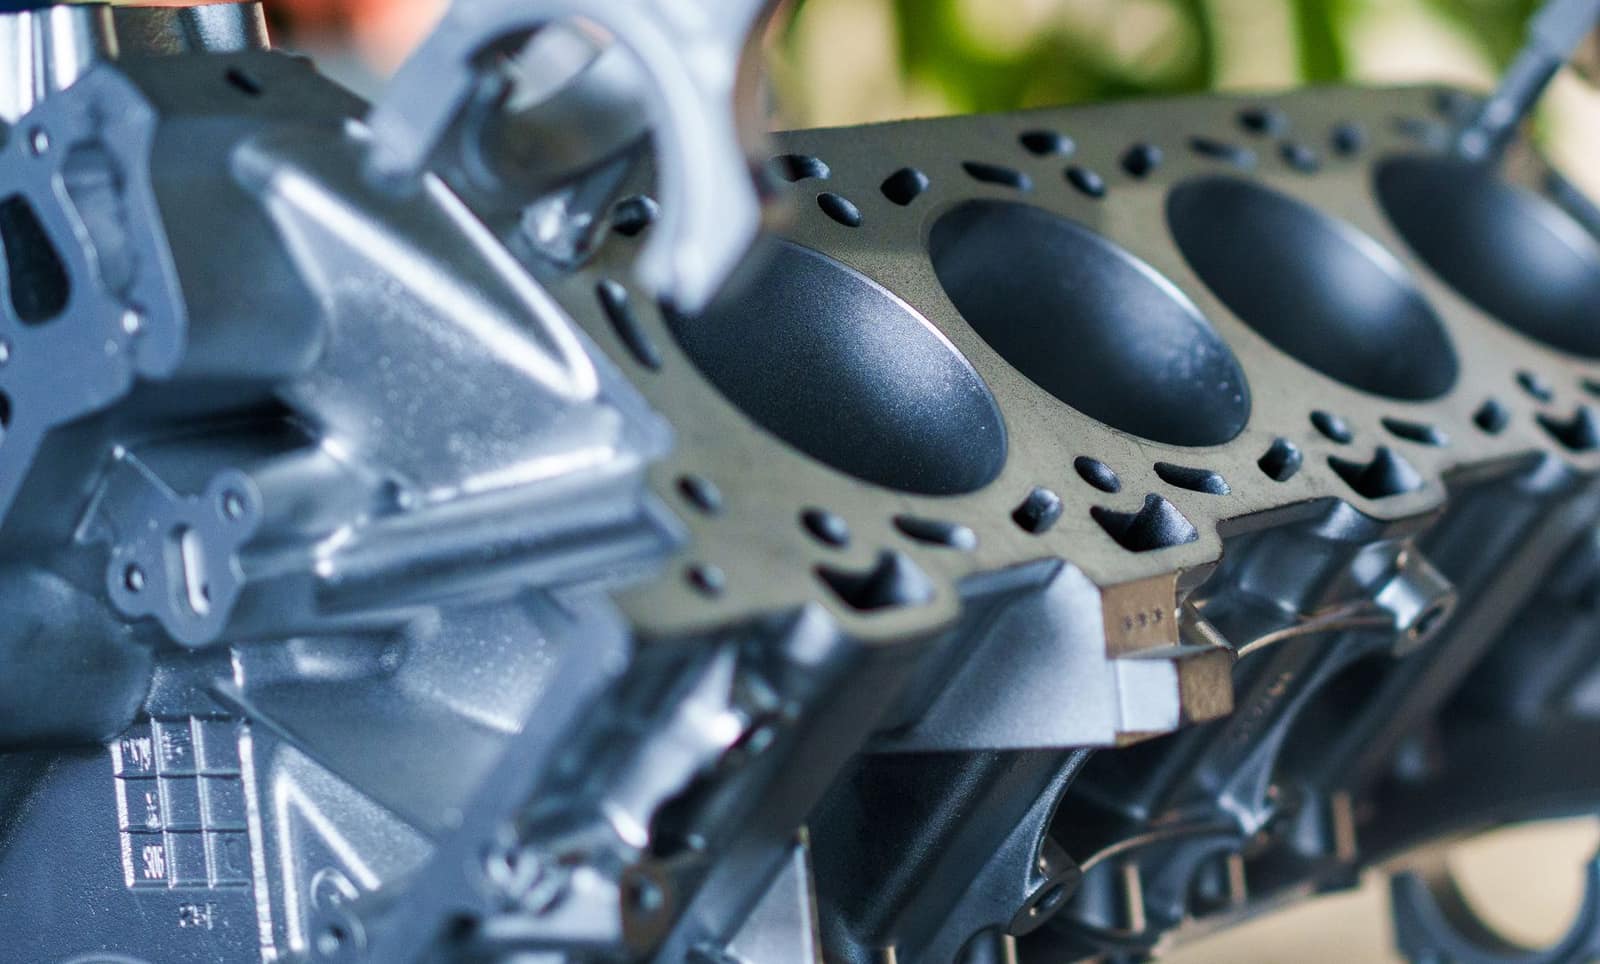 Free to exportEngineering goodsAuto parts and componentsOEM and aftermarket vehicle parts; the USA, Germany and Italy buy most, with strong demand in Latin America.HS8708Exports 2025-26US$ 7.64 bn ↑1.8%
 Free to exportPharma & chemicalsGeneric medicines (formulations)Tablets, capsules and injectables; every market needs product registration. The USA buys the most.HS3004Exports 2025-26US$ 21.9 bn ↓0.7%
 Free to exportFarm produceGuar gumRajasthan’s guar processed into gum for oil drilling, food and textiles. Industrial buyers set strict viscosity specs.HS1302.32Exports 2025-26US$ 393 mn ↓7.1%
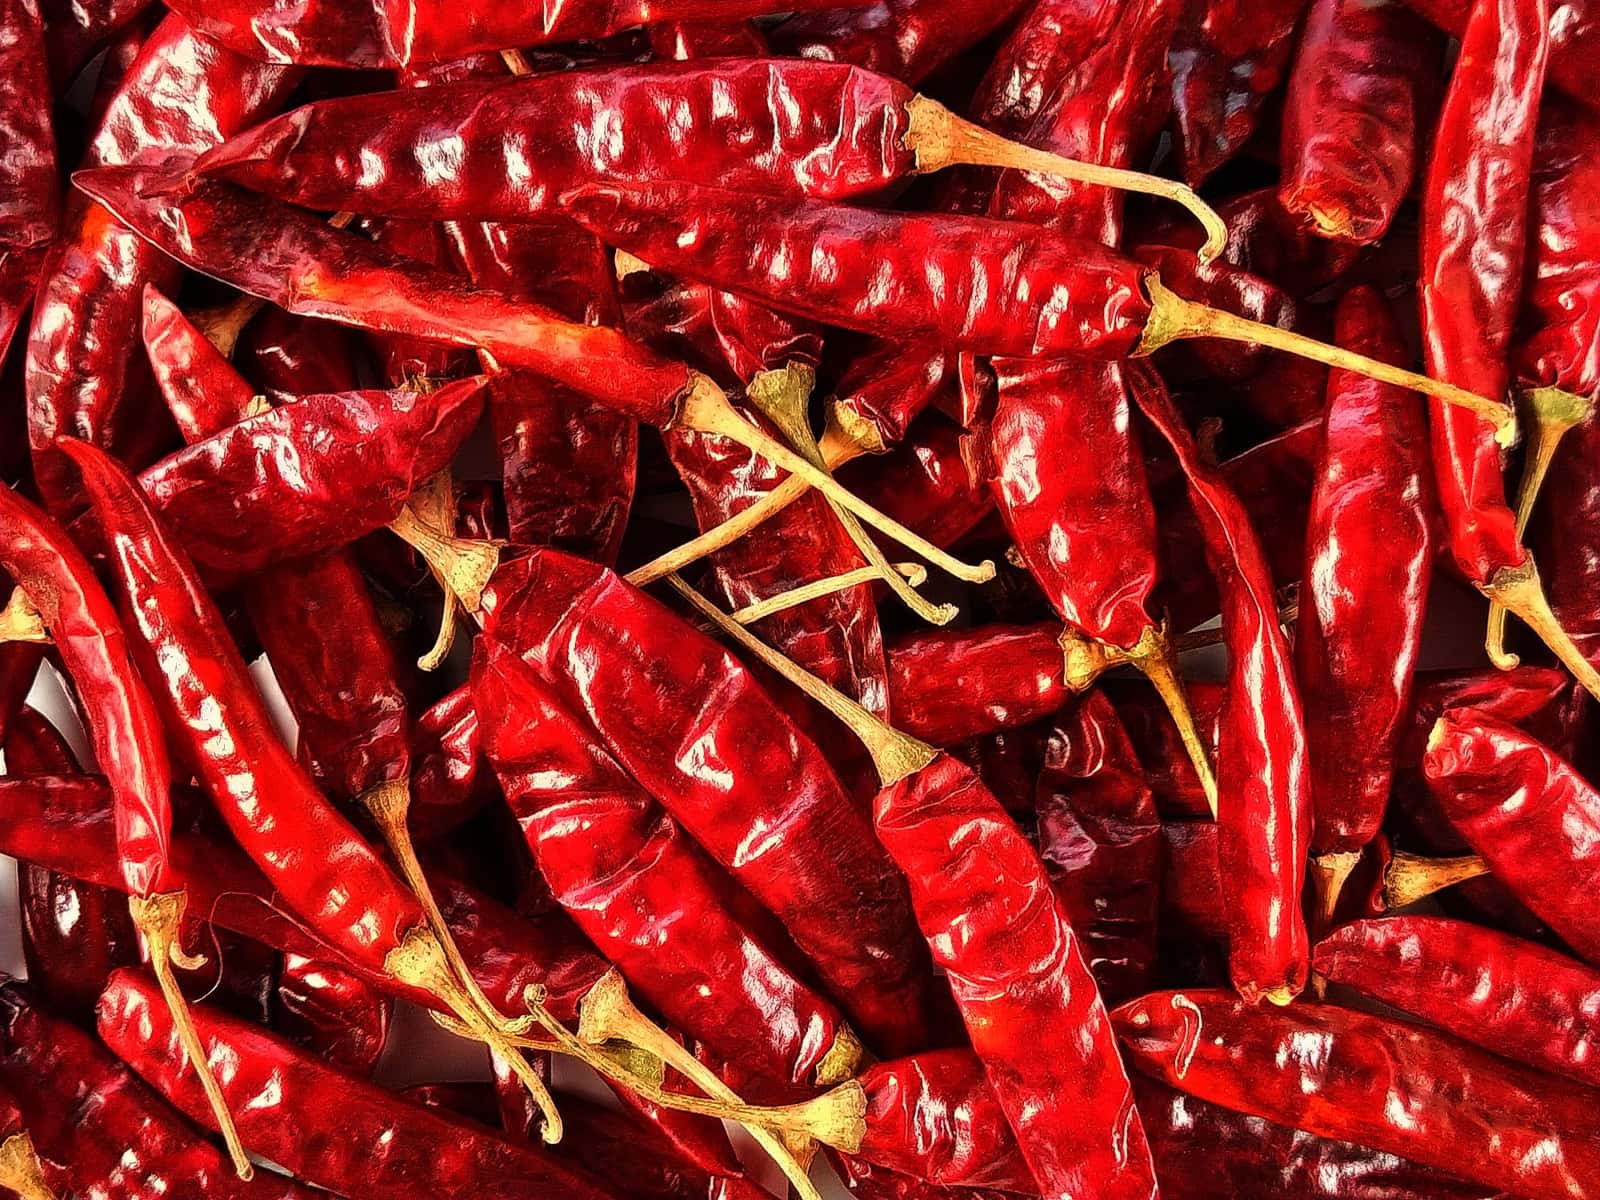 Free to exportFarm produceChilliIndia’s largest spice export by volume. Dried red chilli goes to China, Thailand and Bangladesh; aflatoxin is the key test.HS0904.21Exports 2025-26US$ 1.1 bn ↓12.9%
More in South-East Asia
 CECASGDSingaporeSingaporeDuty-free trading hub for South-East Asia. Strict food licensing by SFA; big Indian community.From India 2025-26US$ 11.9 bn
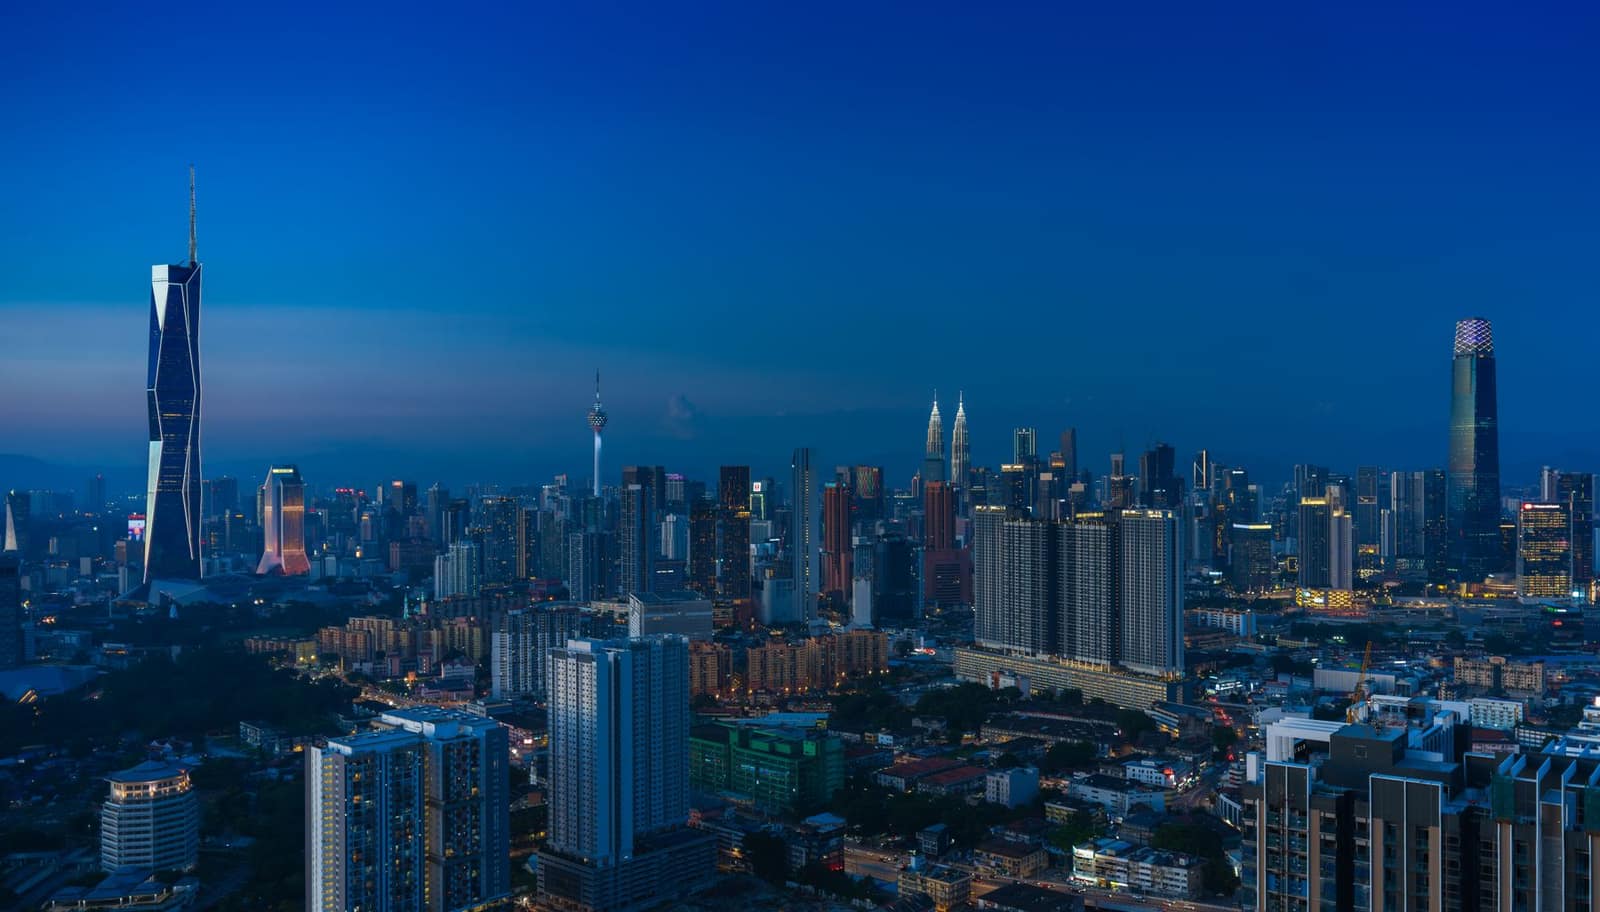 CECAMYRKuala LumpurMalaysiaMulti-ethnic market with a large Indian-origin community. Halal expectations for food; CECA and AITIGA both apply.From India 2025-26US$ 6.83 bn
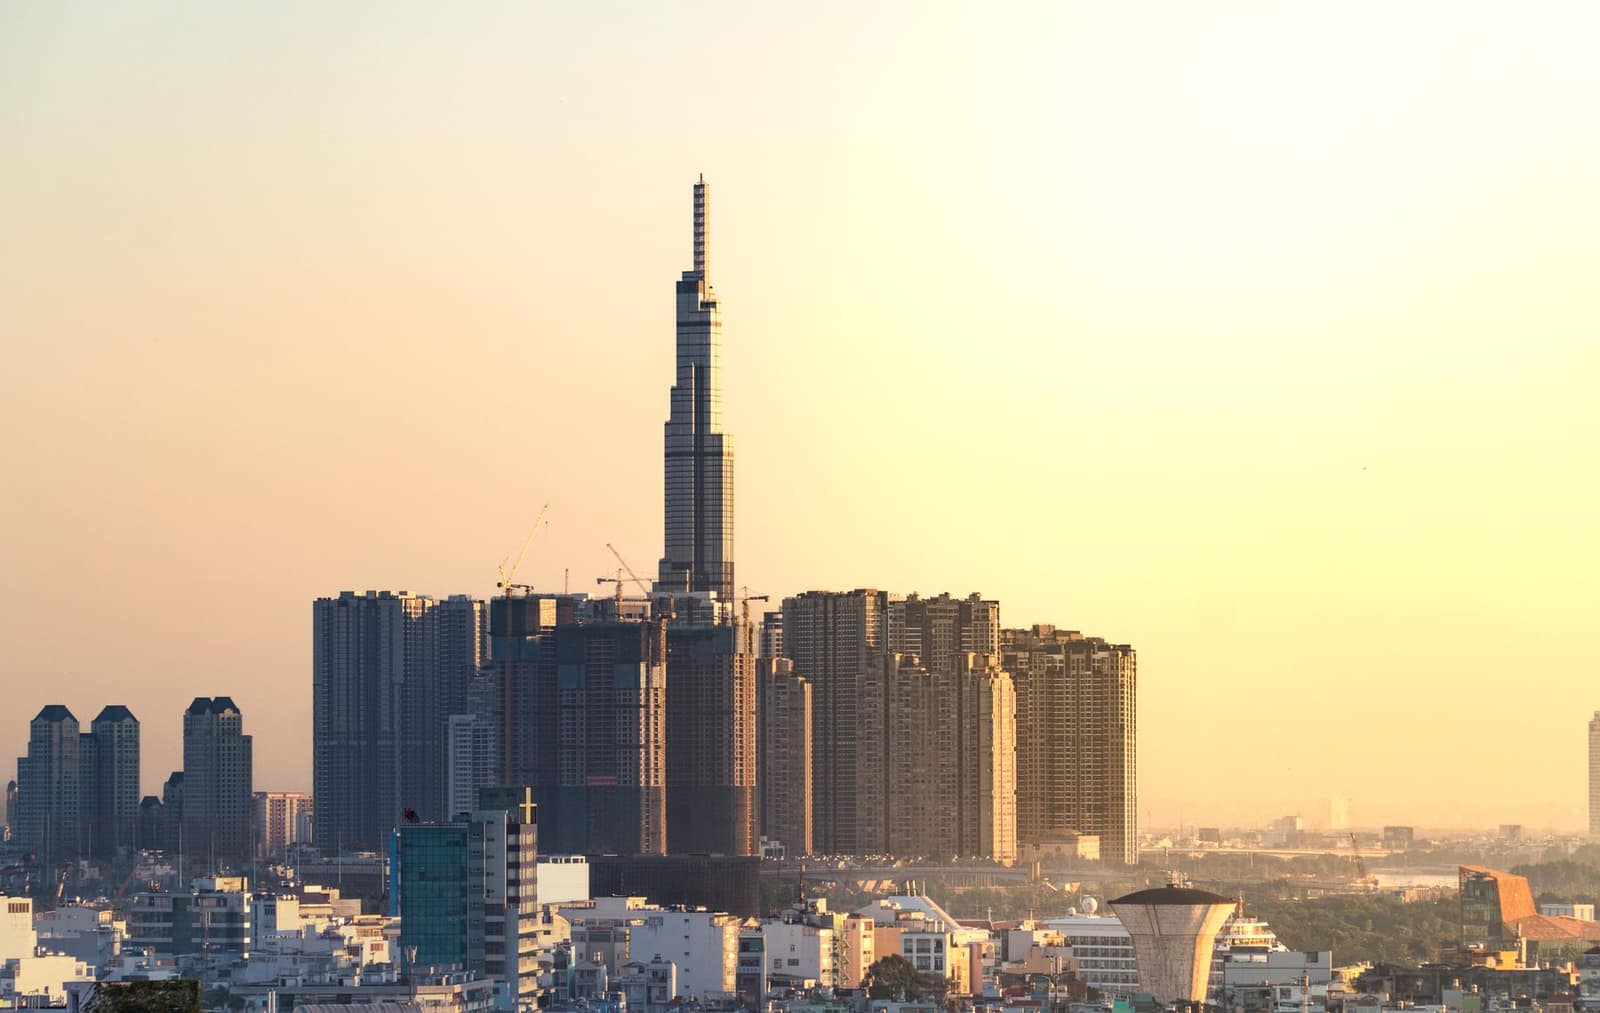 AITIGAVNDHanoiVietnamFast-growing manufacturing economy buying raw materials, yarn, steel, chemicals and feed ingredients from India.From India 2025-26US$ 6.67 bn