

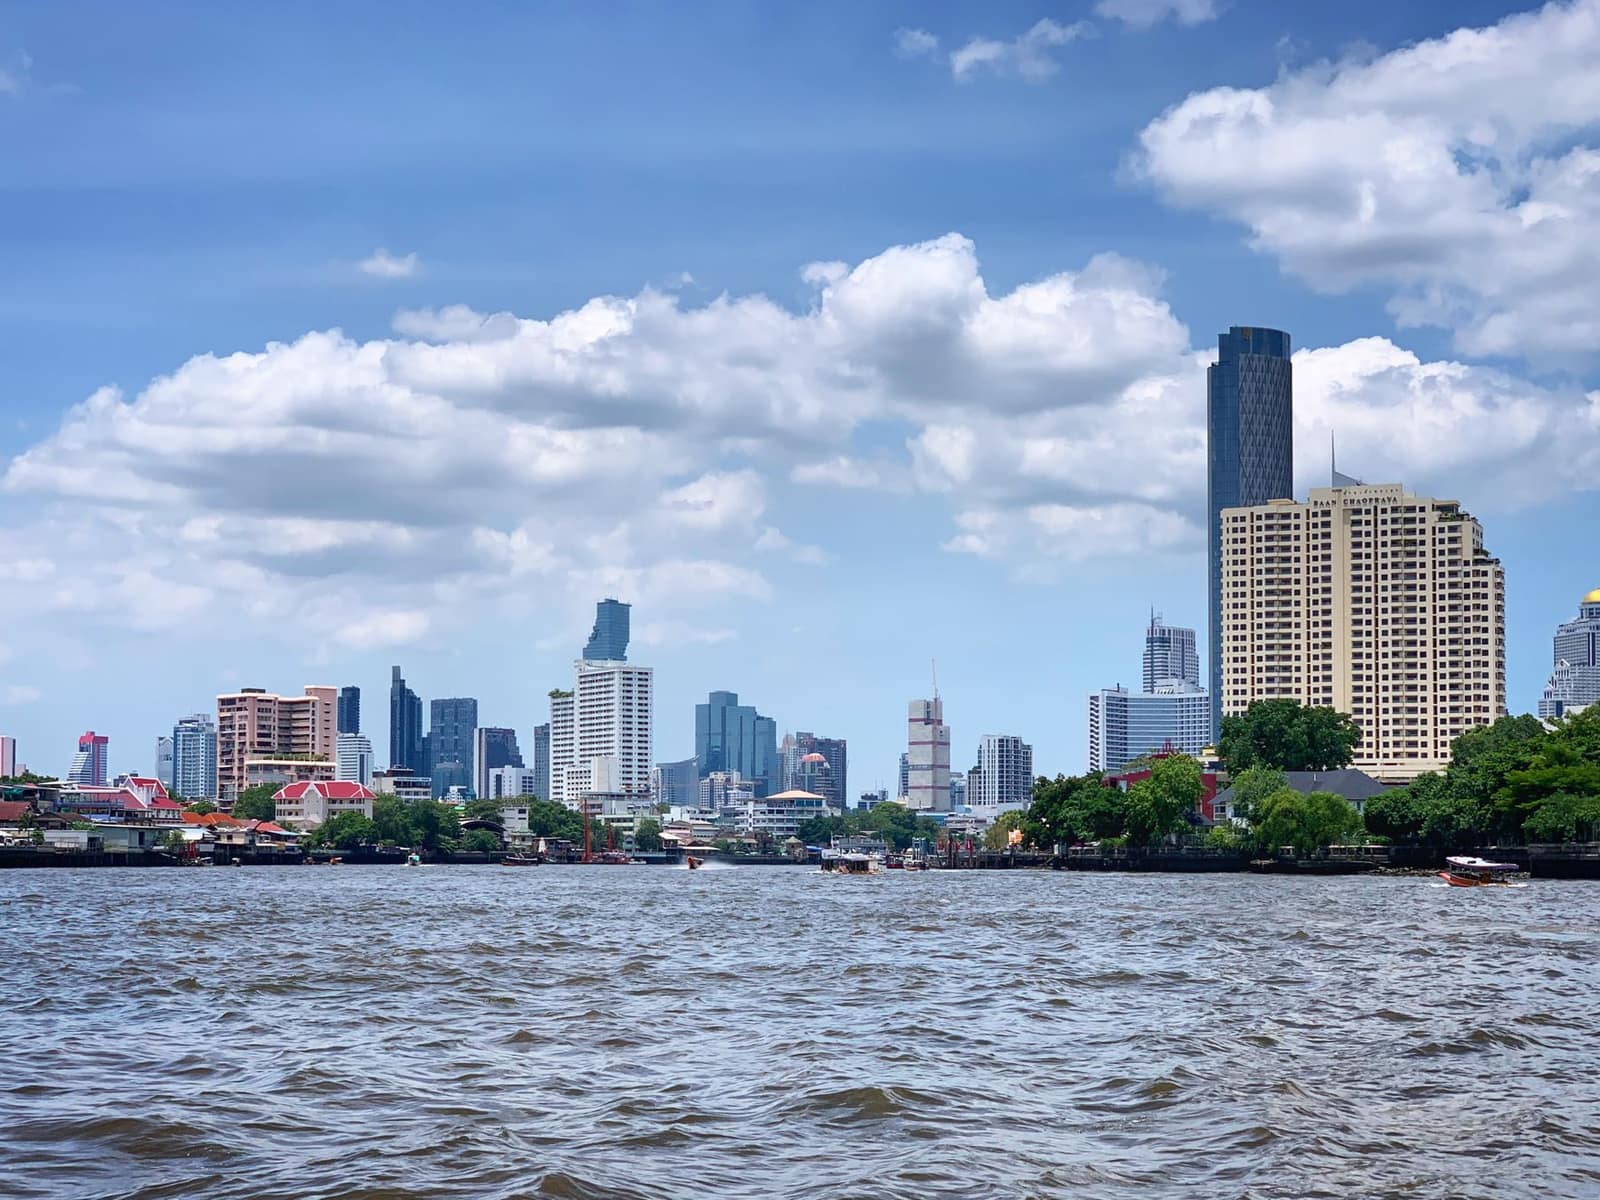
South-East Asia
Export to Thailand
Food-processing and auto hub of South-East Asia. Buys Indian marine products, chemicals, machinery and gems.
- Capital
- Bangkok
- Currency
- THB
- Trade agreement with India
- ASEAN–India Trade in Goods Agreement (AITIGA) In force (India applied it from 1 January 2010; member dates vary)
- Main ports
- Laem Chabang, Bangkok Port (Khlong Toei), Suvarnabhumi Airport (Bangkok)
Thailand buys Indian marine products, chemicals, machinery, auto parts, iron and steel, and gems and jewellery. Its large food-processing industry also imports Indian raw materials. Food needs licensing with the Thai FDA, and plant products need import permits from the Department of Agriculture.
Thailand is an ASEAN member, so Indian goods on its tariff-reduction lists enter at a lower or zero duty when they carry an AITIGA certificate of origin (Form AI), issued online through DGFT’s certificate-of-origin platform. India and Thailand also run an Early Harvest Scheme (in force since 2004) that removed duties on a list of 82 products. A review to upgrade AITIGA was still under negotiation in October 2026 (15th Joint Committee, Jakarta). Check the duty for your HS code before quoting a price.
What it buys from India
- Marine products (shrimp, fish and fishmeal)
- Chemicals, machinery, auto parts and iron and steel
- Gems, jewellery and spices
Import rules on their side
- Imported food needs a Thai FDA import licence held by the importer, and labels in Thai.
- Plants, seeds and many plant products need an import permit from the Department of Agriculture and a phytosanitary certificate.
- Products under mandatory Thai Industrial Standards (TISI) — some electrical goods, steel and building products — need a TISI licence before import.
Practical tips
- THAIFEX – Anuga Asia in Bangkok is the region’s main food fair and a good place to meet importers.
- Check whether your product is on the Early Harvest list or AITIGA schedule; the duty difference can decide the deal.
- Thai buyers value relationships and polite, patient negotiation; LC and D/P are both common.
Sources (8)
- Department of Commerce — ASEAN-India Trade in Goods Agreement
- ASEAN Secretariat — ASEAN-India Free Trade Area
- Thai Food and Drug Administration
- Department of Agriculture, Thailand (plant quarantine)
- Thai Customs Department
- Thai Industrial Standards Institute (TISI)
- THAIFEX – Anuga Asia
- Department of Commerce — TradeStat export-import data bank
Trade data
India’s exports to Thailand in numbers
From the Department of Commerce’s TradeStat (Indian financial years, April–March), the country’s imports from the world from UN Comtrade, and its basics from the World Bank.
- India’s exports here, 2025-26
- US$ 5.06 bn No. 26 of our 80 countries
- Change from 2024-25
- ↑ +5.1% US$ 4.81 bn → US$ 5.06 bn
- Share of all Indian exports
- 1.15%
- Its imports from the world
- —
What India sells here most
By HS chapter, 2025-26. Change is against 2024-25.
What is rising and what is falling
Chapters where India sells at least US$ 5 million. Change from 2024-25 to 2025-26.
↑ High demand
- Ships and boatsUS$ 14 mn → US$ 49 mn↑+249.3%
- CopperUS$ 31.2 mn → US$ 50.1 mn↑+60.6%
- TobaccoUS$ 21.4 mn → US$ 33.6 mn↑+56.7%
- Fats and oilsUS$ 33.4 mn → US$ 49.4 mn↑+47.8%
- Gems, jewellery, precious metalsUS$ 527 mn → US$ 684 mn↑+29.8%
- Electrical and electronicsUS$ 200 mn → US$ 245 mn↑+22.9%
- ZincUS$ 107 mn → US$ 131 mn↑+21.9%
- Salt, stone, cementUS$ 23.5 mn → US$ 27.9 mn↑+19.1%
↓ Low demand
- Animal feed and food residuesUS$ 103 mn → US$ 64.3 mn↓-37.9%
- CottonUS$ 88.6 mn → US$ 67.4 mn↓-23.9%
- Oilseeds and seedsUS$ 77.8 mn → US$ 67.2 mn↓-13.7%
- Paper and paperboardUS$ 39.4 mn → US$ 34.1 mn↓-13.3%
- PlasticsUS$ 102 mn → US$ 90.5 mn↓-11.3%
Our product guides that sell here
India’s exports of each product to this country, 2025-26.
The 20 biggest export lines
4-digit HS lines, 2025-26, with their Harmonized System descriptions.
What India buys from Thailand
India’s imports from this country in 2025-26 by HS chapter, from TradeStat — this country can be your supplier too.
- India’s imports, 2025-26
- US$ 16.4 bn US$ 14.3 bn → US$ 16.4 bn
- India’s exports, 2025-26
- US$ 5.06 bn
- Trade balance
- −US$ 11.4 bn exports minus imports
- Change in imports
- +15.1%
The country at a glance
- Population
- 71.6 mn 2025
- GDP
- US$ 577 bn 2025
- GDP per person
- US$ 8,057 2025
- Imports (goods and services)
- US$ 388.1 bn 2025
Sources: TradeStat — Export Import Data Bank, Department of Commerce · World Bank — World Development Indicators · Figures taken 29 October 2026.
What to send to Thailand
All products →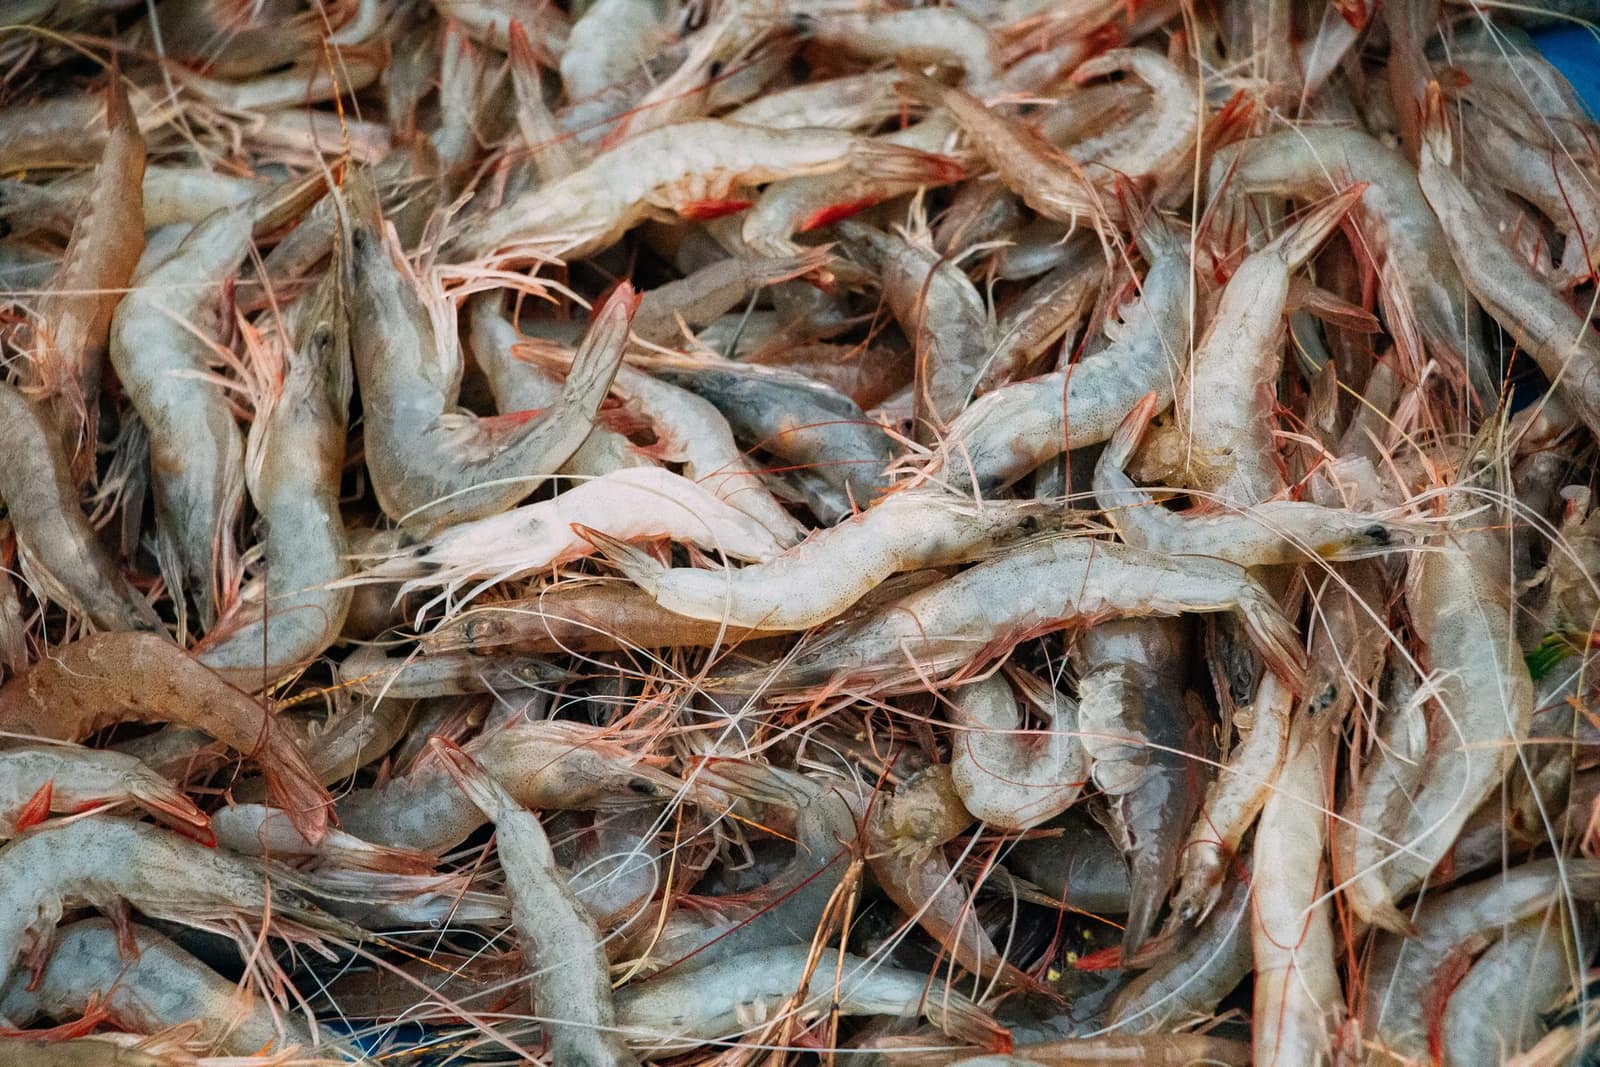 Free to exportMarineFrozen shrimpIndia’s top seafood export. Needs MPEDA registration and an EIC-approved plant; residue testing and US trade measures shape the business.HS0306.17Exports 2025-26US$ 5.61 bn ↑9.1%
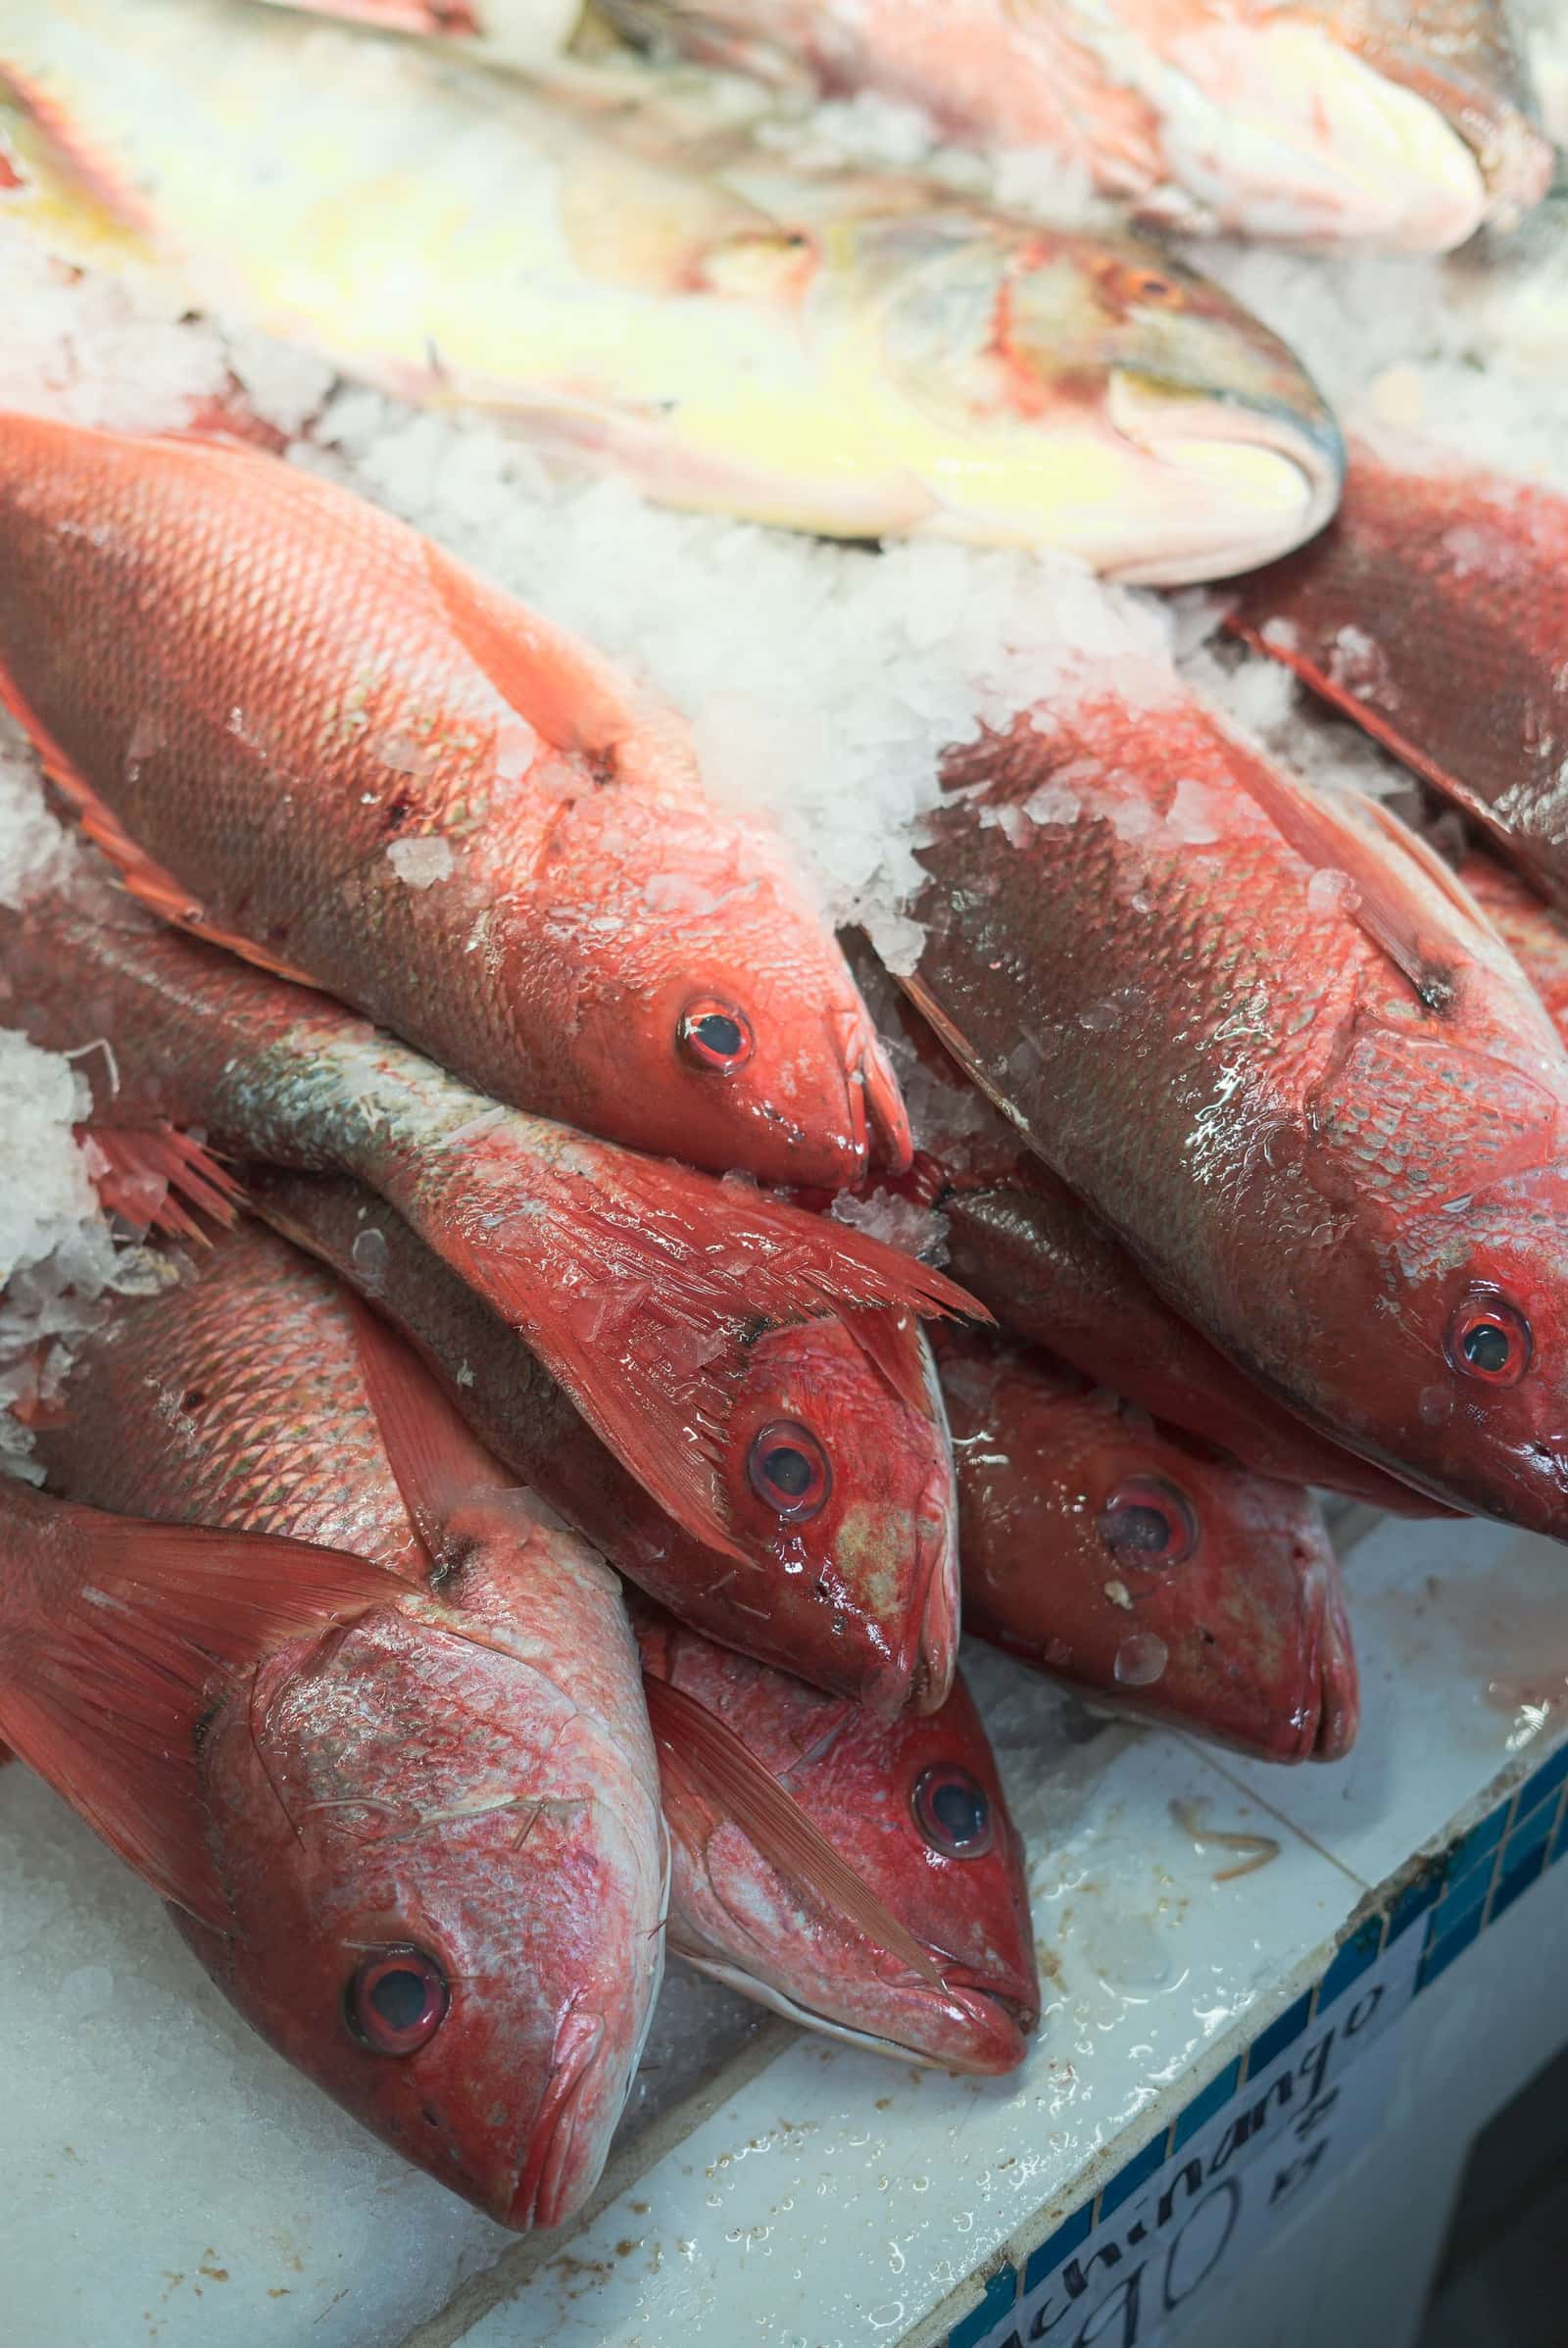 Free to exportMarineFrozen fishIndia’s second-largest seafood export. MPEDA registration, an EIC-approved plant and a health certificate are the gate.HS0303Exports 2025-26US$ 917 mn ↑8.9%
 Free, with conditionsMarineSquid, cuttlefish and octopusFrozen squid, cuttlefish and octopus from the west and south coasts. Needs MPEDA registration, an EIC plant and an EU catch certificate.HS0307Exports 2025-26US$ 930 mn ↑30.3%
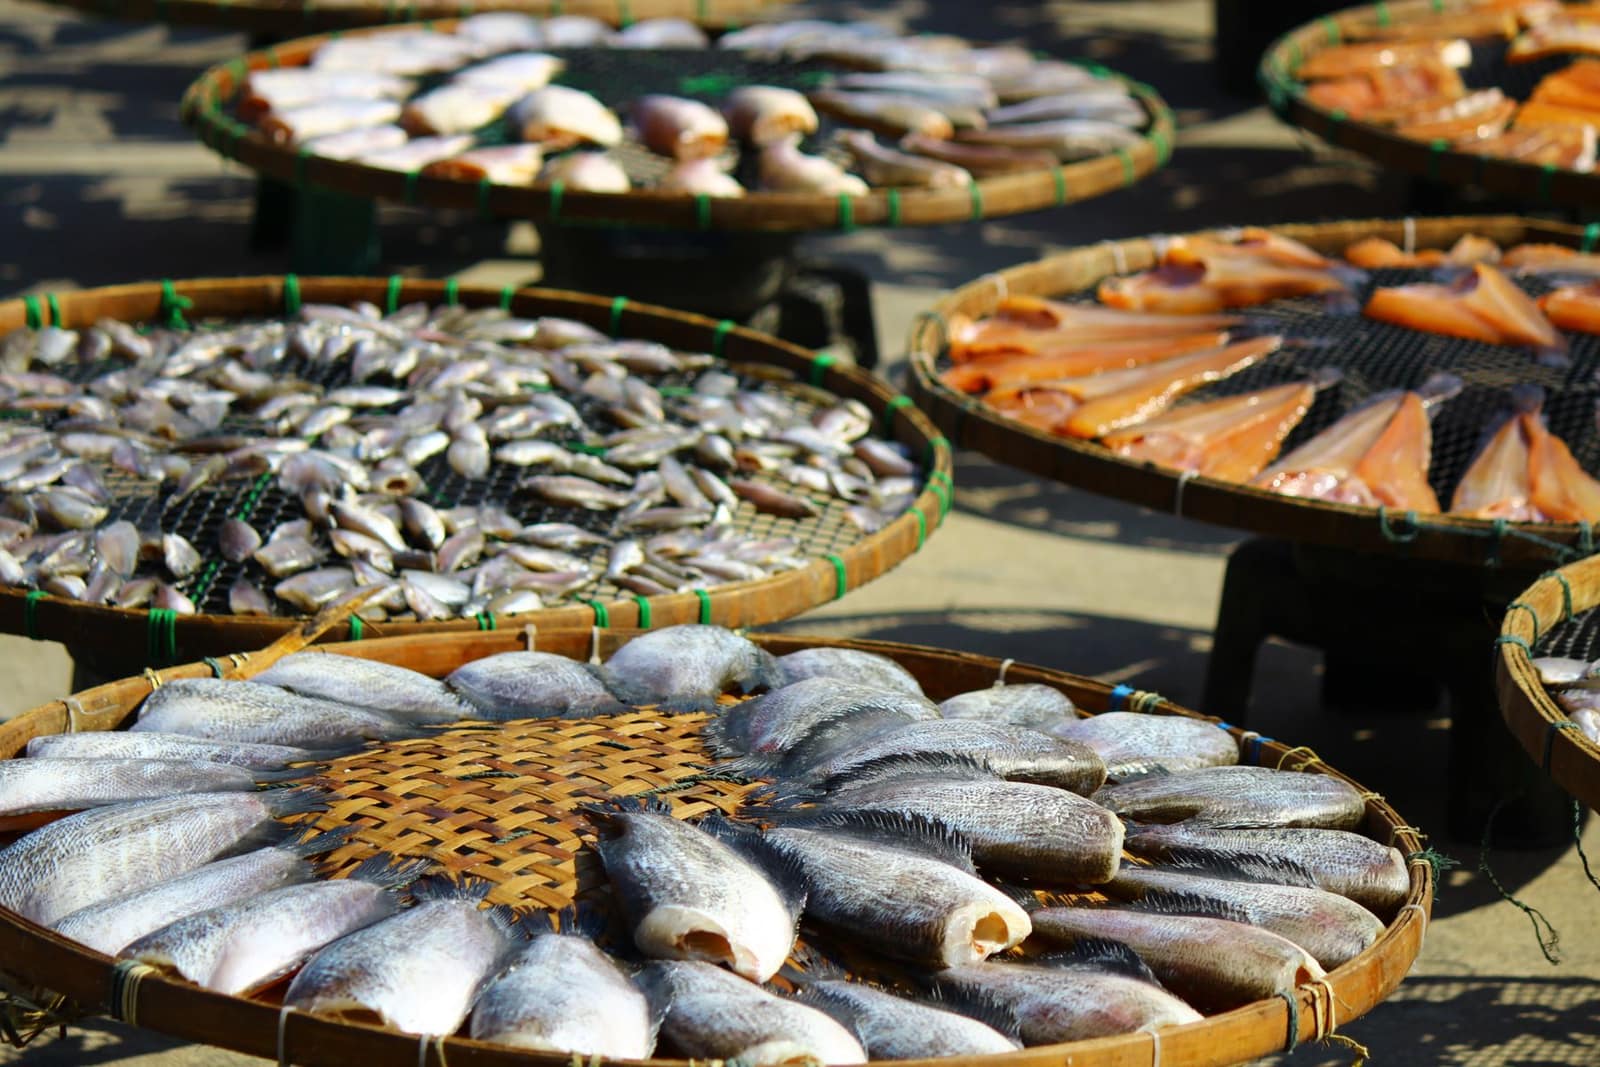 Free to exportMarineFishmeal and fish oilFishmeal and fish oil from sardine and small pelagic fish, sold to feed makers in Asia. The EU route needs an EIC-approved plant.HS2301Exports 2025-26US$ 608 mn ↑91.8%
 Free to exportFarm produceSpicesWhole, ground and blended spices. Spices Board registration (CRES) is compulsory; residue and ethylene oxide tests keep buyers.HS0904–0910Exports 2025-26US$ 3.12 bn ↓5.1%
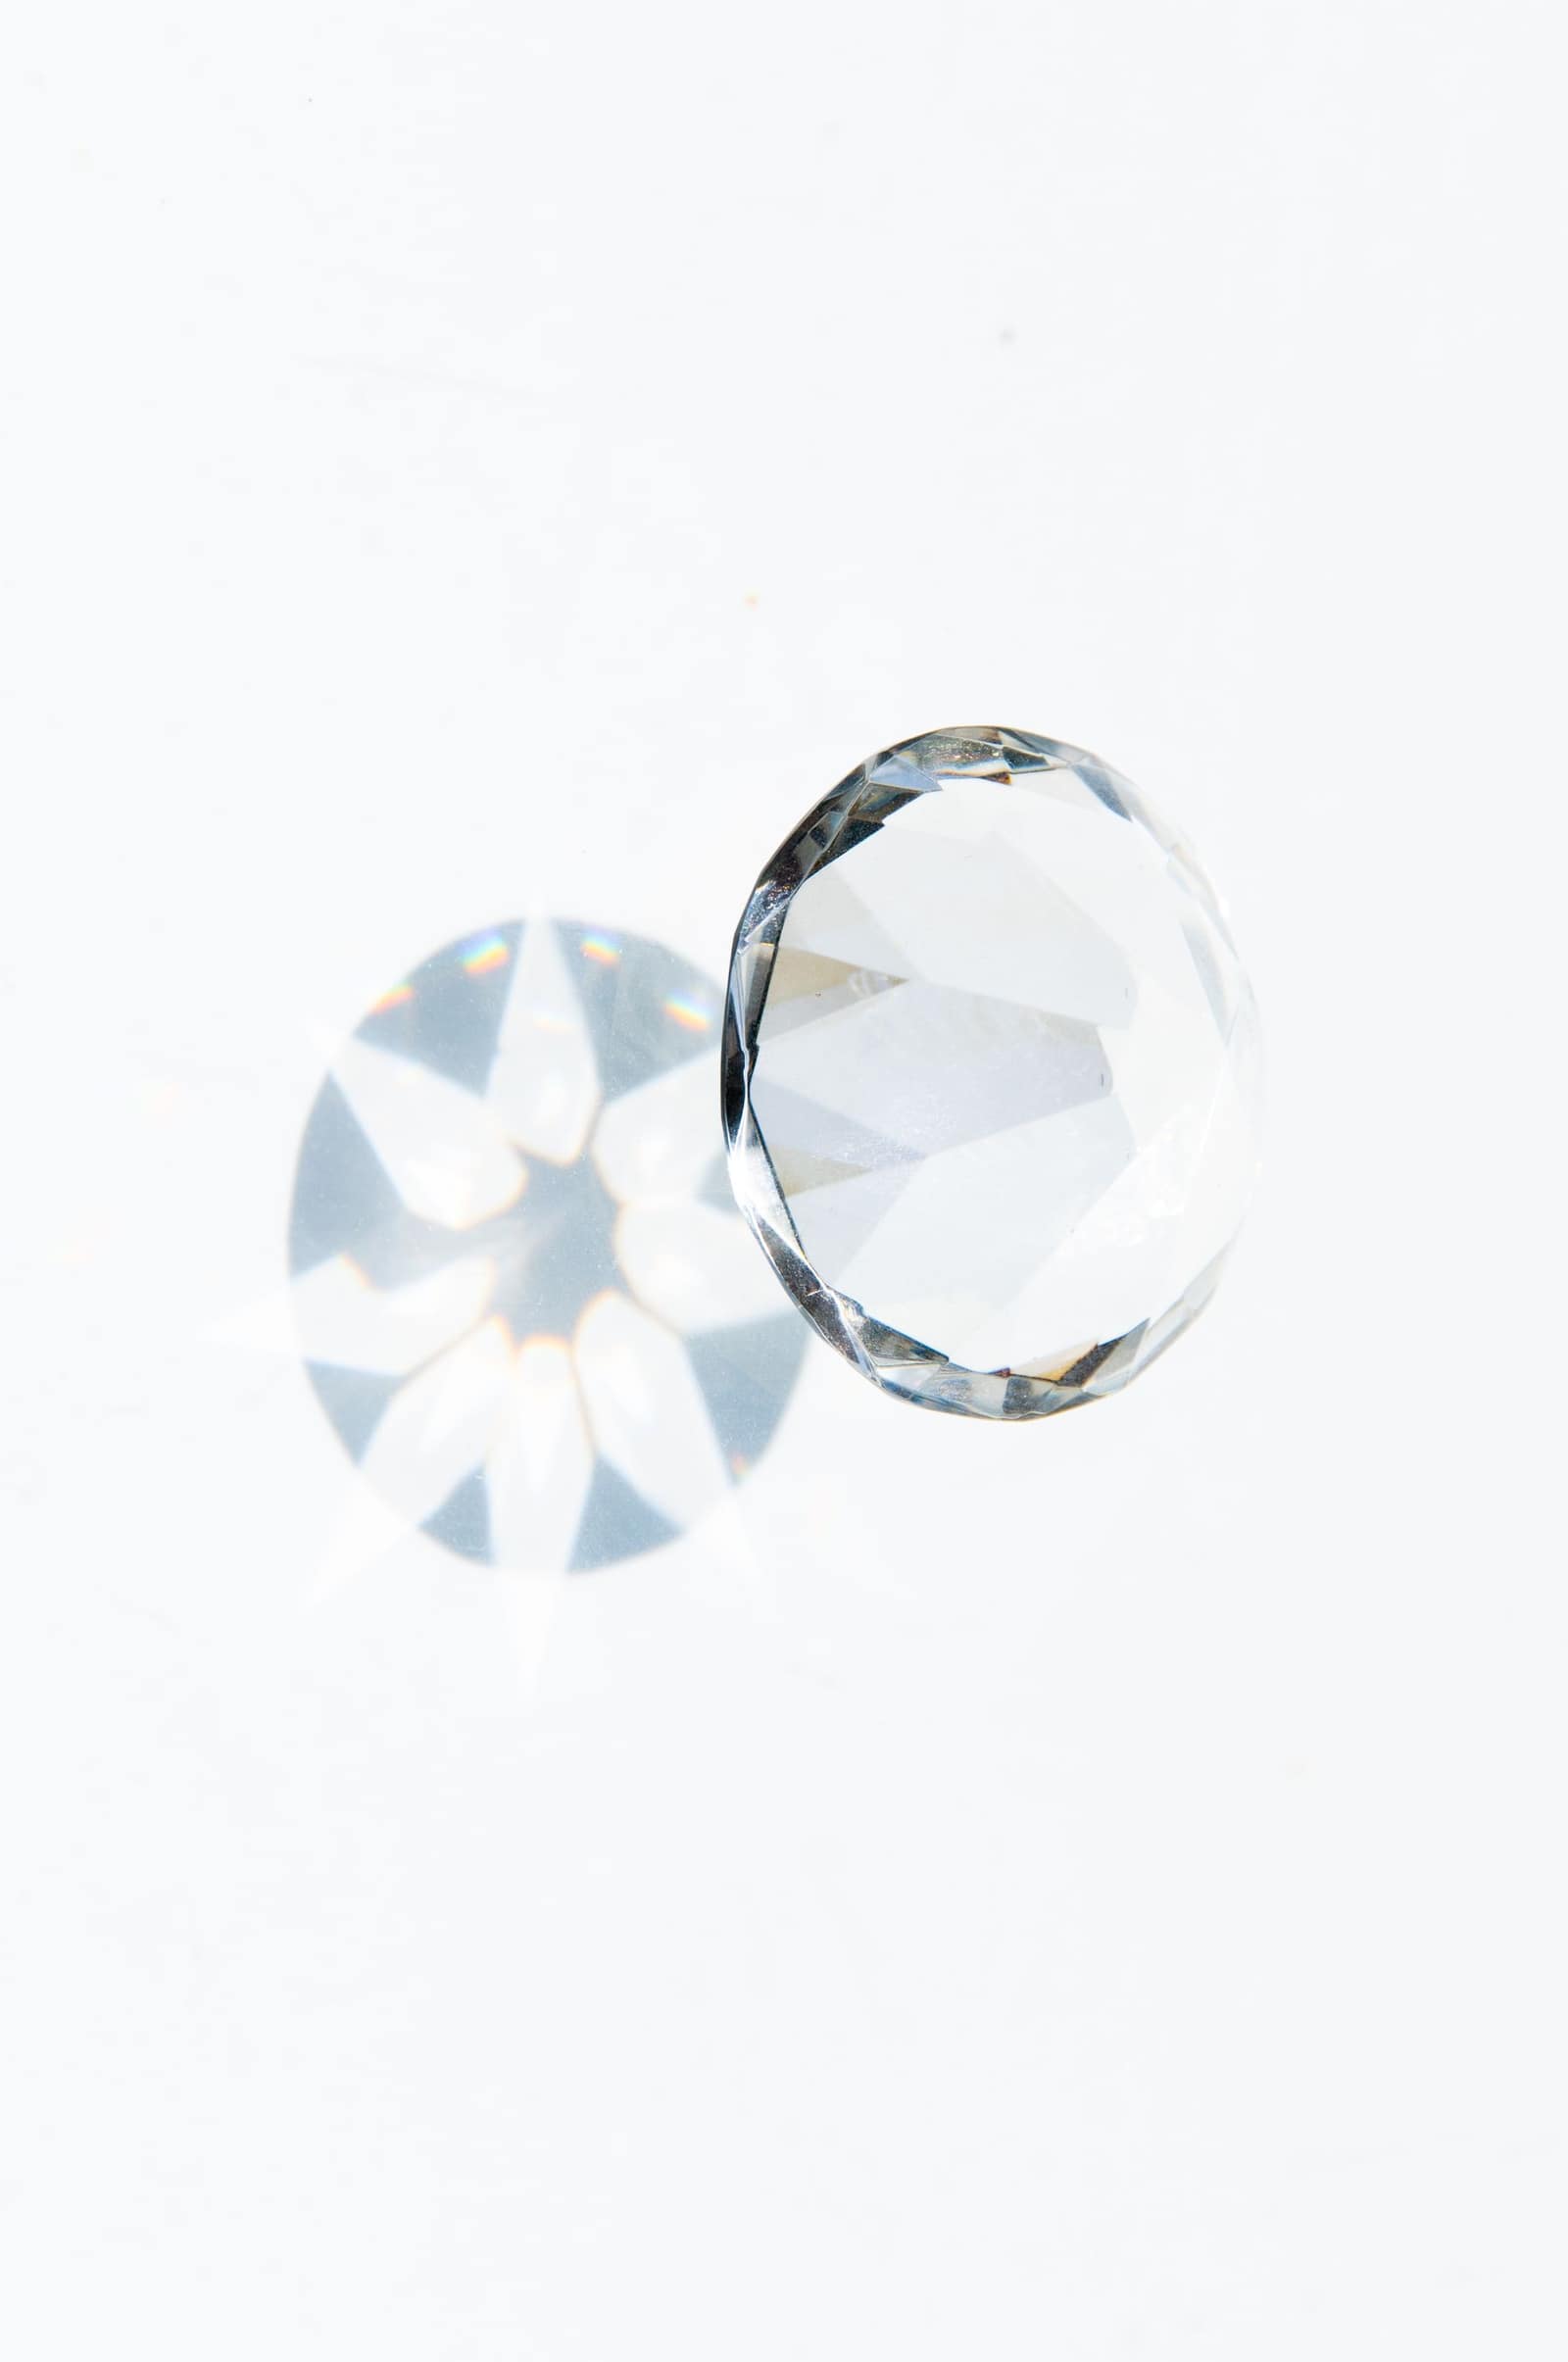 Free to exportJewelleryCut and polished diamondsIndia's largest gem export, polished in Surat; Hong Kong, the UAE, the USA and Belgium are the main buyers.HS7102.39Exports 2025-26US$ 12.1 bn ↓8.7%
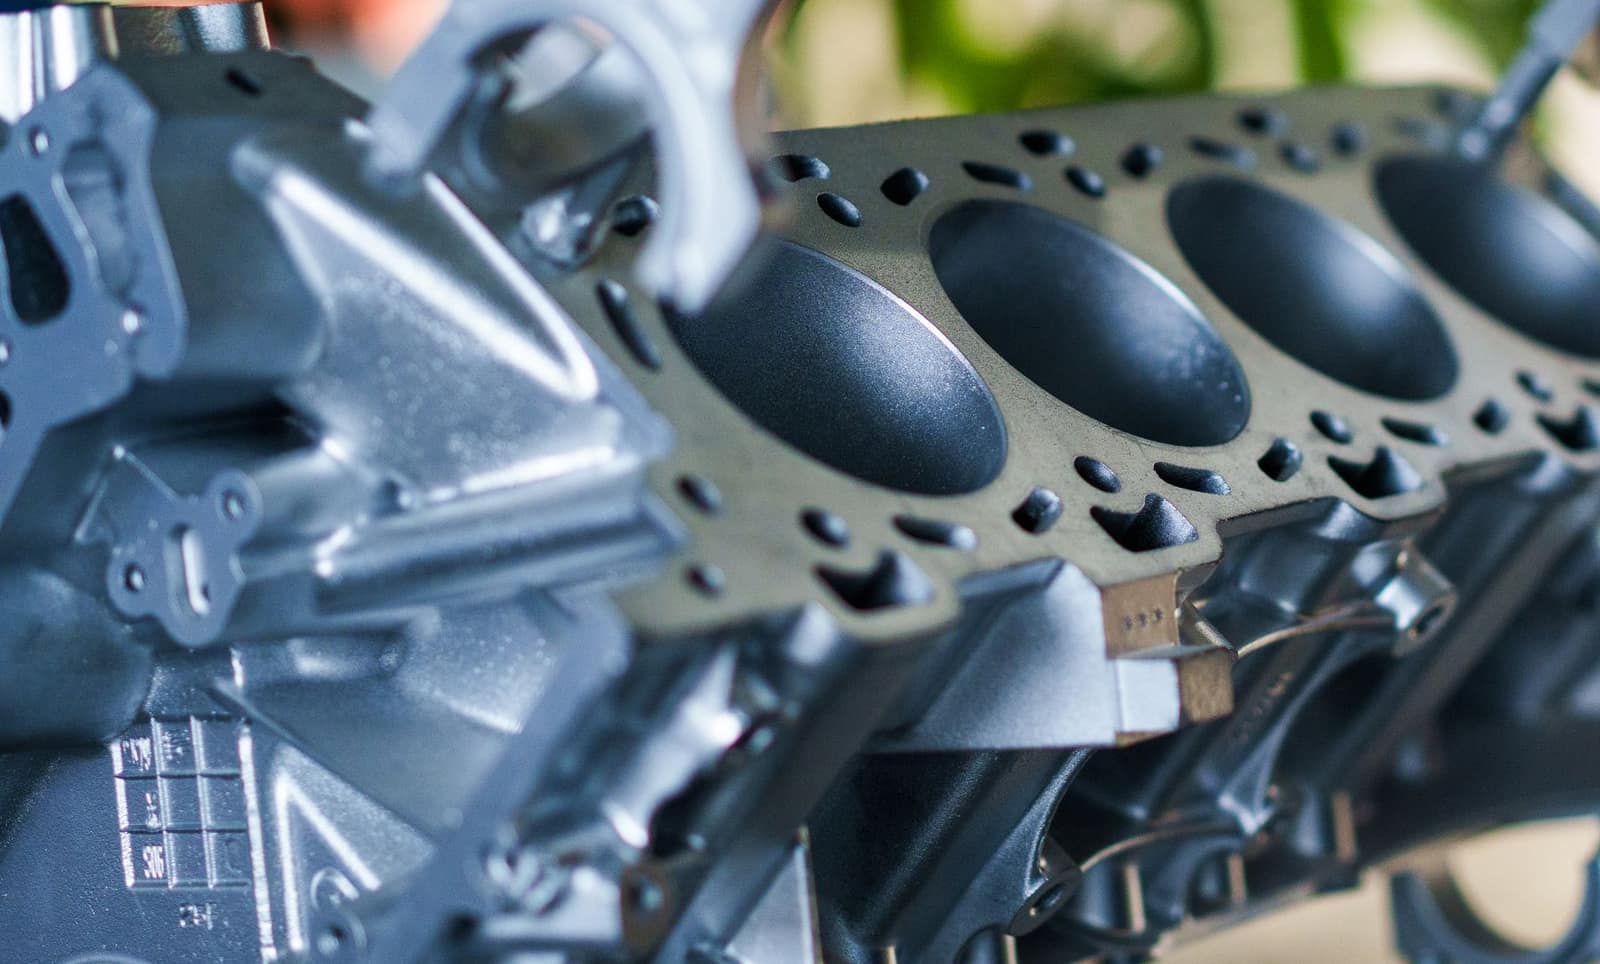 Free to exportEngineering goodsAuto parts and componentsOEM and aftermarket vehicle parts; the USA, Germany and Italy buy most, with strong demand in Latin America.HS8708Exports 2025-26US$ 7.64 bn ↑1.8%
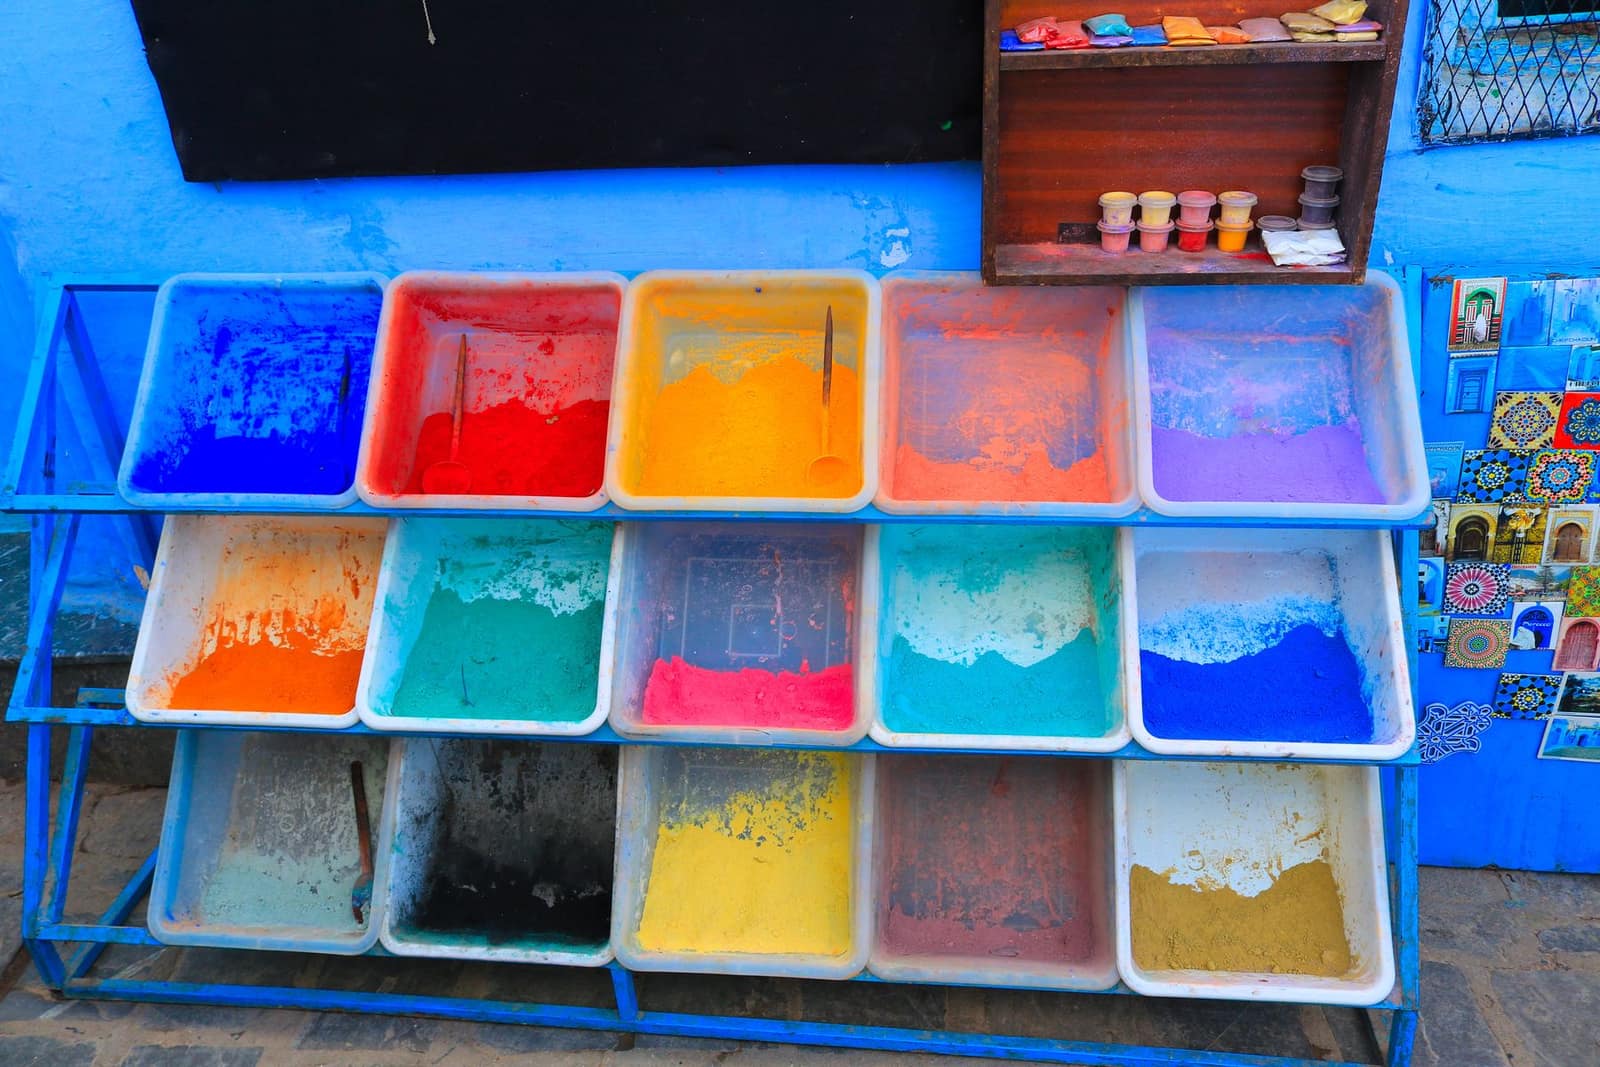 Free to exportPharma & chemicalsDyes and pigmentsReactive and disperse dyes and organic pigments from Gujarat and Maharashtra; textile hubs in Asia and Europe buy them.HS3204Exports 2025-26US$ 2.46 bn ↓8.7%
More in South-East Asia
 CECASGDSingaporeSingaporeDuty-free trading hub for South-East Asia. Strict food licensing by SFA; big Indian community.From India 2025-26US$ 11.9 bn
 CECAMYRKuala LumpurMalaysiaMulti-ethnic market with a large Indian-origin community. Halal expectations for food; CECA and AITIGA both apply.From India 2025-26US$ 6.83 bn
 AITIGAVNDHanoiVietnamFast-growing manufacturing economy buying raw materials, yarn, steel, chemicals and feed ingredients from India.From India 2025-26US$ 6.67 bn
 AITIGAIDRJakartaIndonesiaWorld's fourth most populous country. Buys Indian vehicles, steel, chemicals, groundnuts and meat; halal and BPOM rules for food.From India 2025-26US$ 4.49 bn