

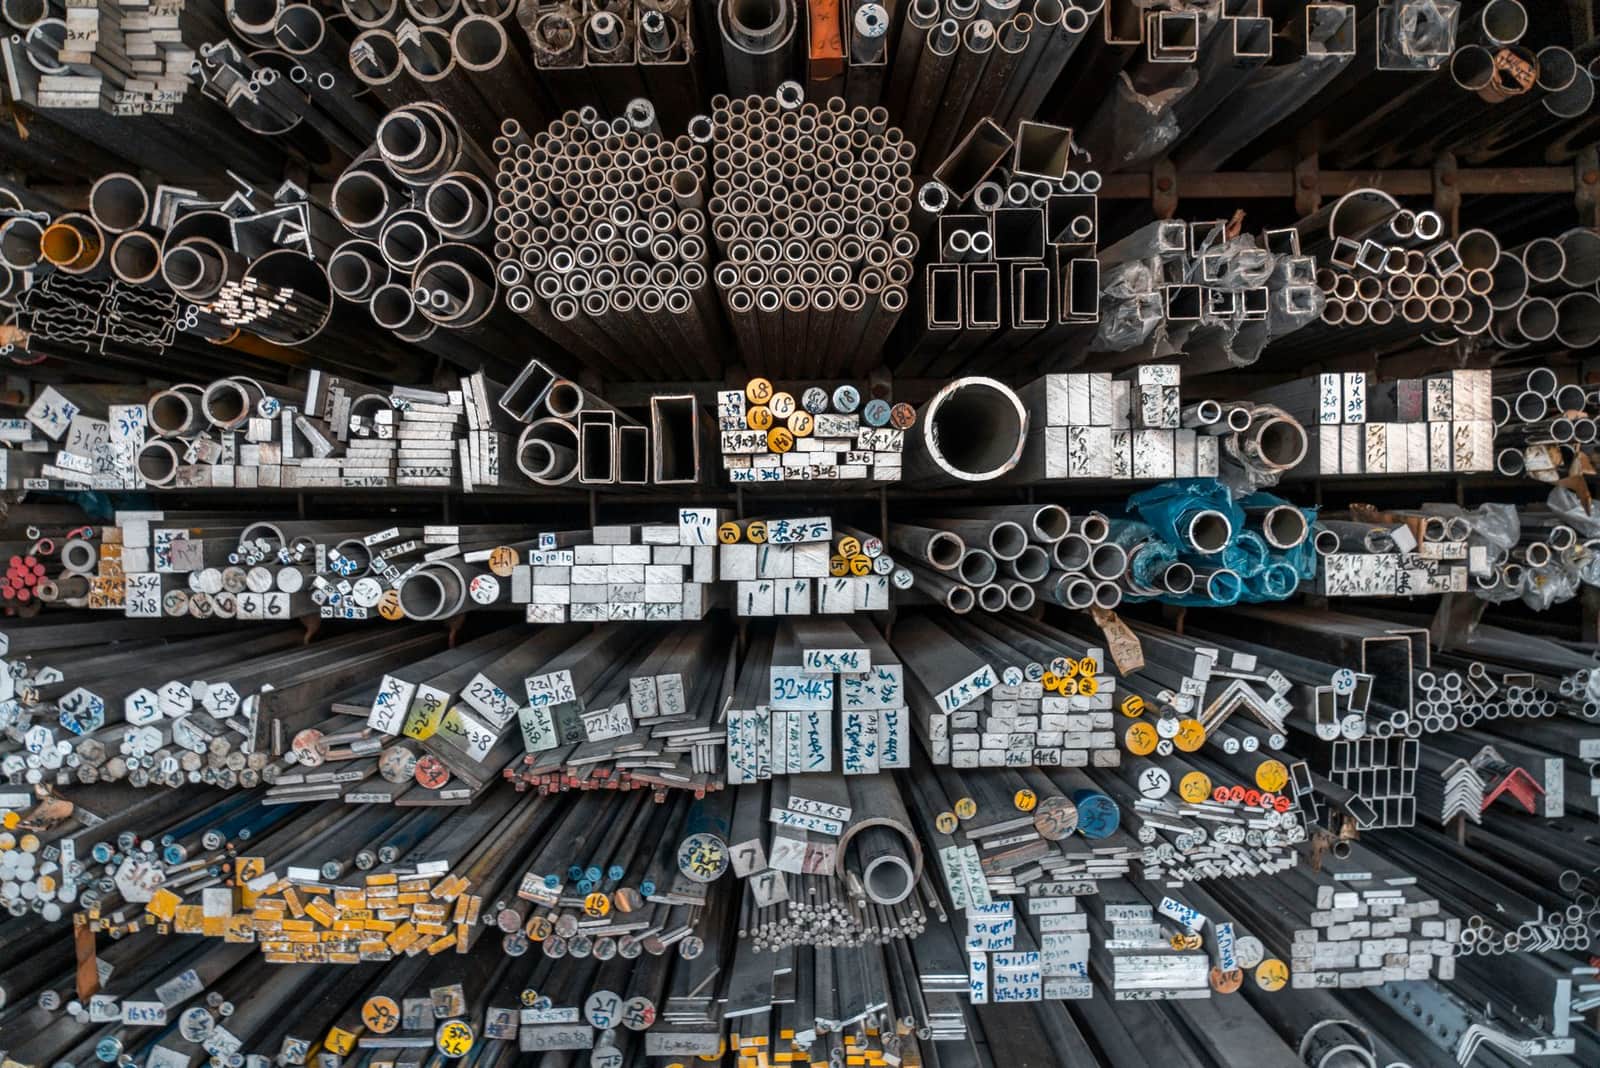
Engineering goods
Export aluminium products
Primary aluminium, extrusions and sheets; Korea, Vietnam, China and Japan lead for metal, the USA and UAE for products.
- HS code
- 7601 Unwrought aluminium — ingots, billets, wire-bars (7601); also bars, rods and profiles (7604) and plates and sheets (7606).
- Export policy
- Free to export Free to export under ITC(HS) Schedule 2 as checked in November 2026. Aluminium scrap and some alloy forms have separate entries, and certain high-strength aluminium alloys and tubes are on the SCOMET list. Confirm your exact 8-digit line on the DGFT ITC(HS) search before you ship.
- Registrations
- 3 IEC, GST and those below
- India’s exports, 2025-26
- US$ 4.62 bn to 121 countries
What is exported
India is a large producer of primary aluminium, with smelters in Odisha, Chhattisgarh, Uttar Pradesh and Jharkhand, and many extrusion, sheet and foil mills. In 2025-26 India exported about US$ 4.3 billion of unwrought aluminium (HS 7601); South Korea, Vietnam, China, Japan and Malaysia were the top buyers. Profiles (7604) and sheets (7606) are smaller lines that go mainly to the USA, the UAE and the UK.
Varieties, grades and forms
- Ingots, billets and wire rodsPrimary metal from smelters, sold on LME-linked prices.
- Extrusions and profilesWindow, door, façade and industrial sections (6063, 6061).
- Sheets, coils and circlesFor utensils, roofing, transport and packaging.
- FoilHousehold and packaging foil (7607).
- ConductorsACSR and all-aluminium conductors for power lines.
Where it is grown or made
- OdishaAngul and Jharsuguda — smelters
- ChhattisgarhKorba — smelter
- Uttar PradeshRenukoot — smelter and rolling
- Gujarat, Maharashtra and Dadra & Nagar HaveliSilvassa, Pune, Ahmedabad — extrusion, sheet and foil mills
The quality buyers ask for
- Purity (ingots)
- P1020A (99.7% Al minimum) or as per LME / buyer specification
- Alloy and temper
- Alloy series and temper named in the contract (for example 6063-T6 profiles, 1100-H14 sheet)
- Dimensions
- Length, thickness and tolerance per EN 755 / EN 485 or ASTM B221 / B209
- Surface
- Mill finish, anodised (micron thickness stated) or powder-coated (colour and film thickness)
- Emissions data
- Embedded emissions per tonne for EU CBAM reporting
Certificates
- Mill test certificate (EN 10204 3.1)RequiredChemical and mechanical results for each lot; expected by all buyers.
- CBAM emissions dataOften askedEU importers must report and pay for embedded emissions; they need your verified data.
- ISO 9001 / ISO 14001Often askedQuality and environmental systems many buyers ask for.
- ASI certificationOften askedAluminium Stewardship Initiative standard, asked for by some brand owners.
Shipping, storage and shelf life
Ingots and billets reach the weight limit first: a 20-ft container typically carries about 24–26 tonnes. Profiles and sheets go in 20-ft or 40-ft containers by volume.
Sea freight; break-bulk for large metal cargoes.
Keep dry to avoid water staining and white rust on sheets and coils.
What goes on the pack and carton
- Each bundle: alloy, temper, size, lot or cast number, net and gross weight, producer brand.
- Country of origin and buyer's order number; shipping marks matching the bill of lading.
NABL-accredited metallurgical labs test chemistry (spectro), mechanical properties and coating thickness; search 'metals' in the NABL directory. For EU CBAM, use an accredited verifier for emissions data.
Benefits of exporting this product
- RoDTEP: 3% of FOB
Tariff item 7601 10 10 (unwrought aluminium ingots, not alloyed) earns 3% of FOB value, capped at ₹6.5 per kg, as a duty credit scrip on ICEGATE. Alloy ingots (7601 20) carry 3% capped at ₹7.9/kg; profiles (7604) 1.1% and sheets (7606) 1.2% with no cap. These rates continue to 31 Dec 2026 (DGFT Notification 41/2026-27). Confirm your exact 8-digit line on the DGFT RoDTEP page before you price an order.
DGFT — Appendix 4R, RoDTEP schedule for DTA exports w.e.f. 10.10.2024 (Notification 32/2024-25); rates continued to 31.12.2026 by Notification 41/2026-27 ↗ - Duty drawback: 1% of FOB
Drawback item 7601 (unwrought aluminium) has an All Industry Rate of 1% of FOB, paid into your bank account. It is not available on exports under Advance Authorisation or from EOU/SEZ units. Bars, rods and profiles (7604) and plates and sheets (7606) have 1.2%. Check the current schedule on the CBIC drawback page before shipping.
Gazette of India — Notification 77/2023-Customs (N.T.) dated 20.10.2023: All Industry Rates of duty drawback ↗ - EU CBAM — plan for it
Aluminium is a CBAM good. Since 1 January 2026 EU importers pay for the embedded emissions of the aluminium they buy, so suppliers that can give verified, plant-specific emissions data are preferred. This is a cost, not a benefit — but being ready protects your EU orders.
European Commission — Carbon Border Adjustment Mechanism ↗
Where to register
- EEPC IndiaNon-ferrous metals and their products are listed under EEPC in Appendix 2T; take your RCMC from EEPC.eepcindia.org ↗
Quality and checks
- Chemical composition certificate per lot (for example P1020 purity for ingots, alloy designation such as 6063 for profiles).
- EU CBAM: aluminium is covered. From 1 January 2026 EU importers must buy CBAM certificates for embedded emissions, so they will ask you for verified emissions data.
- LME-registered brand or buyer-approved smelter for metal trades; dimension and finish checks for profiles and sheets.
Primary metal is a smelter business. A new exporter usually starts with extrusions, sheets, foil or finished aluminium goods bought from a mill with test certificates, sold to Gulf fabricators or Indian-origin importers on LC terms.
Where new exporters go wrong
- Ignoring CBAM data requests from EU buyers — they may switch suppliers.
- Pricing without an LME-linked formula; metal prices move daily.
- Shipping scrap or alloy under the wrong HS line.
Documents this product needs
Schemes that apply
- RoDTEP Remission of Duties and Taxes on Exported Products
- Drawback Duty Drawback (All Industry Rates)
- Advance Authorisation Advance Authorisation
- EPCG Export Promotion Capital Goods Scheme
- ECGC ECGC export credit insurance for small exporters
- LUT Letter of Undertaking for zero-rated exports under GST
- Status Holder Status Holder certificate (One to Five Star Export House)
Sources (5)
- Department of Commerce, Export Import Data Bank — India's exports of HS 7601 by country, 2025-26
- DGFT — Appendix 2T: Export Promotion Councils and the products under each
- DGFT — ITC(HS) export policy search (Schedule 2) and SCOMET list (Appendix 3)
- European Commission — Carbon Border Adjustment Mechanism
- EEPC India — official site
Trade data
Indian aluminium products exports in numbers
From the Department of Commerce’s TradeStat, country by country. US$, Indian financial years (April–March).
- Exports in 2025-26
- US$ 4.62 bn +0.5% a year on average, 2020-21 to 2025-26
- Change from 2024-25
- ↓ -2.5% US$ 4.74 bn → US$ 4.62 bn
- Buyer countries
- 121
- Average export price
- US$ 2.94 per kg · 1.57 mn tonnes shipped · US$ 2.67 the year before
The price cycle
India’s average export price per kg each year (total value ÷ total quantity). Highest in 2025-26, lowest in 2020-21 — a 57% swing between them. Keep this swing in mind when you quote.
What next: a projection from the trend
The past trend carried forward — not a forecast by any authority. Sudden changes in policy, prices or demand are not in it.
Likely range US$ 2.88 bn to US$ 6.59 bn.
- Trend
- -5.4% a year
- Fit (R²)
- 0.16 — weak, read with care
- Based on
- 6 years of official figures
Method: a straight line through the logarithm of yearly exports (log-linear regression); range = ±1 standard error.
Biggest buyer countries
By value in 2025-26. Change is against 2024-25.
Where demand is rising and falling
Only countries that buy at least US$ 1 million or 1% of India’s exports of this product. Change from 2024-25 to 2025-26.
↑ High demand
- Saudi ArabiaUS$ 17.3 mn → US$ 55.9 mn↑+222.4%
- NepalUS$ 26.3 mn → US$ 57.5 mn↑+118.8%
- ChinaUS$ 206 mn → US$ 385 mn↑+86.7%
- VietnamUS$ 236 mn → US$ 426 mn↑+80.8%
- FranceUS$ 44.8 mn → US$ 67.4 mn↑+50.7%
- United Arab EmiratesUS$ 48.8 mn → US$ 71 mn↑+45.4%
- United States of AmericaUS$ 224 mn → US$ 315 mn↑+40.4%
- United KingdomUS$ 33.5 mn → US$ 46.5 mn↑+38.9%
↓ Low demand
- CroatiaUS$ 48.2 mn → US$ 2.8 mn↓-94.1%
- TürkiyeUS$ 741 mn → US$ 143 mn↓-80.7%
- MontenegroUS$ 103 mn → US$ 39.2 mn↓-62.1%
- CanadaUS$ 65.7 mn → US$ 42.2 mn↓-35.7%
- MexicoUS$ 351 mn → US$ 227 mn↓-35.5%
- BangladeshUS$ 67.5 mn → US$ 50 mn↓-26%
- NetherlandsUS$ 161 mn → US$ 131 mn↓-18.5%
Which forms sell, and at what price
India’s exports by 8-digit tariff line, 2025-26. Average price = total value ÷ total quantity (TradeStat): the average of every shipment on that line, not the price of any one deal.
| Tariff line | Value 2025-26 | Change | Quantity | Average price |
|---|---|---|---|---|
Aluminium ingots-not alloyed7601 10 10 · Aluminium, unwrought, | US$ 2.99 bn | ↓-7.2% | 1.04 mn tonnes | US$ 2.86 per kgwas US$ 2.67 |
Aluminium billets - alloyed7601 20 20 · Aluminium, unwrought, alloys | US$ 917 mn | ↓-0.1% | 3,08,281 tonnes | US$ 2.97 per kgwas US$ 2.46 |
Aluminium, unwrought, alloys — aluminium ingots -alloyed7601 20 10 | US$ 330 mn | ↑+34.8% | 1,15,234 tonnes | US$ 2.86 per kgwas US$ 2.68 |
Rctnglr(including sqr)plts etc..of almnm allys7606 12 00 · Aluminium, plates, sheets and strip, thickness exceeding 0.2mm, alloys, rectangular | US$ 139 mn | ↑+6.3% | 40,083 tonnes | US$ 3.47 per kgwas US$ 3.22 |
Others-of-rectangular(includinguding square) platessheets,strip of aluminium-not alloyed7606 11 90 · Aluminium, plates, sheets and strip, thickness exceeding 0.2mm,, rectangular | US$ 49.3 mn | ↑+19.3% | 16,113 tonnes | US$ 3.06 per kgwas US$ 3.14 |
Aluminium, unwrought, alloys — other aluminium alloys7601 20 90 | US$ 41.3 mn | ↑+57.5% | 14,098 tonnes | US$ 2.93 per kgwas US$ 2.53 |
Hollow profiles of aluminium alloys7604 21 00 · Aluminium, alloys, hollow profiles | US$ 39.8 mn | ↓-11.7% | 7,109 tonnes | US$ 5.60 per kgwas US$ 5.08 |
Other bars,rods profils of almn alloys not elsewhere specified7604 29 90 · Aluminium, alloys, bars, rods and profiles, other than hollow | US$ 31.5 mn | ↑+3.3% | 6,487 tonnes | US$ 4.86 per kgwas US$ 4.81 |
Other bars and rods, other than wire rods7604 29 30 · Aluminium, alloys, bars, rods and profiles, other than hollow | US$ 28.9 mn | ↑+7.9% | 7,652 tonnes | US$ 3.77 per kgwas US$ 3.55 |
Aluminium, plates, sheets and strip, thickness exceeding 0.2mm, not alloyed, — circles7606 91 10 | US$ 14.4 mn | ↑+0.8% | 4,339 tonnes | US$ 3.31 per kgwas US$ 3.17 |
Hrd drwn bare almnm condctrs stl re-infrcd7604 29 10 · Aluminium, alloys, bars, rods and profiles, other than hollow | US$ 9.4 mn | ↑+24% | 1,849 tonnes | US$ 5.06 per kgwas US$ 5.94 |
Others-of-other plts,strips etc. of aluminium alloys7606 92 90 · Aluminium, plates, sheets and strip, thickness exceeding 0.2mm, alloys, | US$ 8.2 mn | ↑+19% | 1,666 tonnes | US$ 4.90 per kgwas US$ 5.19 |
Other profiles of aluminium-not alloyed7604 10 39 · Aluminium,, bars, rods and profiles | US$ 7.2 mn | ↓-7.5% | 1,209 tonnes | US$ 5.94 per kgwas US$ 5.51 |
Aluminium, plates, sheets and strip, thickness exceeding 0.2mm, alloys, — circle7606 92 10 | US$ 5.2 mn | ↑+4.6% | 1,401 tonnes | US$ 3.71 per kgwas US$ 3.41 |
The world market
Each country’s own recorded exports and imports in UN Comtrade, 2023 (the latest year nearly every country has reported).
- World imports
- US$ 131 bn 2023
- India among exporters
- #6 of 147 countries
- India’s share of world exports
- 4.1% US$ 5.09 bn
- Left for others to win
- US$ 118.4 bn exported by other countries
Top exporters — your competitors
- 1ChinaUS$ 13 bn 10.5%
- 2GermanyUS$ 9.37 bn 7.6%
- 3CanadaUS$ 9.18 bn 7.4%
- 4United Arab EmiratesUS$ 6.63 bn 5.4%
- 5USAUS$ 5.94 bn 4.8%
- 6IndiaUS$ 5.09 bn 4.1%
- 7MalaysiaUS$ 4.79 bn 3.9%
- 8NorwayUS$ 4.33 bn 3.5%
- 9ItalyUS$ 4.07 bn 3.3%
- 10BahrainUS$ 3.72 bn 3%
Biggest buyers in the world
- 1USAUS$ 16.5 bn 12.6%
- 2GermanyUS$ 13.1 bn 10%
- 3ChinaUS$ 7.33 bn 5.6%
- 4MexicoUS$ 6.38 bn 4.9%
- 5JapanUS$ 5.8 bn 4.4%
- 6Rep. of KoreaUS$ 5.22 bn 4%
- 7TürkiyeUS$ 5.06 bn 3.9%
- 8NetherlandsUS$ 5.05 bn 3.9%
- 9ItalyUS$ 4.99 bn 3.8%
- 10FranceUS$ 4.52 bn 3.4%
Opportunity: what these countries buy from the world, and from India
Each country’s own recorded imports in UN Comtrade, latest year it has reported. The long light part of each bar is demand other countries are filling today.
TradeStat’s 2023-24 quantities are double-counted, so that year is left out of the price. Sources: TradeStat — Export Import Data Bank, Department of Commerce · UN Comtrade database (United Nations Statistics Division) · Figures taken 29 October 2026.
Step by step
How to export aluminium products
India is among the larger producers of primary aluminium and a regular exporter of ingots, billets and wire rod to Asian buyers. China dominates world production; the Gulf smelters, Russia, Canada and Australia are the other big suppliers. Demand is driven by vehicles, packaging, power lines and construction, and by the shift to lighter materials for electric vehicles. For smaller exporters the openings are in extrusions, foil and fabricated aluminium products, but EU buyers now also look at the carbon footprint because of CBAM.
- 01Pick the product
Primary metal needs a smelter tie-up; extrusions and sheets are easier for traders.
- 02Agree pricing formula
Use LME price plus premium and conversion cost, with a fixing date.
- 03Collect certificates
Mill test certificates and, for EU, emissions data from the producer.
- 04Inspect
Independent inspection of weight, dimensions and surface before loading.
- 05Ship
Book containers or break-bulk; lash bundles to avoid shifting.
- 06Claim benefits
Claim RoDTEP (within caps) and drawback on the shipping bill.
- 07Payment
LC at sight is normal for metal trades with new buyers.
Meet buyers
Trade fairs
- Every two years — check the next editionALUMINIUM (world trade fair)Düsseldorf, Germanyaluminium-exhibition.com ↗
- Check dates on the siteAluminium IndiaIndia (city changes)aluminium-india.com ↗
- Usually November — check datesBig 5 GlobalDubai, UAEbig5global.com ↗
- April, every year — check datesHannover MesseHannover, Germanyhannovermesse.de ↗
Questions
Questions about exporting aluminium products
What is CBAM and does it affect me?
Why is the RoDTEP on ingots capped?
Which council covers aluminium?
Can I export aluminium scrap?
How should I price?
Sources (5)
- EEPC India — official site
- European Commission — Carbon Border Adjustment Mechanism
- NABL — search for accredited testing laboratories
- DGFT — Appendix 4R, RoDTEP schedule for DTA exports w.e.f. 10.10.2024 (Notification 32/2024-25); rates continued to 31.12.2026 by Notification 41/2026-27
- DGFT — ITC(HS) export policy search (Schedule 2) and SCOMET list (Appendix 3)
Who buys Indian aluminium products
All countries → CEPAKRWSeoulSouth KoreaIndustrial buyer of Indian naphtha, metals, chemicals and yarn. Food plants must register with MFDS first.From India 2025-26US$ 6.01 bn
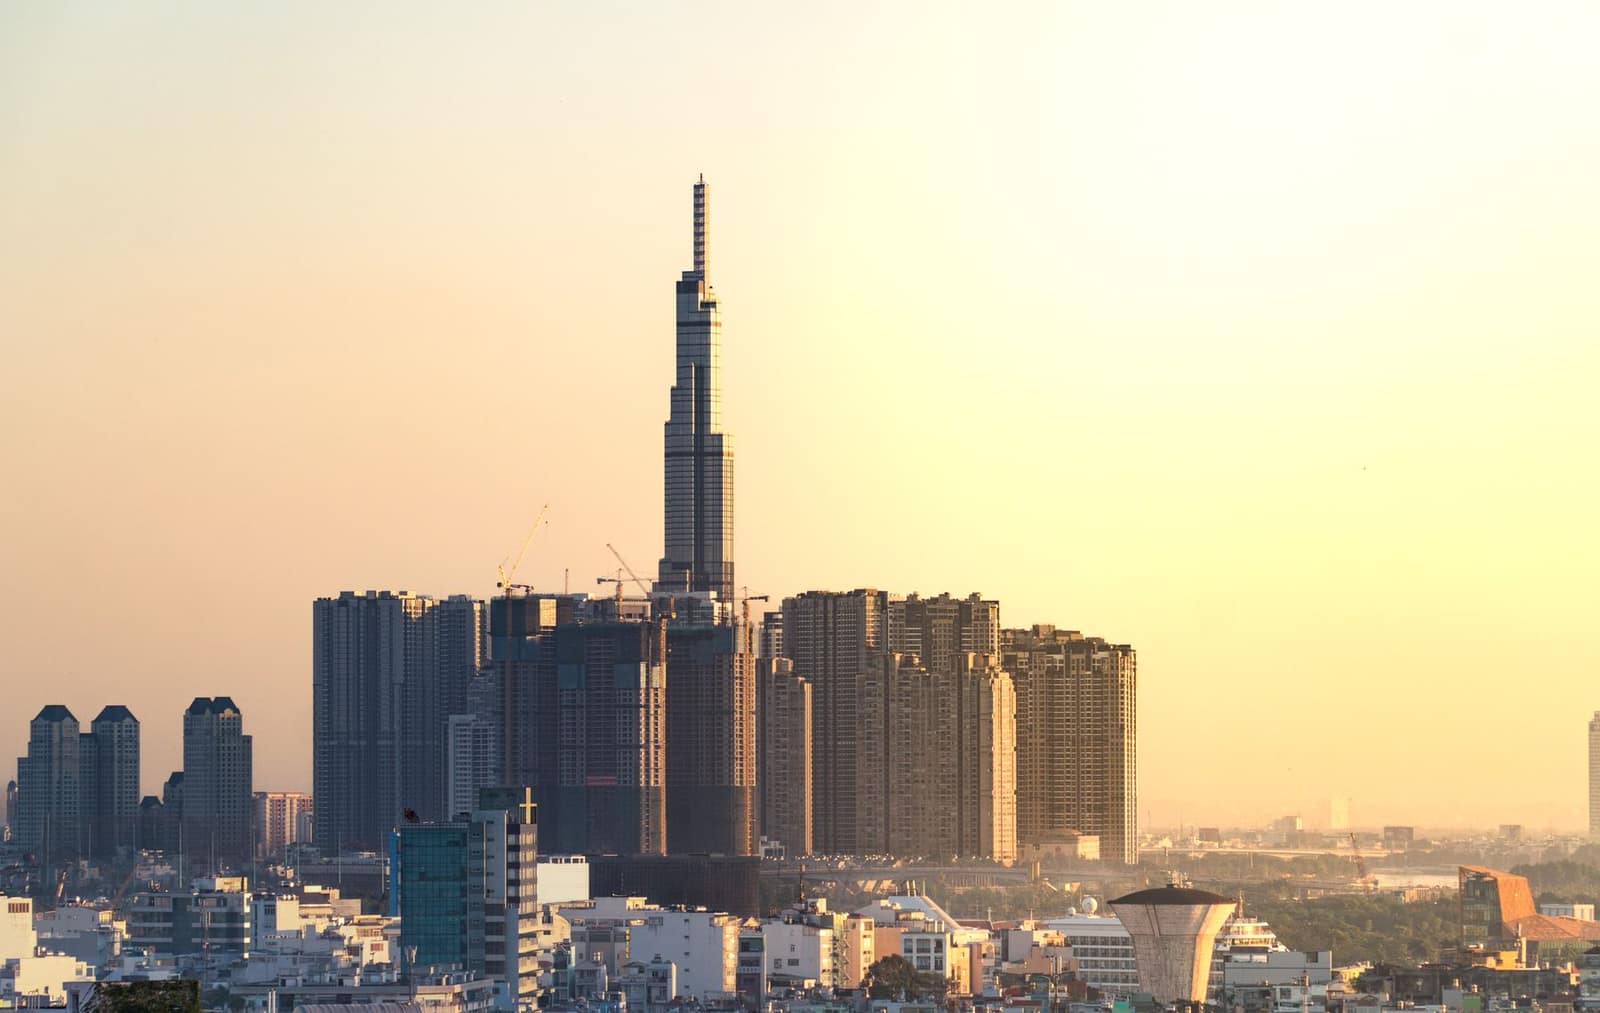 AITIGAVNDHanoiVietnamFast-growing manufacturing economy buying raw materials, yarn, steel, chemicals and feed ingredients from India.From India 2025-26US$ 6.67 bn
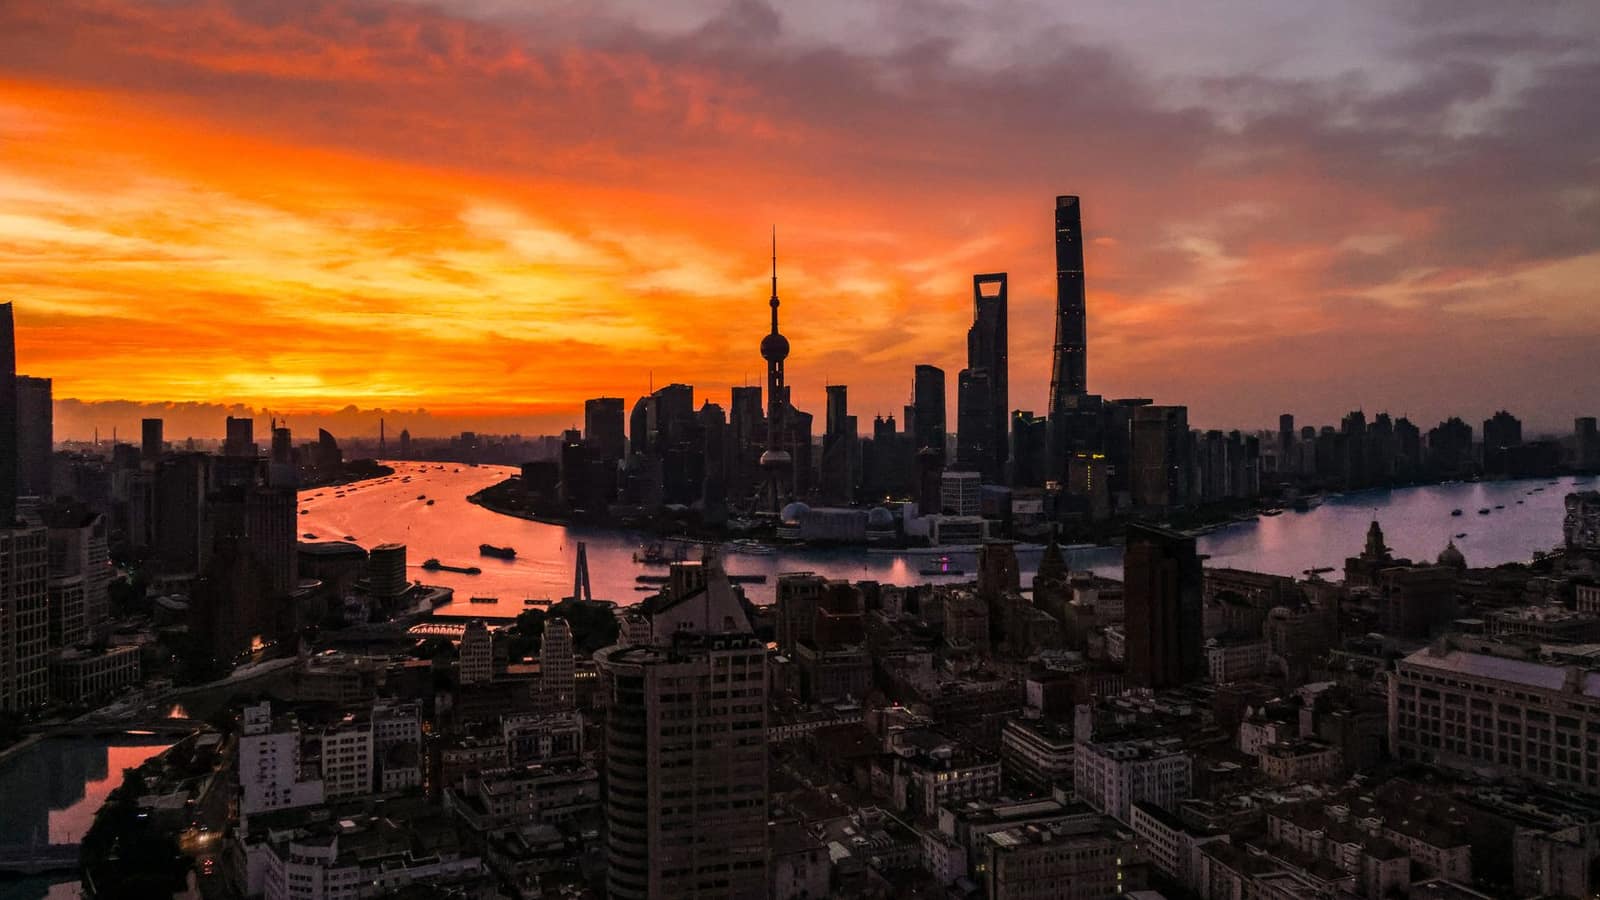 APTACNYBeijingChinaHuge market, but mostly for raw materials. Food plants must be registered with GACC; fresh produce needs a protocol.From India 2025-26US$ 19.5 bn
 CEPAJPYTokyoJapanHigh-value, quality-obsessed market. Buys shrimp, chemicals, auto parts and garments; strict food-sanitation checks.From India 2025-26US$ 6.04 bn
 CECAMYRKuala LumpurMalaysiaMulti-ethnic market with a large Indian-origin community. Halal expectations for food; CECA and AITIGA both apply.From India 2025-26US$ 6.83 bn
 USDWashington, D.C.United States of AmericaIndia's largest single-country export market. Strict FDA rules for food; extra 10% US duty on most goods since July 2026.From India 2025-26US$ 87.3 bn
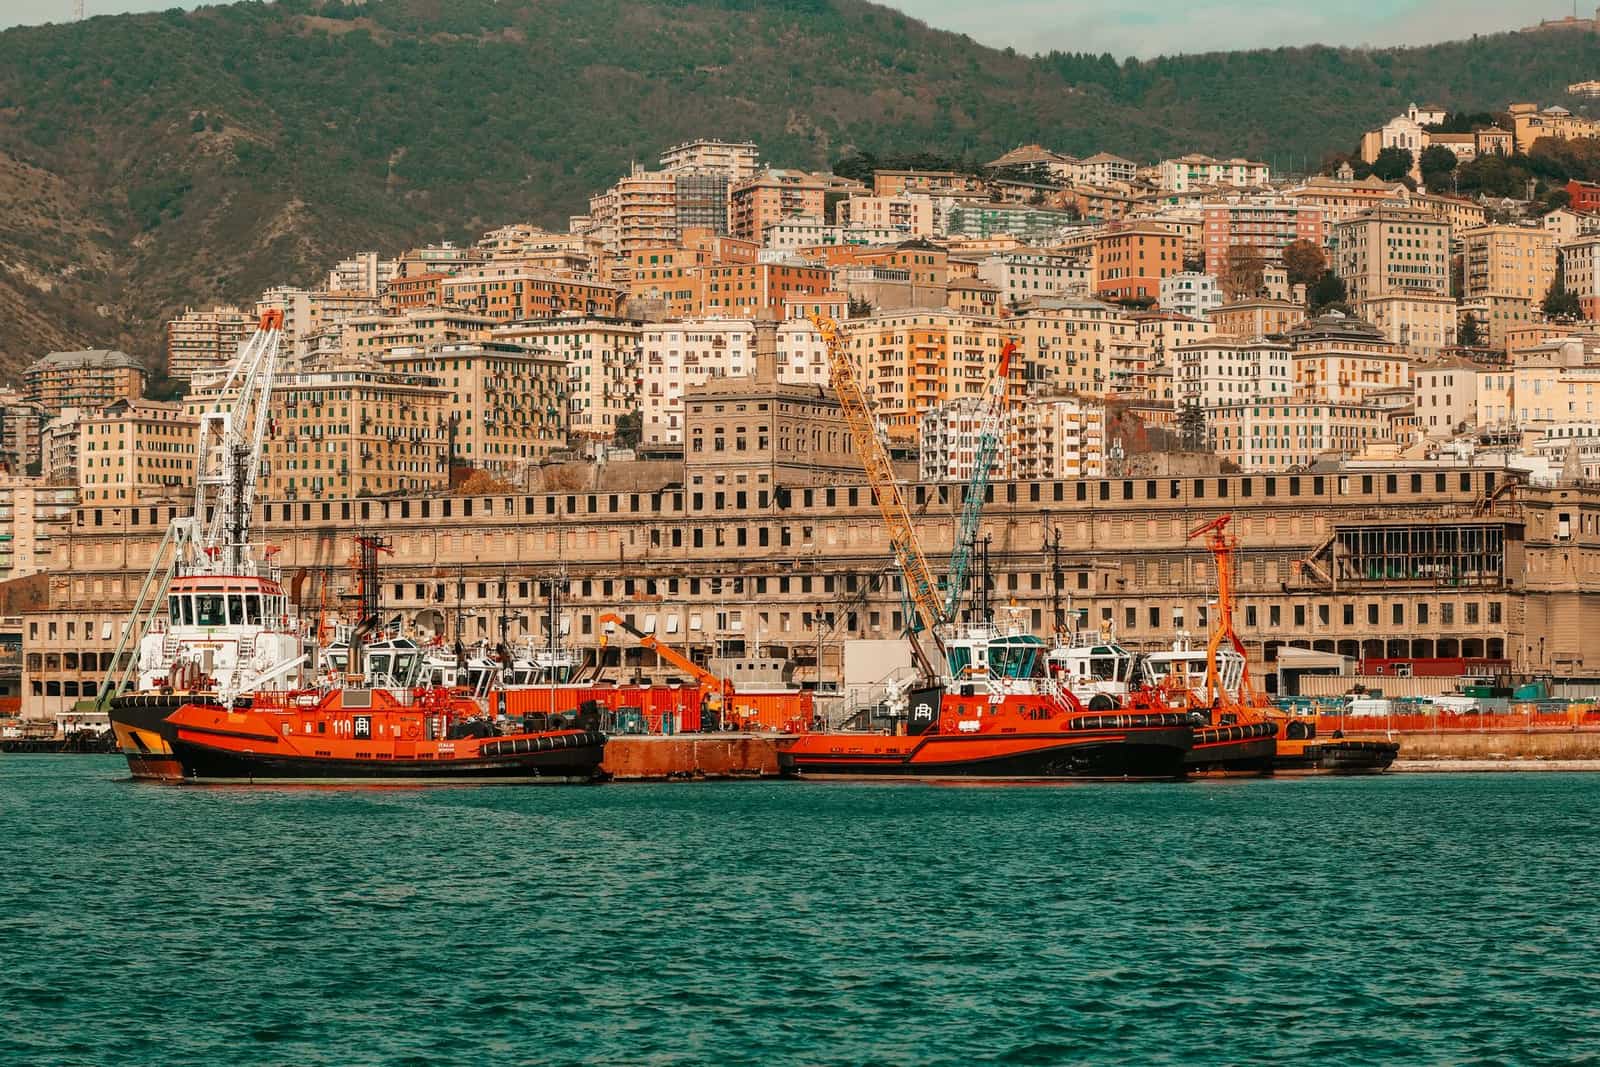 EURRomeItalyManufacturing buyer of Indian leather, yarn, castings, chemicals and seafood. EU rules apply.From India 2025-26US$ 7.79 bn
 CEPAAEDAbu DhabiUnited Arab EmiratesIndia's biggest Gulf buyer and a re-export hub for the Middle East and Africa. CEPA in force since 2022.From India 2025-26US$ 37.4 bn
More in engineering goods
All products → Free to exportEngineering goodsAuto parts and componentsOEM and aftermarket vehicle parts; the USA, Germany and Italy buy most, with strong demand in Latin America.HS8708Exports 2025-26US$ 7.64 bn ↑1.8%
 Free to exportEngineering goodsIron and steel castingsGrey and ductile iron and steel castings from Kolhapur, Rajkot, Coimbatore and Howrah; the USA leads.HS7325Exports 2025-26US$ 1.25 bn ↑3.2%
 Free to exportEngineering goodsHand toolsHammers, wrenches, pliers and garden tools from Jalandhar and Ludhiana; the USA buys most.HS8205Exports 2025-26US$ 161 mn ↓7%
 Free to exportEngineering goodsPumpsAgricultural, domestic and industrial pumps from Coimbatore, Rajkot and Ahmedabad; the USA leads.HS8413Exports 2025-26US$ 1.6 bn ↑5.2%