

Europe
Export to Greece
Gateway to South-East Europe through Piraeus. Buys Indian chemicals, marine products, steel and textiles.
- Capital
- Athens
- Currency
- EUR
- Trade agreement with India
- India–EU Free Trade Agreement (concluded, not yet in force) Not in force yetNot yet in force (talks concluded 27 Jan 2026)
- Main ports
- Piraeus, Thessaloniki, Athens International Airport
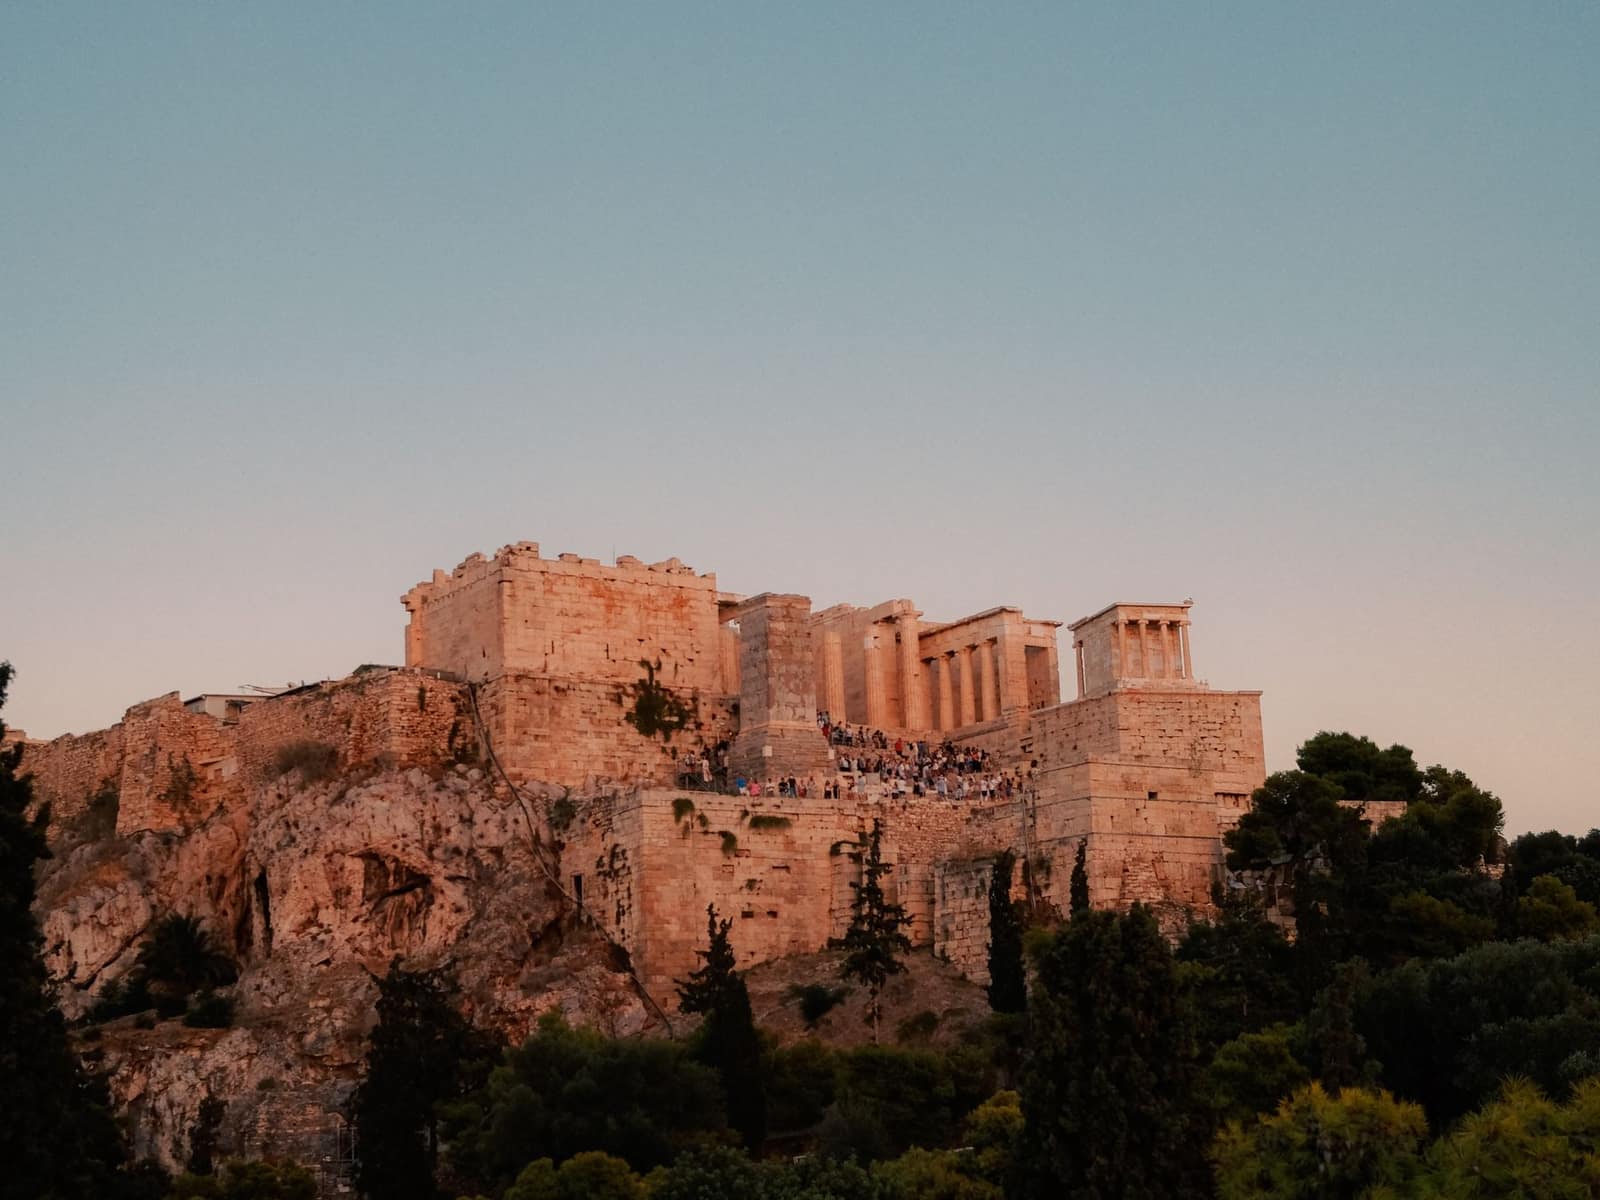
Piraeus near Athens is one of the Mediterranean’s busiest container ports and a route into the Balkans and Central Europe. Greece buys Indian chemicals, iron and steel, marine products, textiles and machinery. All EU rules apply, with food controls by the Hellenic Food Authority (EFET).
Greece trades with India under common EU rules. India and the EU concluded the FTA on 27 January 2026, and the Commerce Ministry says 90.7% of India’s exports to the EU (by value) will become duty-free once it enters into force. In June 2026 the Commerce Minister said signing was expected by December 2026 and entry into force around February–March 2027. Until then, normal EU duties apply. Confirm current status on commerce.gov.in.
What it buys from India
- Organic chemicals and medicines
- Iron and steel products and machinery
- Marine products, textiles and garments
Import rules on their side
- Food must meet EU maximum residue levels (MRLs) for pesticides, which are often stricter than Indian limits, and some Indian foods are on the EU list for extra border checks with official test reports. Check your product on Access2Markets before you ship.
- Iron, steel and aluminium goods fall under the EU carbon border rules (CBAM), so buyers will ask for embedded-emissions data. Chemicals in products must meet REACH, many goods need CE marking, and deforestation rules (EUDR) apply to coffee, rubber, wood and leather from 30 December 2026 for large and medium importers.
- Retail labels must be in Greek; food is controlled by EFET and customs by the Independent Authority for Public Revenue (AADE).
Practical tips
- Greek distributors often cover Cyprus and the Balkans too; one partner can open several small markets.
- Shipping time via the Suez Canal is short, but Red Sea disruption can force longer routes; check the transit time with your line.
- European buyers usually move to open account or documents against payment (D/P) once trust is built. For the first orders ask for an advance or an LC, and use ECGC credit insurance when you give credit.
Sources (11)
- Department of Commerce — India-EU Free Trade Agreement concluded (27 Jan 2026)
- All India Radio News — India-EU likely to sign FTA by December: Piyush Goyal (21 Jun 2026)
- European Commission — Access2Markets (EU tariffs and import rules by product)
- European Commission — EU pesticides database (maximum residue levels)
- European Commission — Food safety
- European Commission — Carbon Border Adjustment Mechanism (CBAM)
- European Chemicals Agency — Understanding REACH
- European Commission — Regulation on deforestation-free products (EUDR)
- Hellenic Food Authority (EFET)
- Independent Authority for Public Revenue, Greece (AADE) — customs
- Department of Commerce — TradeStat export-import data bank
Trade data
India’s exports to Greece in numbers
From the Department of Commerce’s TradeStat (Indian financial years, April–March), the country’s imports from the world from UN Comtrade, and its basics from the World Bank.
- India’s exports here, 2025-26
- US$ 1.07 bn No. 55 of our 80 countries
- Change from 2024-25
- ↑ +1.1% US$ 1.06 bn → US$ 1.07 bn
- Share of all Indian exports
- 0.24%
- Its imports from the world
- —
What India sells here most
By HS chapter, 2025-26. Change is against 2024-25.
What is rising and what is falling
Chapters where India sells at least US$ 5 million. Change from 2024-25 to 2025-26.
↑ High demand
- Animal feed and food residuesUS$ 200k → US$ 6.1 mn↑+2,930%
- Medicines and pharmaUS$ 25.3 mn → US$ 62.4 mn↑+146.8%
- Cereals (rice, wheat, maize)US$ 3.4 mn → US$ 5.9 mn↑+74.8%
- Vehicles and partsUS$ 15.2 mn → US$ 24 mn↑+58.4%
- Coffee, tea, spicesUS$ 25.5 mn → US$ 37.3 mn↑+46.3%
- Fish and seafoodUS$ 53.6 mn → US$ 71.2 mn↑+32.9%
- Inorganic chemicalsUS$ 7.5 mn → US$ 9.6 mn↑+28.2%
- Iron and steel articlesUS$ 24.9 mn → US$ 31.9 mn↑+28.1%
↓ Low demand
- Electrical and electronicsUS$ 227 mn → US$ 135 mn↓-40.5%
- Organic chemicalsUS$ 130 mn → US$ 92.9 mn↓-28.3%
- Woven garmentsUS$ 25.9 mn → US$ 19.1 mn↓-26.4%
- Oilseeds and seedsUS$ 19.5 mn → US$ 15.8 mn↓-19.1%
- TobaccoUS$ 33.5 mn → US$ 27.4 mn↓-18.1%
- Leather goods, bagsUS$ 9.1 mn → US$ 7.5 mn↓-17%
Our product guides that sell here
India’s exports of each product to this country, 2025-26.
The 20 biggest export lines
4-digit HS lines, 2025-26, with their Harmonized System descriptions.
What India buys from Greece
India’s imports from this country in 2025-26 by HS chapter, from TradeStat — this country can be your supplier too.
- India’s imports, 2025-26
- US$ 212 mn US$ 382 mn → US$ 212 mn
- India’s exports, 2025-26
- US$ 1.07 bn
- Trade balance
- +US$ 856 mn exports minus imports
- Change in imports
- -44.5%
The country at a glance
- Population
- 10.4 mn 2025
- GDP
- US$ 280.6 bn 2025
- GDP per person
- US$ 26,948 2025
- Imports (goods and services)
- US$ 123.5 bn 2025
Sources: TradeStat — Export Import Data Bank, Department of Commerce · World Bank — World Development Indicators · Figures taken 29 October 2026.
What to send to Greece
All products →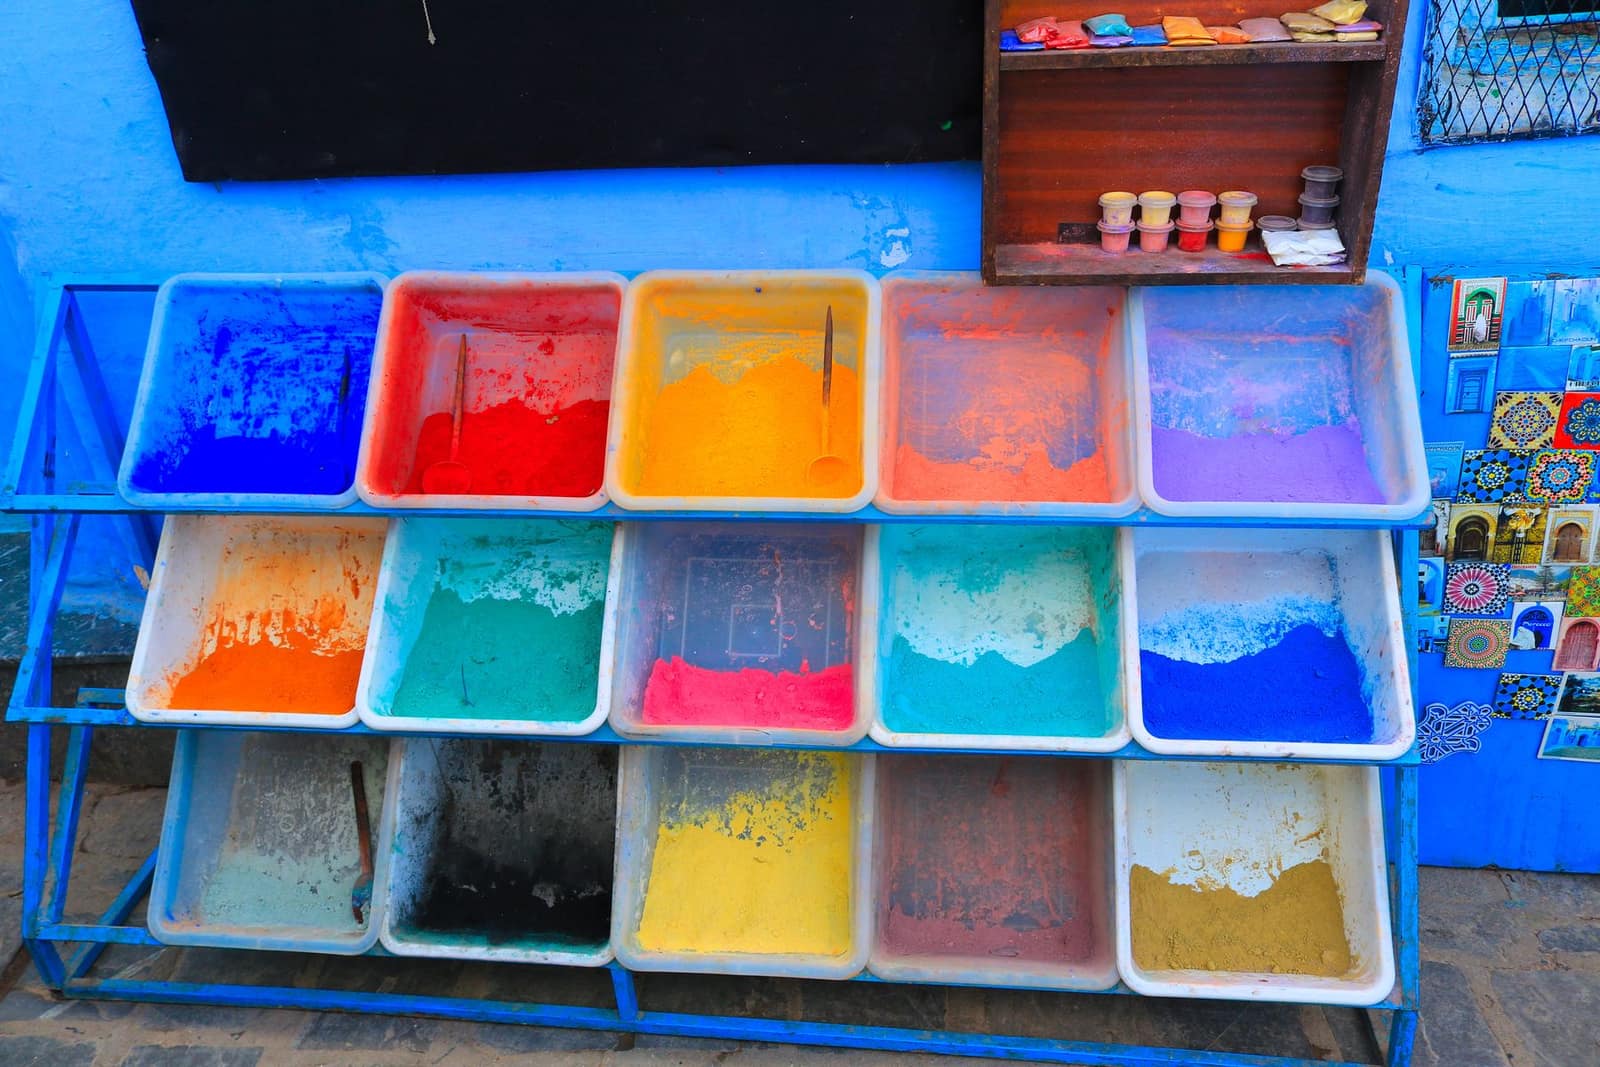 Free to exportPharma & chemicalsDyes and pigmentsReactive and disperse dyes and organic pigments from Gujarat and Maharashtra; textile hubs in Asia and Europe buy them.HS3204Exports 2025-26US$ 2.46 bn ↓8.7%
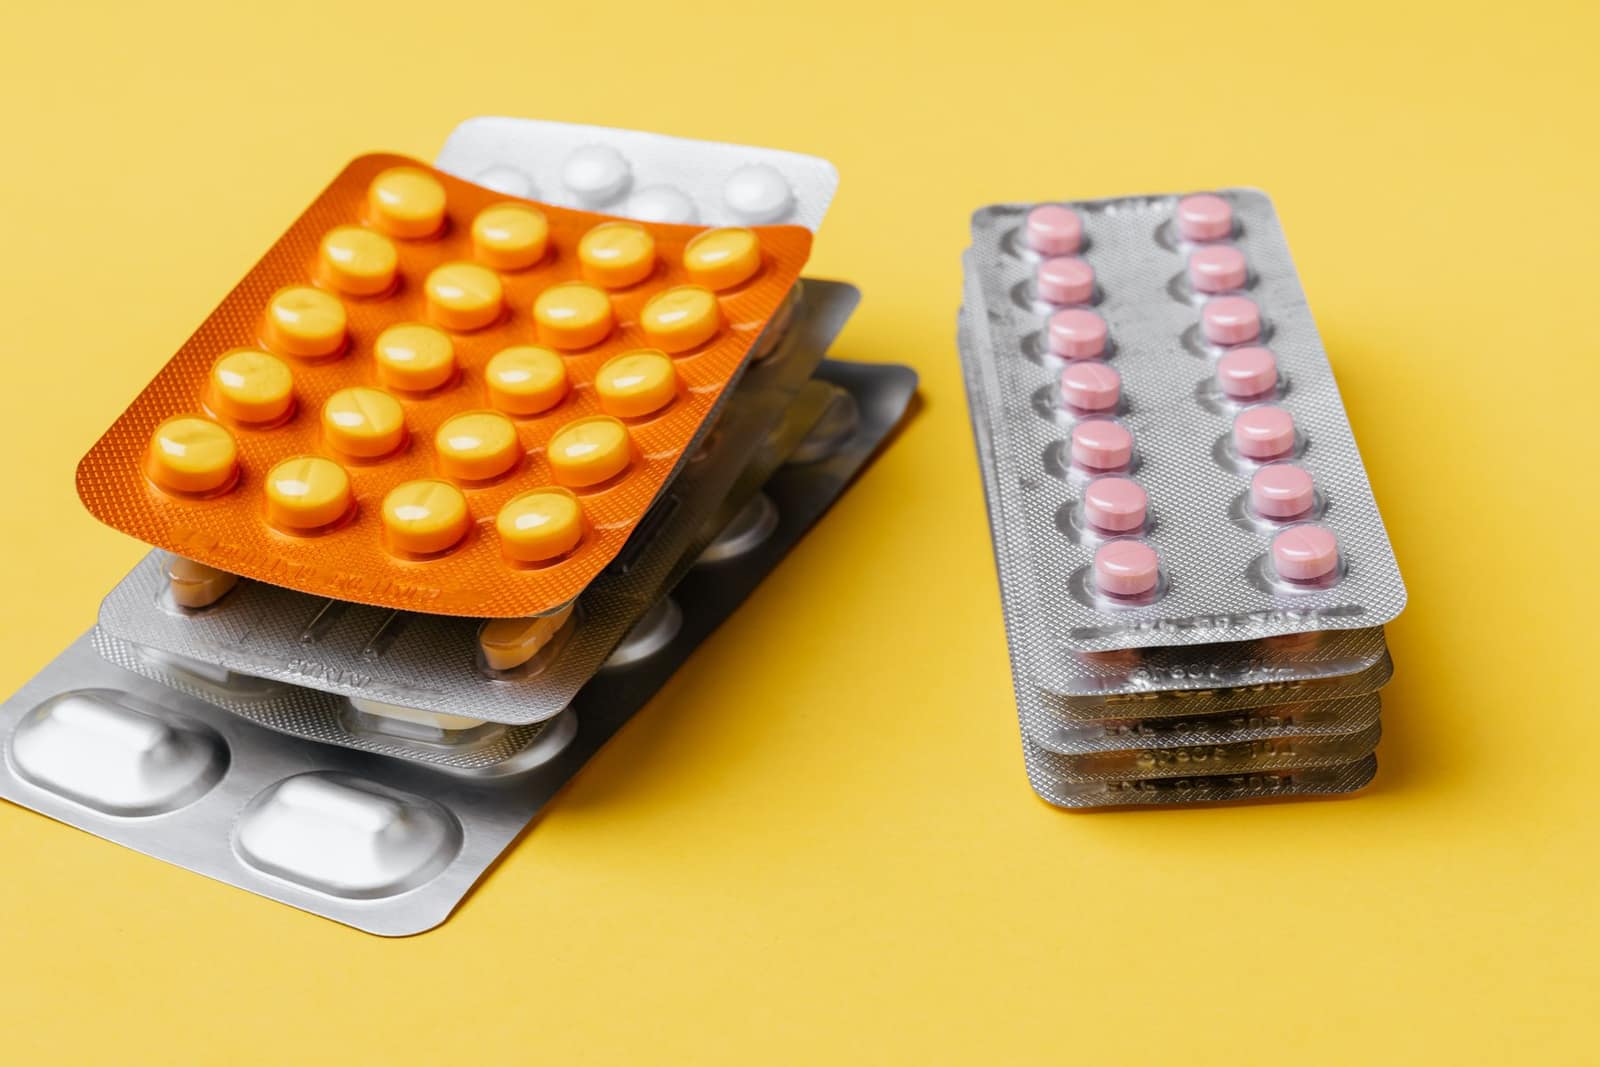 Free to exportPharma & chemicalsGeneric medicines (formulations)Tablets, capsules and injectables; every market needs product registration. The USA buys the most.HS3004Exports 2025-26US$ 21.9 bn ↓0.7%
 Free to exportEngineering goodsSteel pipes and tubesSeamless, line pipe and welded steel pipes; the USA, the Gulf and Canada are the main buyers.HS7304Exports 2025-26US$ 2.32 bn ↑7.2%
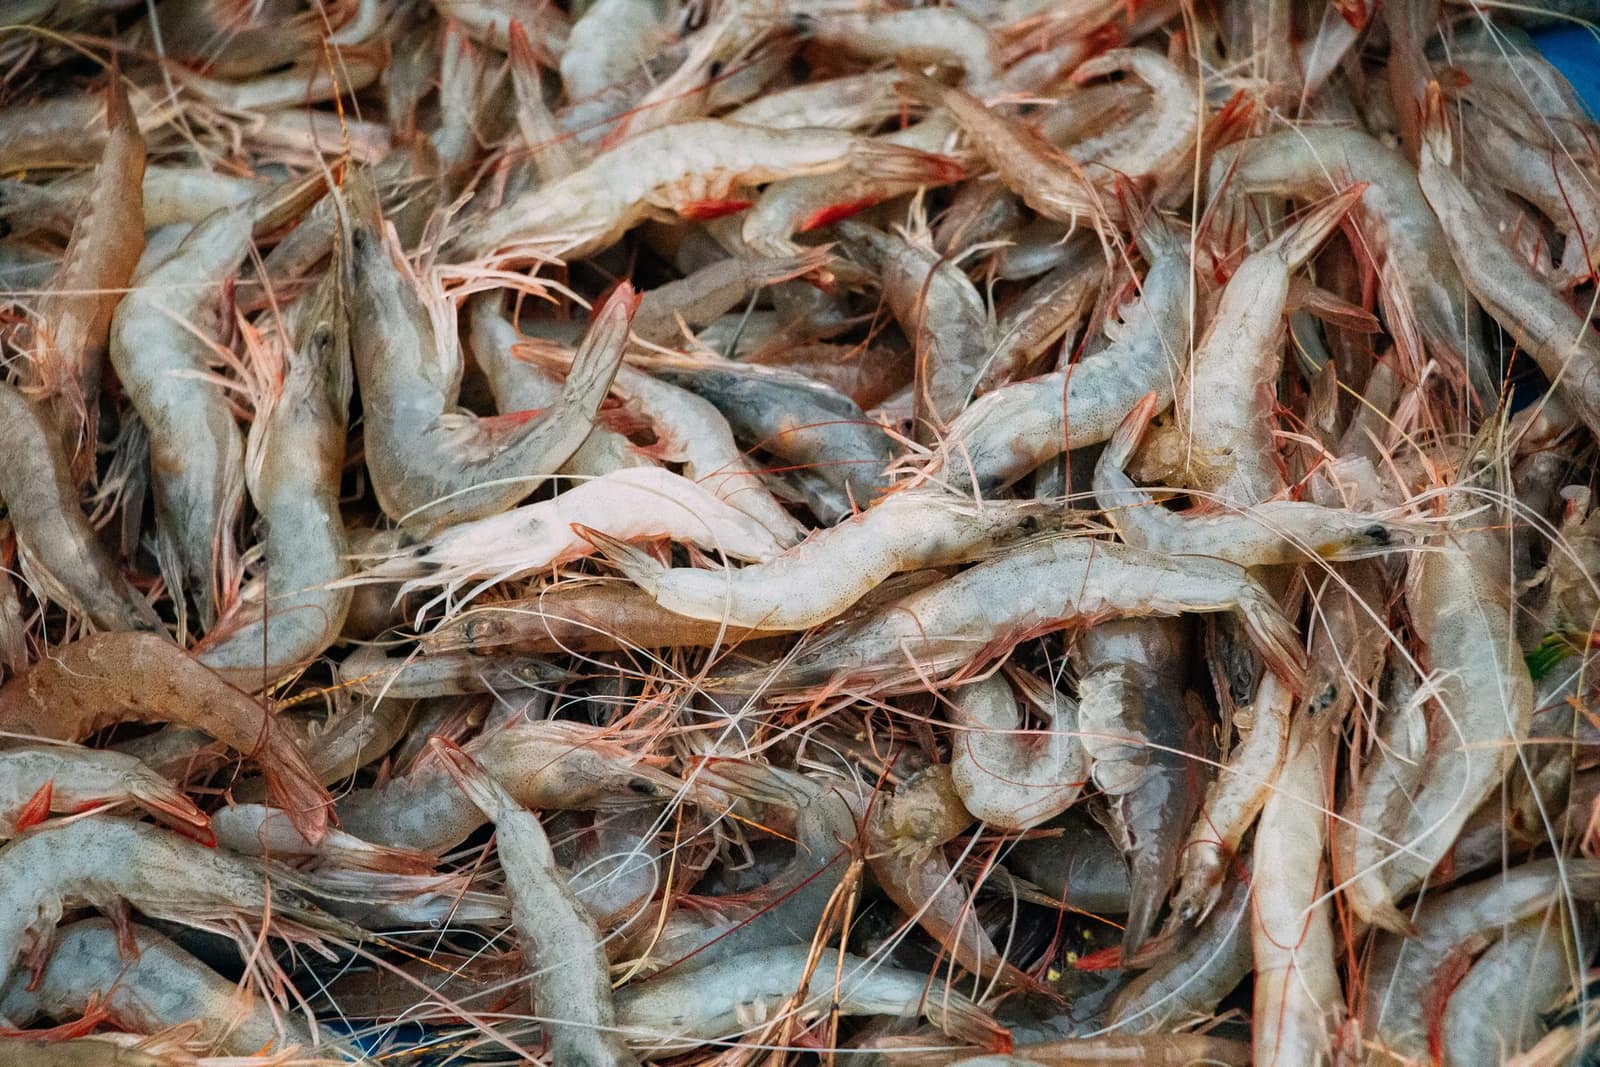 Free to exportMarineFrozen shrimpIndia’s top seafood export. Needs MPEDA registration and an EIC-approved plant; residue testing and US trade measures shape the business.HS0306.17Exports 2025-26US$ 5.61 bn ↑9.1%
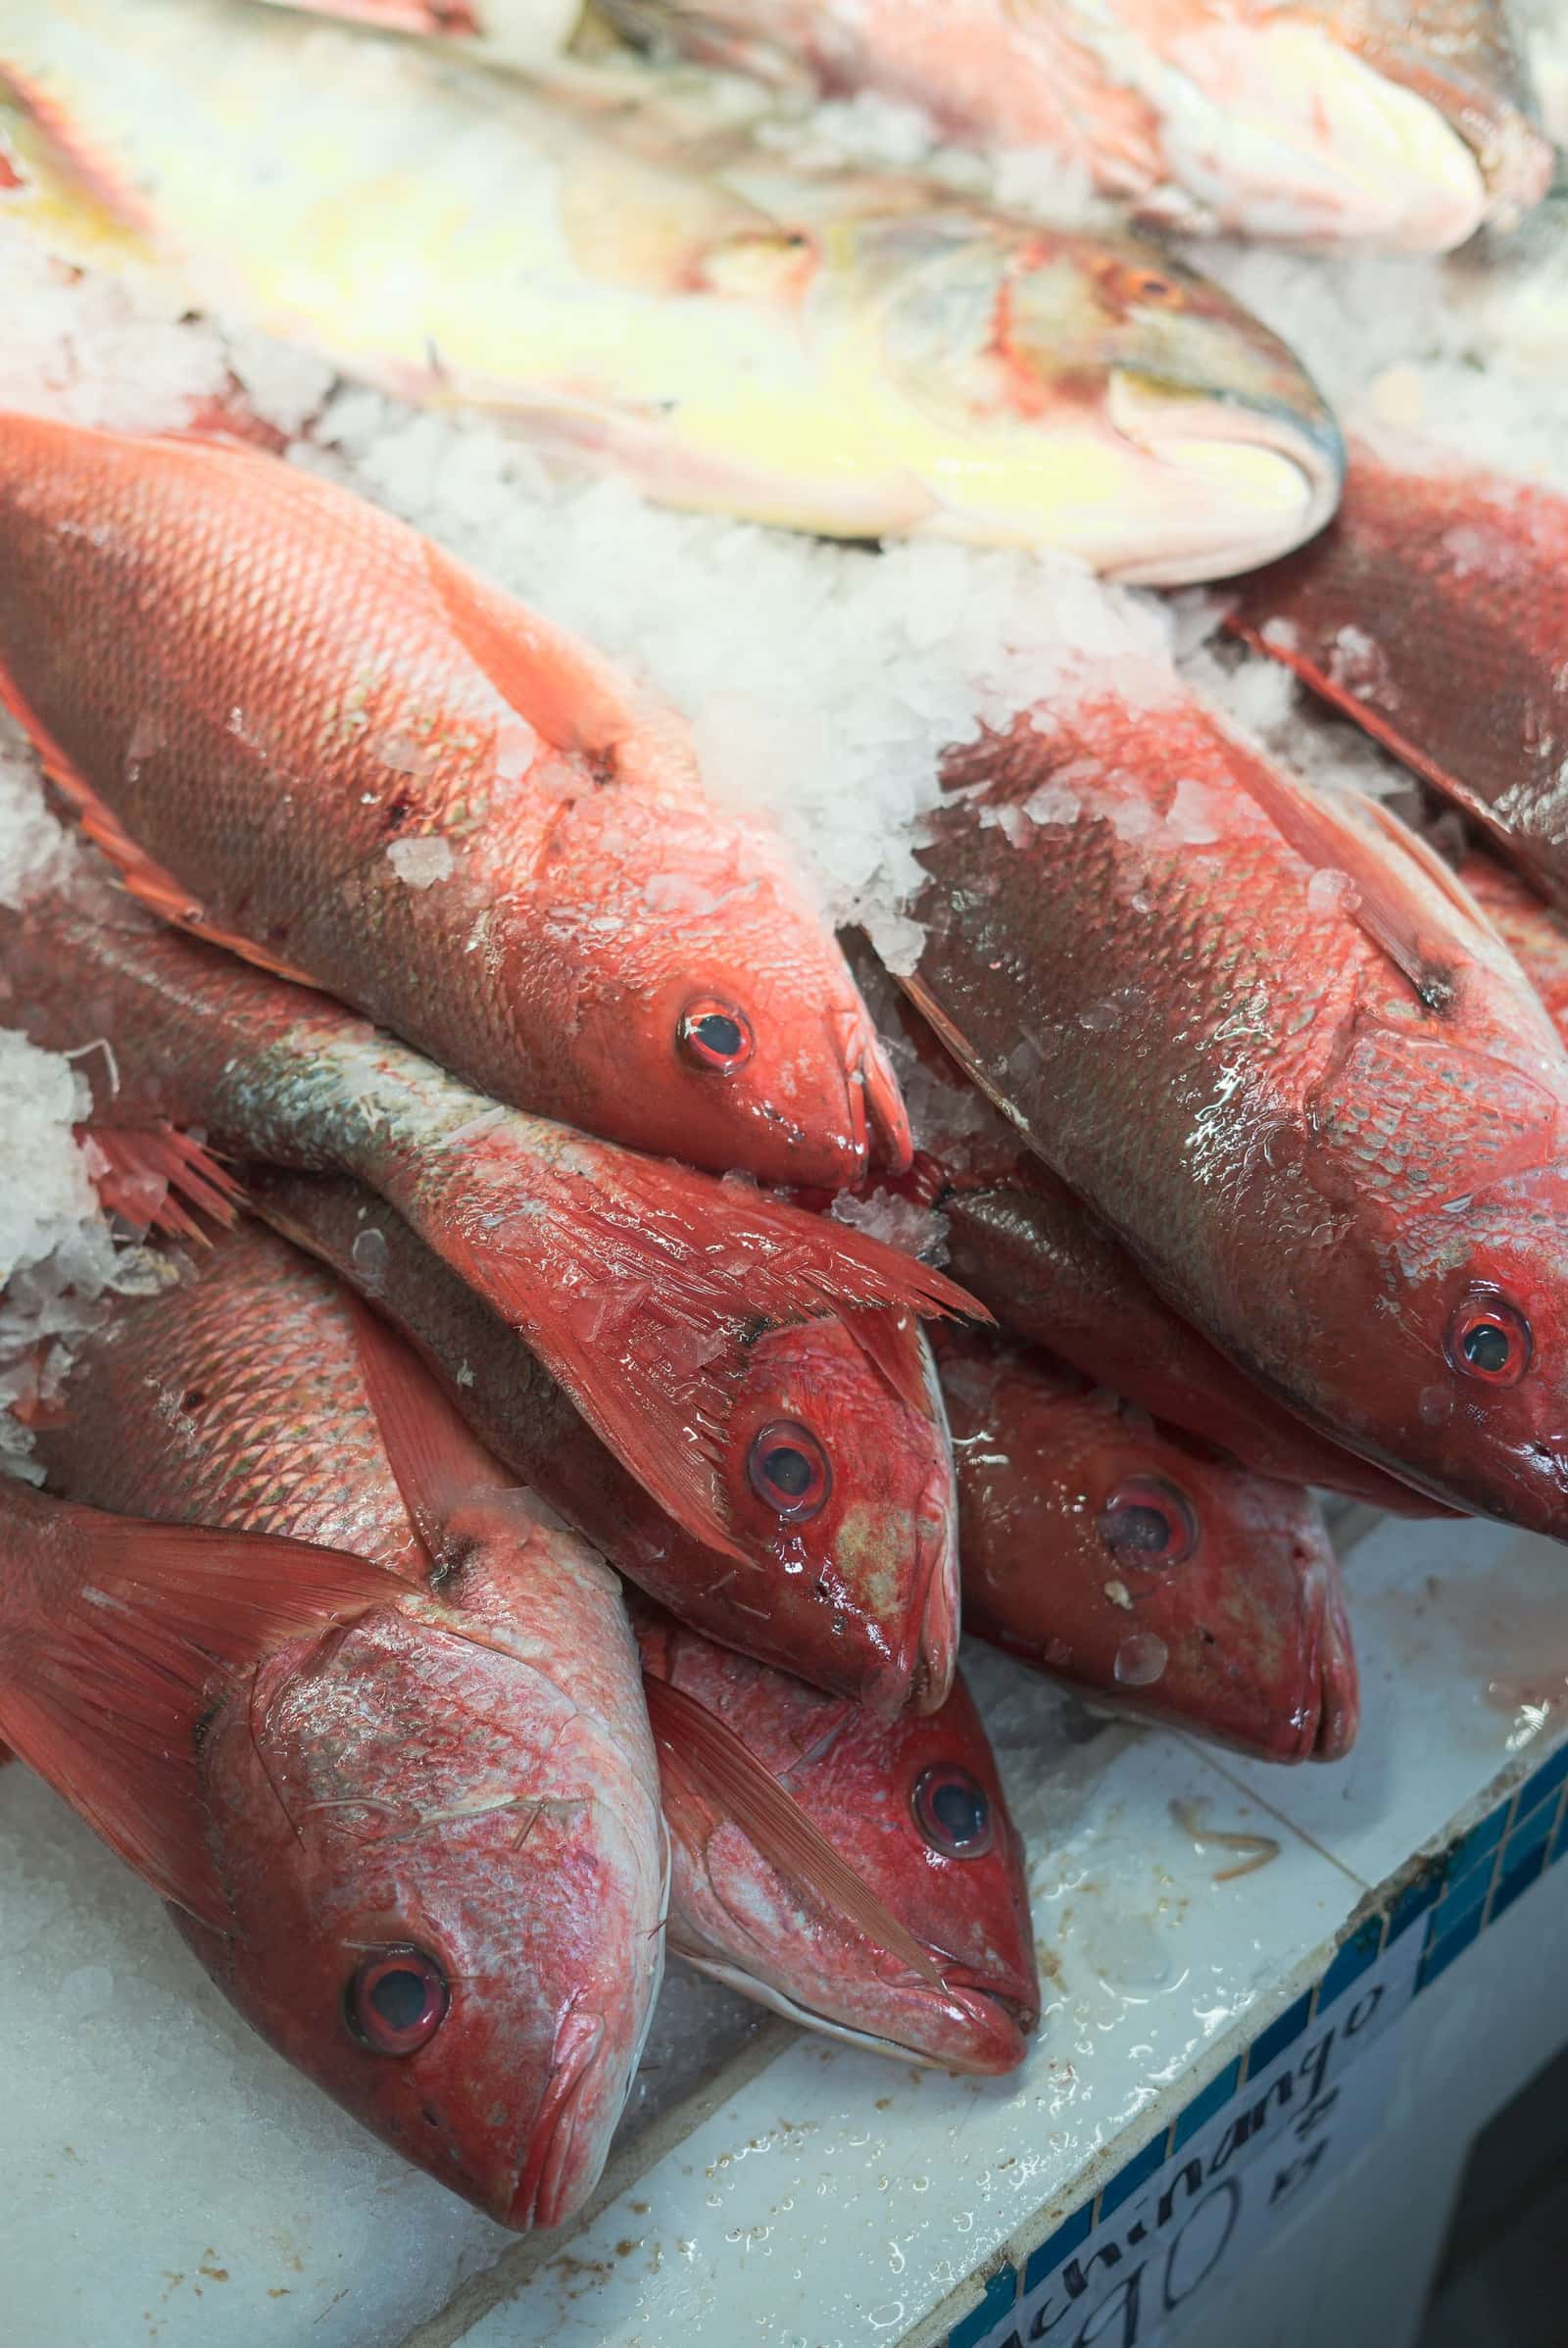 Free to exportMarineFrozen fishIndia’s second-largest seafood export. MPEDA registration, an EIC-approved plant and a health certificate are the gate.HS0303Exports 2025-26US$ 917 mn ↑8.9%
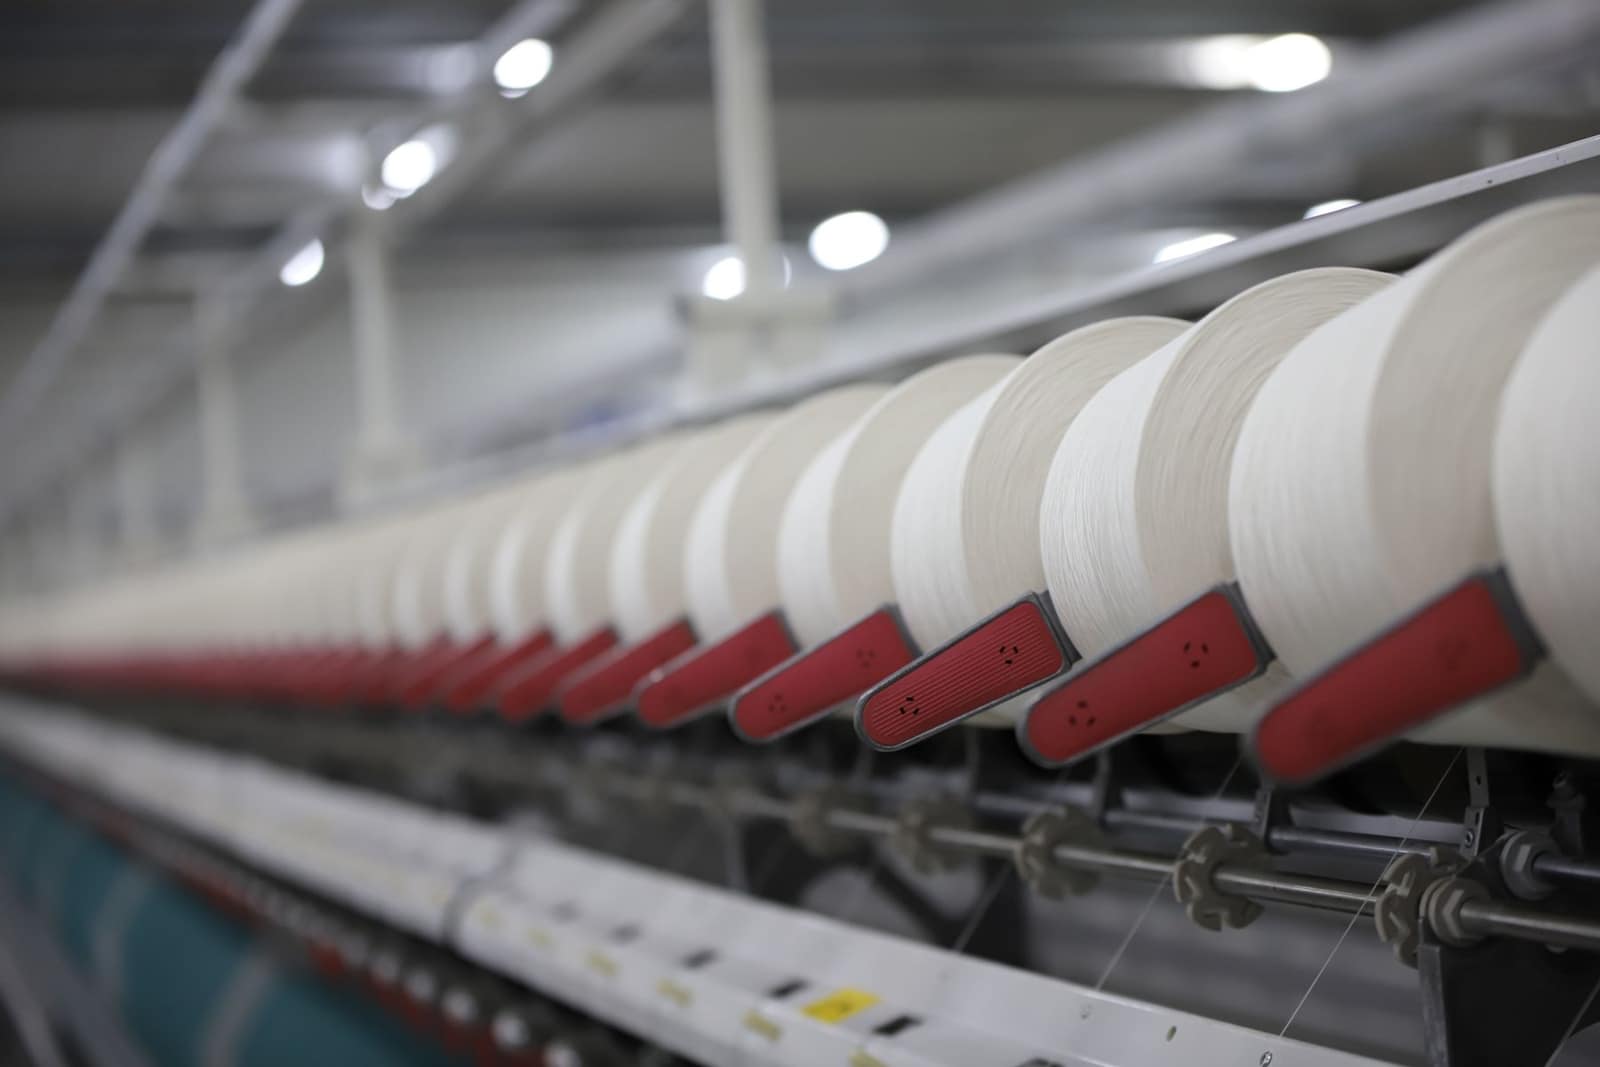 Free to exportTextiles & apparelCotton yarnBulk cotton yarn sold to weaving and knitting mills abroad; Bangladesh is by far the largest buyer.HS5205Exports 2025-26US$ 3.22 bn ↓4.1%
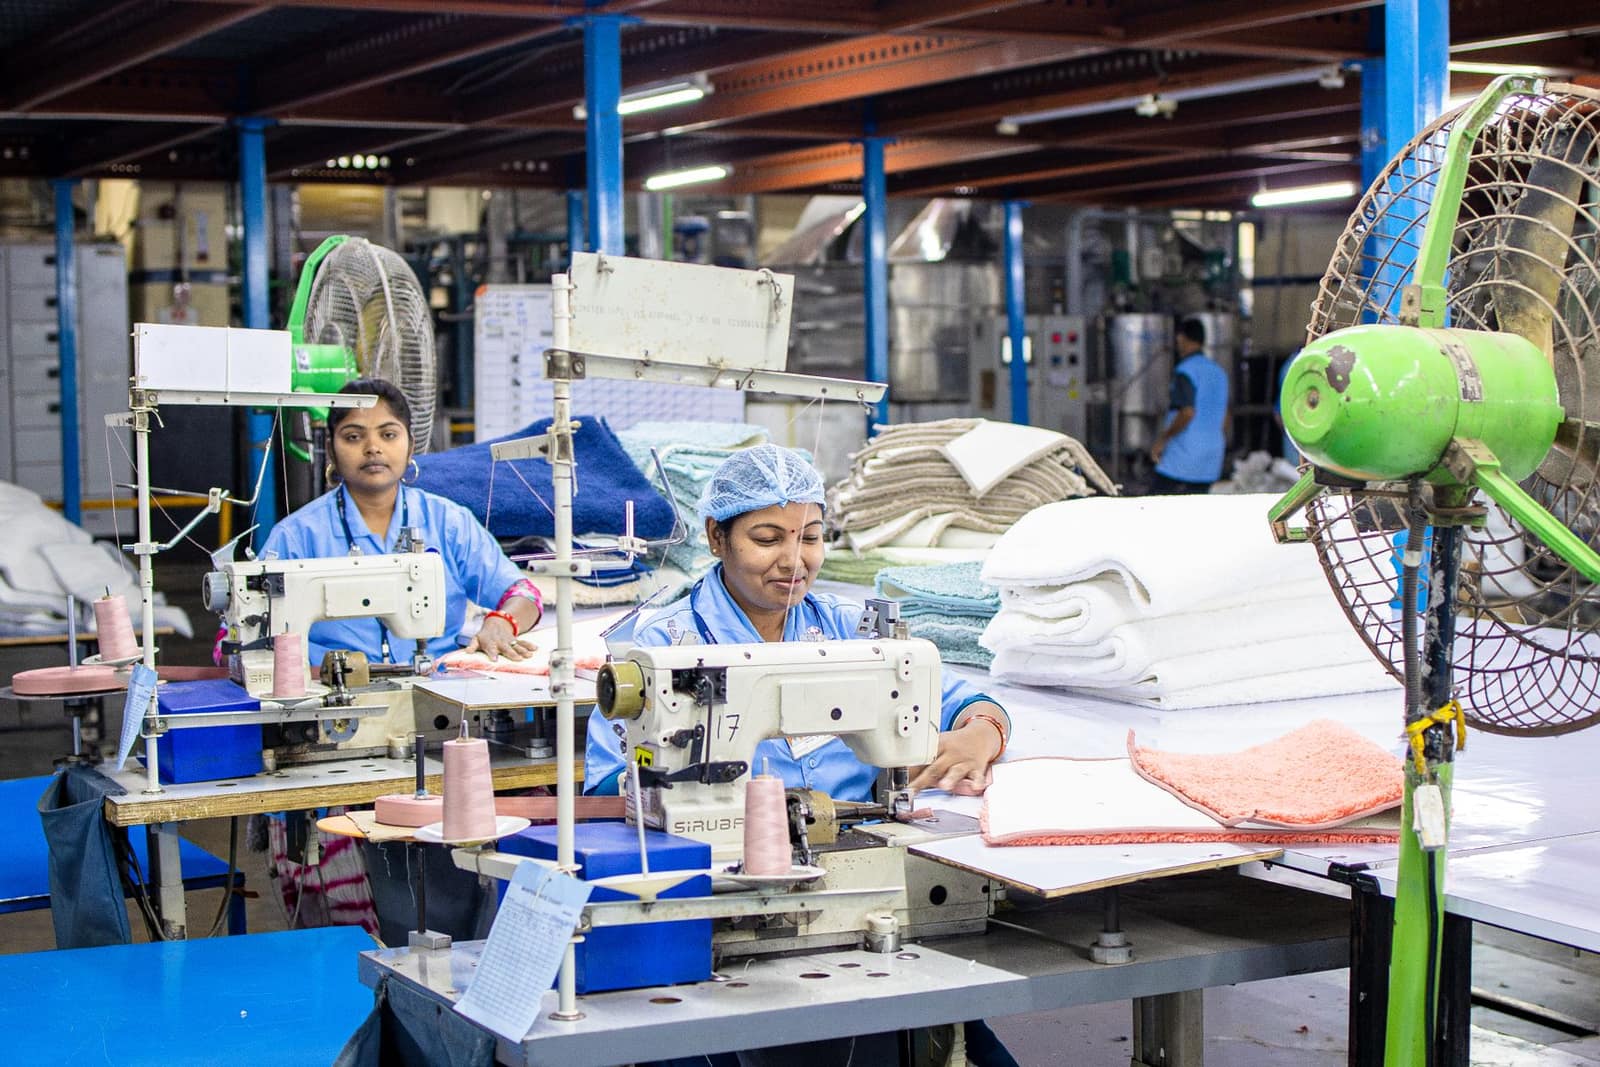 Free to exportTextiles & apparelReadymade garmentsKnitted and woven clothing for brands and retailers; the USA, UK, UAE and the EU are the big buyers.HS6109.10Exports 2025-26US$ 15.8 bn ↓1.2%
 Free to exportOther goodsGranite and natural stonePolished granite slabs, monuments and sandstone from South India and Rajasthan; the USA leads.HS6802Exports 2025-26US$ 1.17 bn ↑0.7%
More in Europe
 CETAGBPLondonUnited KingdomNew CETA in force since July 2026 — most Indian goods now enter duty-free. Strong market for garments, food and engineering.From India 2025-26US$ 13.4 bn
 EURAmsterdamNetherlandsEurope's main gateway: Rotterdam handles goods for the whole EU. EU food-safety and residue rules apply.From India 2025-26US$ 17.5 bn
 EURBerlinGermanyEurope's largest economy and India's biggest EU partner. Values quality, certificates and supply-chain transparency.From India 2025-26US$ 11.5 bn
 EURParisFranceFashion, food and design market. EU rules plus French-language labels; SIAL Paris is a key food fair.From India 2025-26US$ 7.1 bn