

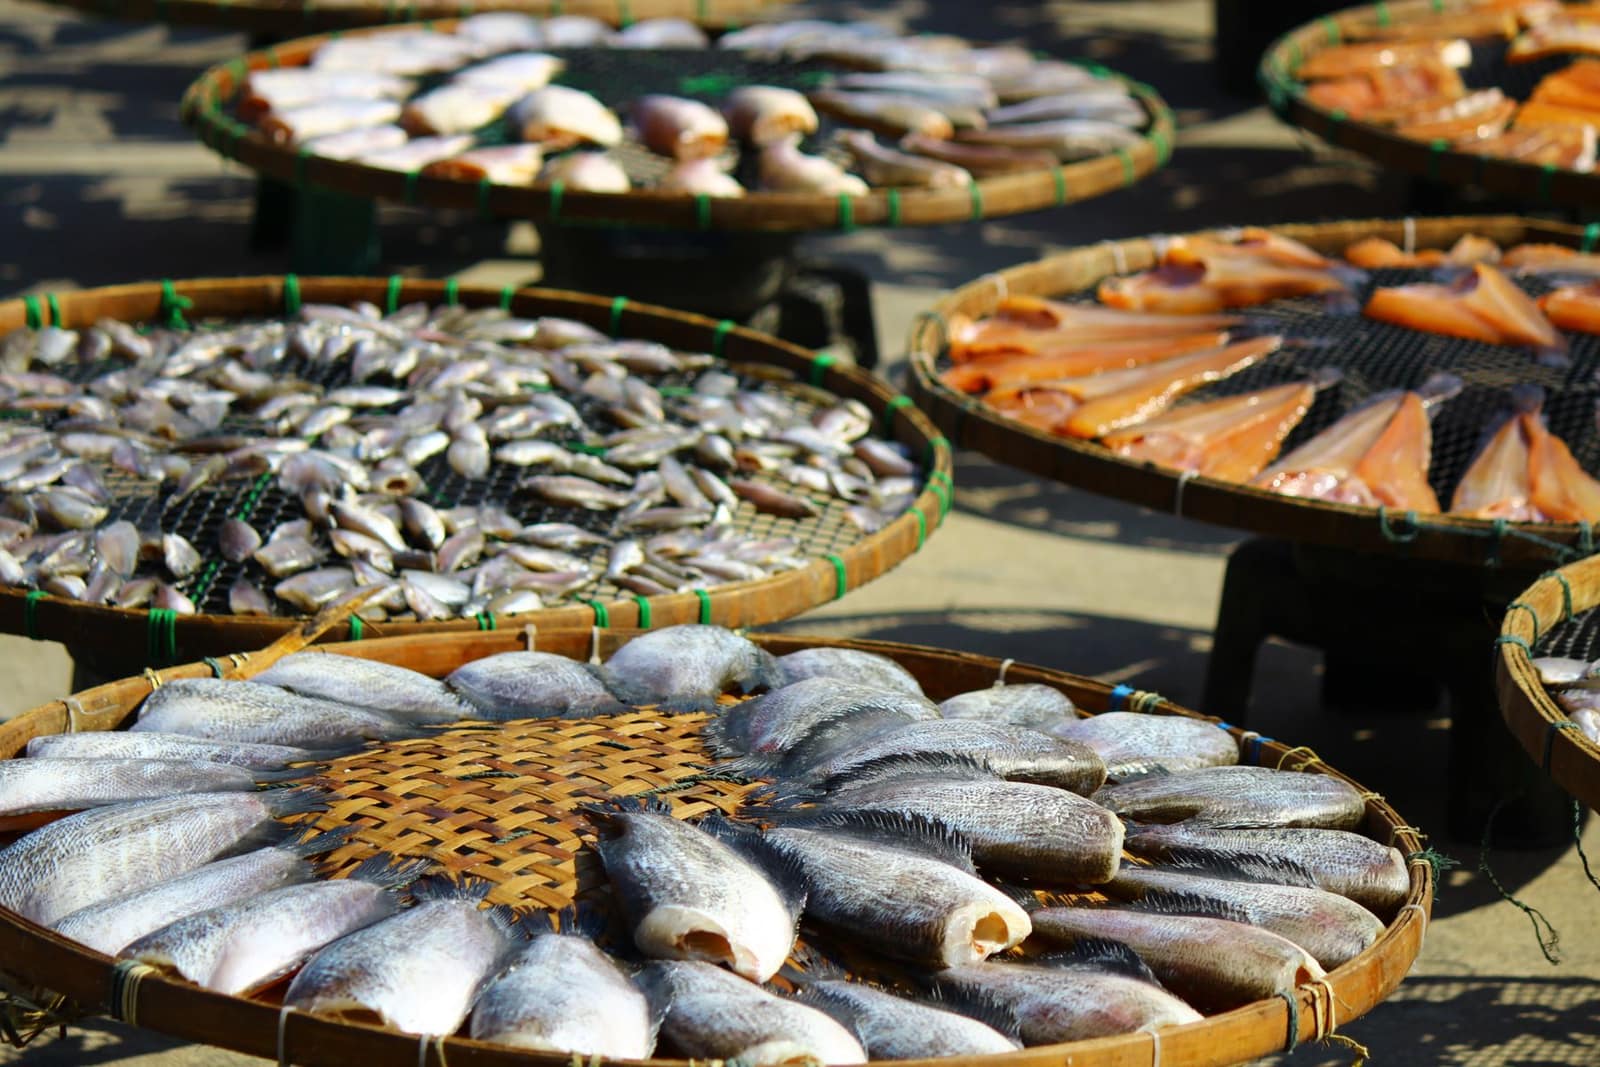
Marine
Export fishmeal and fish oil
Fishmeal and fish oil from sardine and small pelagic fish, sold to feed makers in Asia. The EU route needs an EIC-approved plant.
- HS code
- 2301 Flours, meals and pellets of fish (2301 20) used in aqua and animal feed; fish body oil and fish liver oil fall under 1504.
- Export policy
- Free to export Free under ITC(HS). For the EU, fishmeal and fish oil must come from an EIC-approved establishment with an EIC health certificate. Confirm the 8-digit line on DGFT.
- Registrations
- 4 IEC, GST and those below
- India’s exports, 2025-26
- US$ 608 mn to 37 countries
What is exported
Fishmeal plants on the west coast — Karnataka, Kerala, Goa and Gujarat — turn oil sardine, mackerel and fish processing waste into meal and oil. Most meal goes to aqua-feed and poultry-feed makers in South-East and East Asia; fish oil goes to feed and supplement refiners. Supply swings with the sardine catch, so prices move a lot from year to year.
Varieties, grades and forms
- Fishmeal, 55–60% proteinStandard grade from mixed small fish and processing waste, used in poultry feed.
- Fishmeal, 60–65% protein and aboveSteam-dried meal from whole sardine, preferred by shrimp and fish feed mills.
- Crude fish body oilSardine oil for aqua feed and for refining into omega-3 oils.
- Fish liver oil and refined oilsSmaller volumes for supplements.
Where it is grown or made
- KarnatakaMangaluru, Udupi and Malpe — the largest cluster of fishmeal and oil plants.
- Kerala and GoaPlants near Kochi, Alappuzha and Goa ports.
- GujaratVeraval and Porbandar.
- Tamil Nadu and OdishaThoothukudi and smaller plants on the east coast.
The quality buyers ask for
- Crude protein
- Typically 55–65% or above, as contracted
- Moisture and fat
- Moisture usually below about 10%; fat usually below about 10–12%
- Salt and sand
- Kept low as per contract; price adjusted for excess
- Histamine and TVN
- Within buyer limits as freshness indicators
- Microbiology
- Salmonella absent; Enterobacteriaceae within limits for the EU
Certificates
- EIC approvalOften askedEIC-approved establishment and health certificate for fishmeal and fish oil to the EU and other markets that require it.
- MarinTrustOften askedResponsible-sourcing standard for marine ingredients, asked for by large feed companies.
- RCMCRequiredRegistration with the export promotion council or board for your product (not needed up to ₹3 lakh FOB per consignment since 15 Sep 2026).
- ISO 22000 / FSSC 22000Often askedFood-safety management system certification asked for by larger buyers.
Shipping, storage and shelf life
20-ft or 40-ft dry containers; a 20-ft typically takes about 20–25 tonnes of bagged meal. Fish oil in flexitanks of about 20–24 tonnes.
Sea freight from Mangaluru, Kochi, Mormugao and Mundra.
Cool, dry, ventilated warehouse; meal must be cooled and stabilised to prevent self-heating.
Typically 6–12 months for stabilised meal.
What goes on the pack and carton
- Bags: product name, protein grade, lot, production date, net weight, plant name and approval number, “Not for human consumption” and country of origin.
- Dangerous-goods marking where fishmeal is shipped as a regulated cargo under the IMDG Code — ask your shipping line.
- Every carton or bag: product, grade, lot or batch number, net and gross weight, exporter name and “Made in India” / “Product of India”, matching the invoice and packing list.
EIC/EIA laboratories and EIC-approved labs test seafood and fishmeal for export certification (eicindia.gov.in); MPEDA runs quality-control labs; NABL-accredited private labs are also used (nabl-india.org).
Benefits of exporting this product
- RoDTEP: 2.2% of FOB
Tariff item 2301 20 11 and 2301 20 19 (fishmeal, in powder form and other) earns 2.2% of FOB value, capped at ₹2.6 per kg, as a duty credit scrip on ICEGATE (Appendix 4R). Rates continue to 31 Dec 2026 (DGFT Notification 41/2026-27). Confirm your exact 8-digit line on DGFT before pricing an order.
DGFT — Appendix 4R, RoDTEP schedule for DTA exports w.e.f. 10 Oct 2024 (Notification 32/2024-25) ↗ - RoDTEP: 2.4% of FOB
Tariff item 1504 20 10 to 1504 20 90 (fish body oil, fish lipid oil and other fish oils) earns 2.4% of FOB value, capped at ₹4.1 per kg, as a duty credit scrip on ICEGATE (Appendix 4R). Fish liver oils (1504 10) carry the same rate and cap. Rates continue to 31 Dec 2026 (DGFT Notification 41/2026-27). Confirm your exact 8-digit line on DGFT before pricing an order.
DGFT — Appendix 4R, RoDTEP schedule for DTA exports w.e.f. 10 Oct 2024 (Notification 32/2024-25) ↗
Where to register
- MPEDAExporter registration (manufacturer or merchant exporter) and RCMC under the MPEDA Act, 1972. Every exporter of marine products must be registered.e-mpeda.nic.in ↗
- Export Inspection Council (EIC)Approval of the processing plant and a health certificate (Certificate for Export) for each consignment to markets that require it, such as the EU and China.eicindia.gov.in ↗
Quality and checks
- Crude protein, fat, moisture, salt/sand and histamine to the contract; buyers test on arrival.
- Salmonella-negative results and an antioxidant (such as ethoxyquin) where the buyer’s country allows it; the EU has suspended ethoxyquin in feed, so ask before using it.
- Fish oil: free fatty acids, peroxide value, dioxins and PCBs for feed and supplement use.
Buy from an established fishmeal plant in Mangaluru, Udupi or Veraval that already ships to Asia, and sell one container of 60–65% protein meal to an aqua-feed mill on LC. Agree the protein and moisture basis and the testing lab in the contract. Since 15 September 2026, a consignment worth up to ₹3 lakh FOB does not need an RCMC (DGFT Notification 36/2026-27). Registrations that a law requires for the product still apply.
Where new exporters go wrong
- Hot, poorly stabilised meal can self-heat and catch fire in the container; insist on proper cooling and antioxidant treatment as the buyer allows.
- Protein falling short of the contract after sand or salt contamination — the price is cut per percentage point.
- Sending meal to the EU from a plant that is not on the EU-approved list.
Documents this product needs
Schemes that apply
Sources (5)
- DGFT — ITC(HS) export policy search (Schedule 2)
- MPEDA — Become an exporter (registration)
- EIC — Export of fresh, frozen and processed fish and fishery products
- DGFT — Appendix 4R, RoDTEP schedule for DTA exports w.e.f. 10 Oct 2024 (Notification 32/2024-25)
- Department of Commerce — TradeStat export data by commodity and country
Trade data
Indian fishmeal and fish oil exports in numbers
From the Department of Commerce’s TradeStat, country by country. US$, Indian financial years (April–March).
- Exports in 2025-26
- US$ 608 mn +47.6% a year on average, 2020-21 to 2025-26
- Change from 2024-25
- ↑ +91.8% US$ 317 mn → US$ 608 mn
- Buyer countries
- 37
- Average export price
- US$ 1.41 per kg · 4,31,823 tonnes shipped · US$ 1.31 the year before
The price cycle
India’s average export price per kg each year (total value ÷ total quantity). Highest in 2022-23, lowest in 2021-22 — a 59% swing between them. Keep this swing in mind when you quote.
What next: a projection from the trend
The past trend carried forward — not a forecast by any authority. Sudden changes in policy, prices or demand are not in it.
Likely range US$ 666 mn to US$ 3.46 bn.
- Trend
- +46.8% a year
- Fit (R²)
- 0.69
- Based on
- 6 years of official figures
Method: a straight line through the logarithm of yearly exports (log-linear regression); range = ±1 standard error.
Biggest buyer countries
By value in 2025-26. Change is against 2024-25.
Where demand is rising and falling
Only countries that buy at least US$ 1 million or 1% of India’s exports of this product. Change from 2024-25 to 2025-26.
↑ High demand
↓ Low demand
- ChileUS$ 13.6 mn → US$ 6.9 mn↓-49.2%
- OmanUS$ 7.6 mn → US$ 4.5 mn↓-41.1%
- Saudi ArabiaUS$ 14 mn → US$ 9.2 mn↓-34.1%
New buyers: Countries that bought nothing from India in 2024-25 and did in 2025-26.
- Denmark · US$ 79 mn
Which forms sell, and at what price
India’s exports by 8-digit tariff line, 2025-26. Average price = total value ÷ total quantity (TradeStat): the average of every shipment on that line, not the price of any one deal.
| Tariff line | Value 2025-26 | Change | Quantity | Average price |
|---|---|---|---|---|
Powder fish meal,unft for human consumption2301 20 11 · Flours, meals and pellets, of fish or of crustaceans, molluscs or other aquatic invertebrates | US$ 496 mn | ↑+90.5% | 3,58,335 tonnes | US$ 1.38 per kgwas US$ 1.26 |
Fish body oil (e.g. sardine oil)1504 20 10 · Fats and oils and their fractions, of fish, | US$ 99 mn | ↑+136.8% | 38,895 tonnes | US$ 2.54 per kgwas US$ 2.51 |
Other fish,meal,unft for human consumption2301 20 19 · Flours, meals and pellets, of fish or of crustaceans, molluscs or other aquatic invertebrates | US$ 8.1 mn | ↑+14.1% | 16,719 tonnes | US$ 0.48 per kgwas US$ 0.50 |
Flr meals etc. of other aquatic invertebrats2301 20 90 · Flours, meals and pellets, of fish or of crustaceans, molluscs or other aquatic invertebrates | US$ 2.4 mn | ↑+136.9% | 15,713 tonnes | US$ 0.16 per kgwas US$ 0.63 |
Fats and oils and their fractions, of fish, — fish lipid oil1504 20 20 | US$ 1.1 mn | ↓-78.2% | 198 tonnes | US$ 5.77 per kgwas US$ 10.42 |
Meat meals and pellets(including tankage)2301 10 10 · Flours, meals and pellets, of meat or meat offal, greaves | US$ 1.1 mn | ↑+89.8% | 1,523 tonnes | US$ 0.74 per kgwas US$ 0.98 |
Other fats and oils other than liver oils1504 20 90 · Fats and oils and their fractions, of fish, | US$ 310k | ↓-48.3% | 179 tonnes | US$ 1.73 per kgwas US$ 1.97 |
Other meat mealsandpellets (includinguding greves2301 10 90 · Flours, meals and pellets, of meat or meat offal, greaves | US$ 100k | ↓-69.7% | 248 tonnes | US$ 0.40 per kgwas US$ 0.53 |
Codliver oil(commercial quality)1504 10 10 · Oils of fish, fish-liver oils and their fractions, whether or not refined, but not chemically modified | US$ 80k | ↑+33.3% | 13 tonnes | US$ 6.23 per kgwas US$ 2.22 |
Other fish liver oil and their frac1504 10 99 · Oils of fish, fish-liver oils and their fractions, whether or not refined, but not chemically modified | US$ 0 | ↓-100% | 0.0 tonnes | — |
The world market
Each country’s own recorded exports and imports in UN Comtrade, 2023 (the latest year nearly every country has reported).
- World imports
- US$ 14.4 bn 2023
- India among exporters
- #5 of 120 countries
- India’s share of world exports
- 5% US$ 623 mn
- Left for others to win
- US$ 11.8 bn exported by other countries
Top exporters — your competitors
- 1USAUS$ 1.34 bn 10.8%
- 2PeruUS$ 1.16 bn 9.4%
- 3ChileUS$ 874 mn 7%
- 4DenmarkUS$ 752 mn 6.1%
- 5IndiaUS$ 623 mn 5%
- 6Viet NamUS$ 617 mn 5%
- 7IcelandUS$ 509 mn 4.1%
- 8NorwayUS$ 497 mn 4%
- 9ChinaUS$ 457 mn 3.7%
- 10MoroccoUS$ 450 mn 3.6%
Biggest buyers in the world
- 1ChinaUS$ 3.86 bn 26.9%
- 2NorwayUS$ 1.4 bn 9.8%
- 3Viet NamUS$ 736 mn 5.1%
- 4USAUS$ 578 mn 4%
- 5DenmarkUS$ 547 mn 3.8%
- 6TürkiyeUS$ 544 mn 3.8%
- 7ChileUS$ 522 mn 3.6%
- 8IndonesiaUS$ 457 mn 3.2%
- 9United KingdomUS$ 418 mn 2.9%
- 10FranceUS$ 381 mn 2.7%
Opportunity: what these countries buy from the world, and from India
Each country’s own recorded imports in UN Comtrade, latest year it has reported. The long light part of each bar is demand other countries are filling today.
TradeStat’s 2023-24 quantities are double-counted, so that year is left out of the price. Sources: TradeStat — Export Import Data Bank, Department of Commerce · UN Comtrade database (United Nations Statistics Division) · Figures taken 29 October 2026.
Step by step
How to export fishmeal and fish oil
World fishmeal trade is led by Peru, Chile, Vietnam, Mauritania and others, with China the largest buyer. India is a mid-sized exporter whose output swings with the oil-sardine catch on the west coast. Demand comes mainly from the fast-growing shrimp and fish farming industries of Asia. Openings are in higher-protein steam-dried meal, traceable raw material, and fish oil for omega-3 refining.
- 01Choose the plant
Work with a plant that has steady raw material, lab testing and, for the EU, EIC approval.
- 02Agree the contract basis
Fix protein, moisture, fat, salt/sand limits, price adjustments and the independent surveyor.
- 03Produce and stabilise
Cook, press, dry, cool and treat the meal as the buyer’s country allows; then bag it.
- 04Survey and certify
Get sampling and analysis by a surveyor and, where needed, the EIC health certificate.
- 05Book, stuff and file the shipping bill
Book the container, stuff it at the factory or a CFS, file the shipping bill on ICEGATE with the correct 8-digit code and the RoDTEP/RoSCTL declaration, and get the bill of lading.
- 06Get paid and close the file
Send the original documents through your bank (or to the buyer if paid in advance). Once the money arrives, get the e-BRC and claim RoDTEP, RoSCTL or drawback where they apply.
Meet buyers
Trade fairs
- March, every two years (odd years)VIV AsiaBangkokvivasia.nl ↗
- Late January or FebruaryInternational Production & Processing Expo (IPPE)Atlantaippexpo.org ↗
- About every two years; MPEDA announces datesIndia International Seafood Show (MPEDA and SEAI)India (venue changes)mpeda.gov.in ↗
- April or MaySeafood Expo GlobalBarcelonaseafoodexpo.com ↗
Questions
Questions about exporting fishmeal and fish oil
Is fishmeal a marine product for MPEDA?
Why are prices so volatile?
Can fishmeal catch fire?
Can I ship fishmeal to the EU?
What RoDTEP applies?
Who buys Indian fishmeal and fish oil
All countries →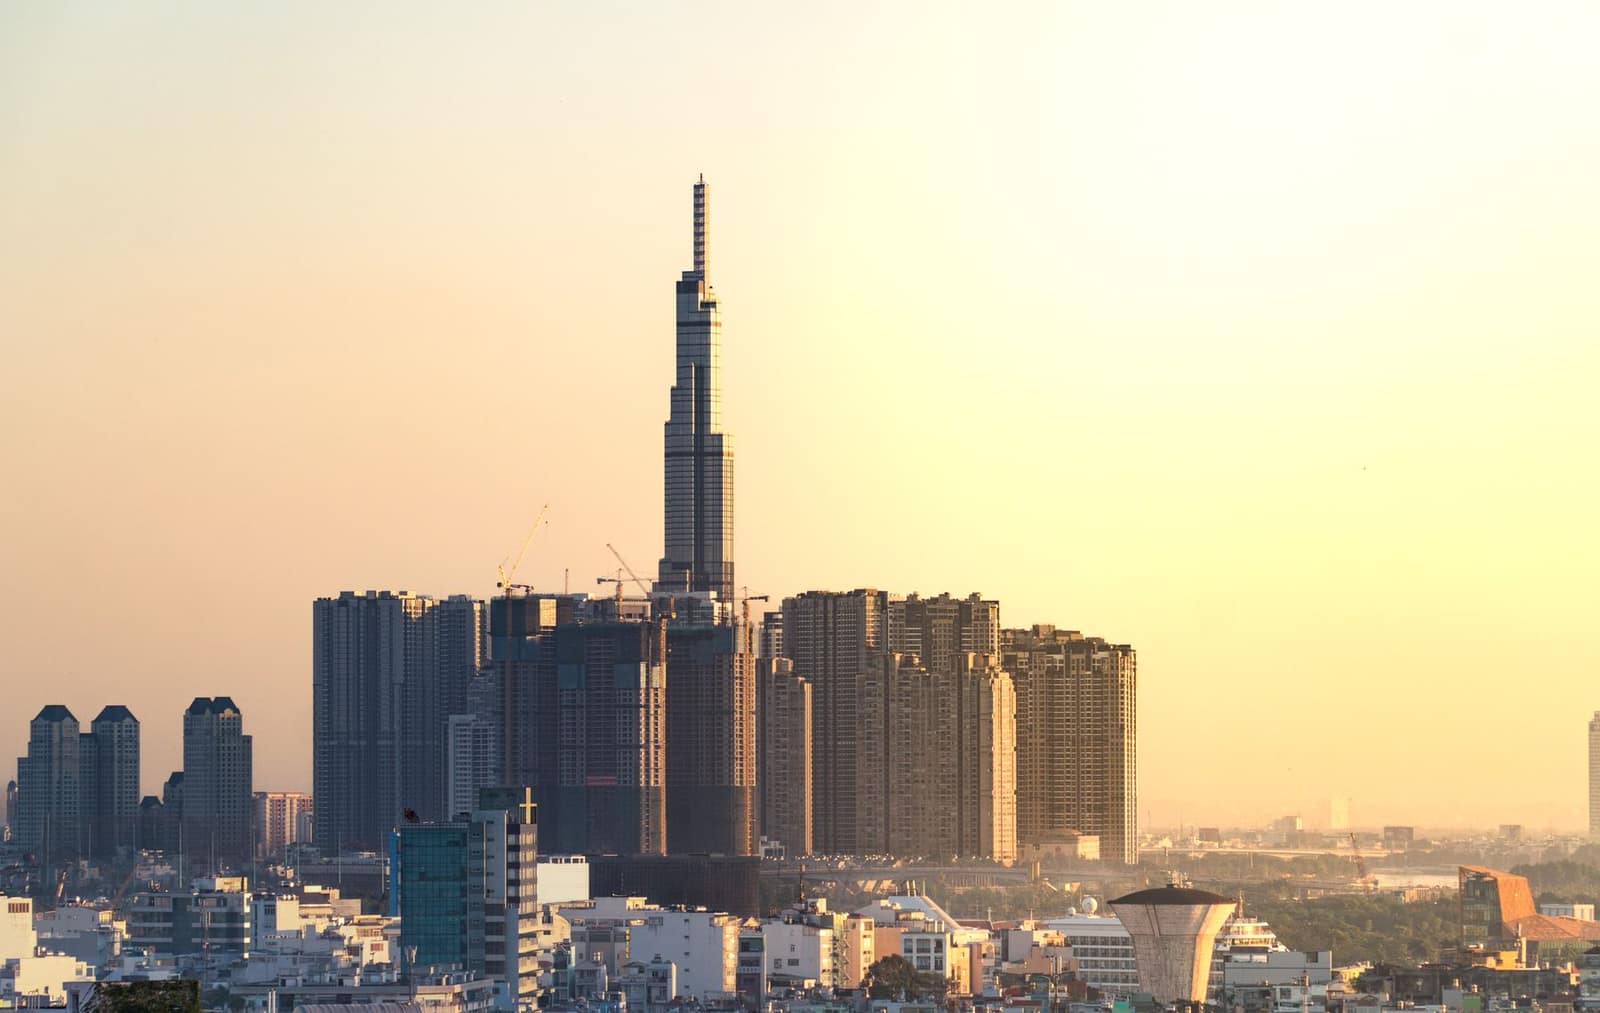 AITIGAVNDHanoiVietnamFast-growing manufacturing economy buying raw materials, yarn, steel, chemicals and feed ingredients from India.From India 2025-26US$ 6.67 bn
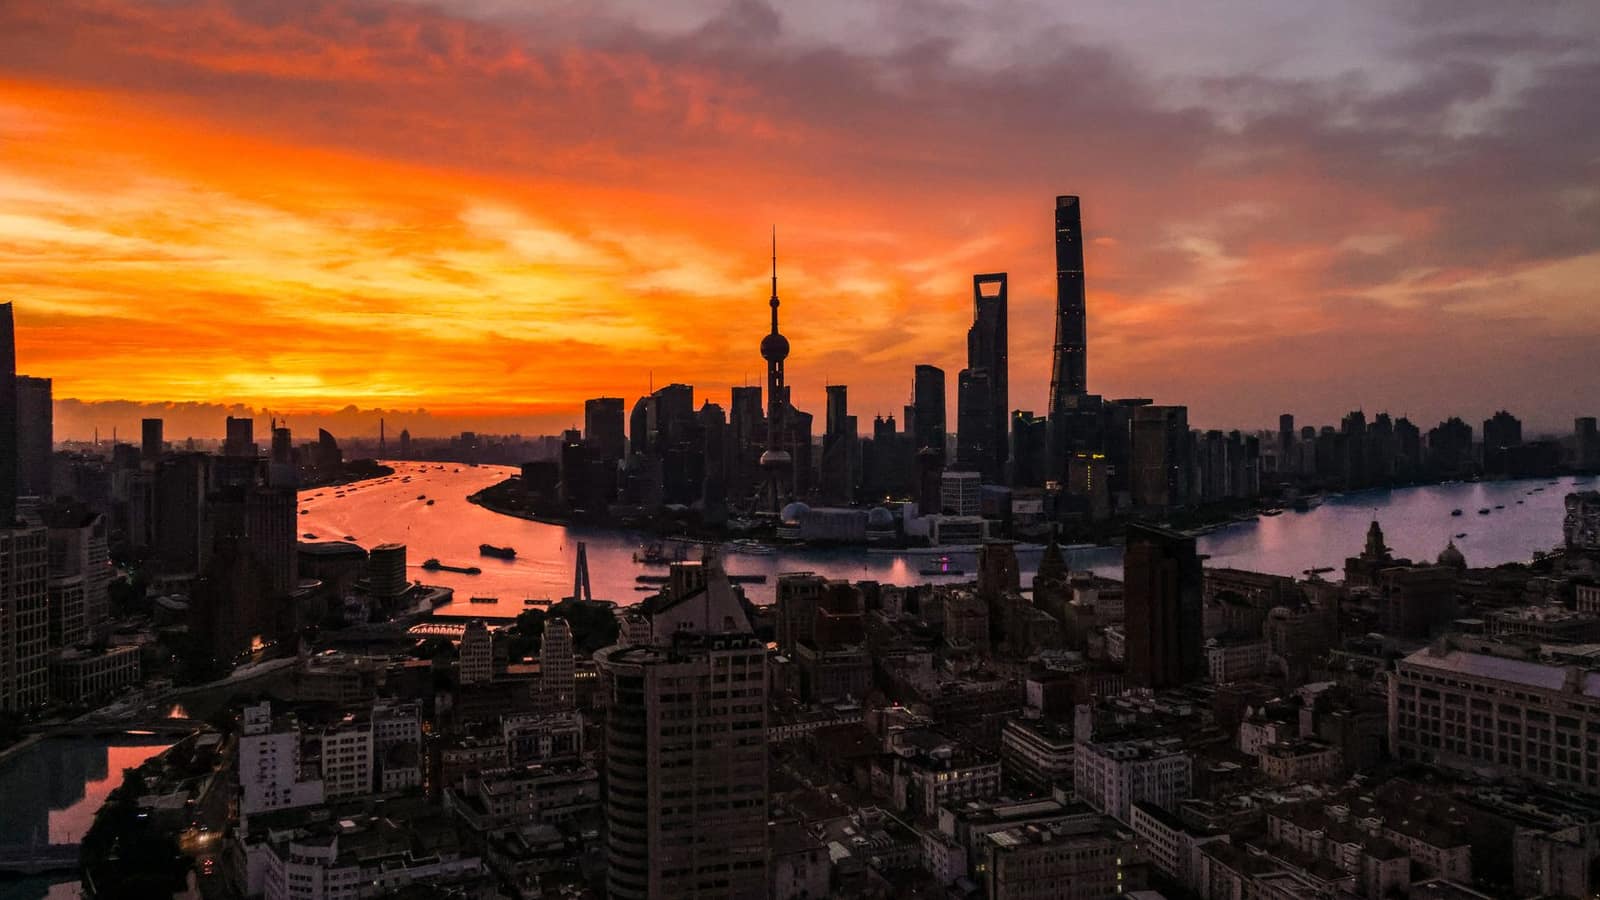 APTACNYBeijingChinaHuge market, but mostly for raw materials. Food plants must be registered with GACC; fresh produce needs a protocol.From India 2025-26US$ 19.5 bn
 SAFTABDTDhakaBangladeshBig neighbour market for cotton, yarn, food and machinery. Mostly LC-based; land and sea routes.From India 2025-26US$ 10.6 bn
 AITIGAIDRJakartaIndonesiaWorld's fourth most populous country. Buys Indian vehicles, steel, chemicals, groundnuts and meat; halal and BPOM rules for food.From India 2025-26US$ 4.49 bn
 CEPAJPYTokyoJapanHigh-value, quality-obsessed market. Buys shrimp, chemicals, auto parts and garments; strict food-sanitation checks.From India 2025-26US$ 6.04 bn
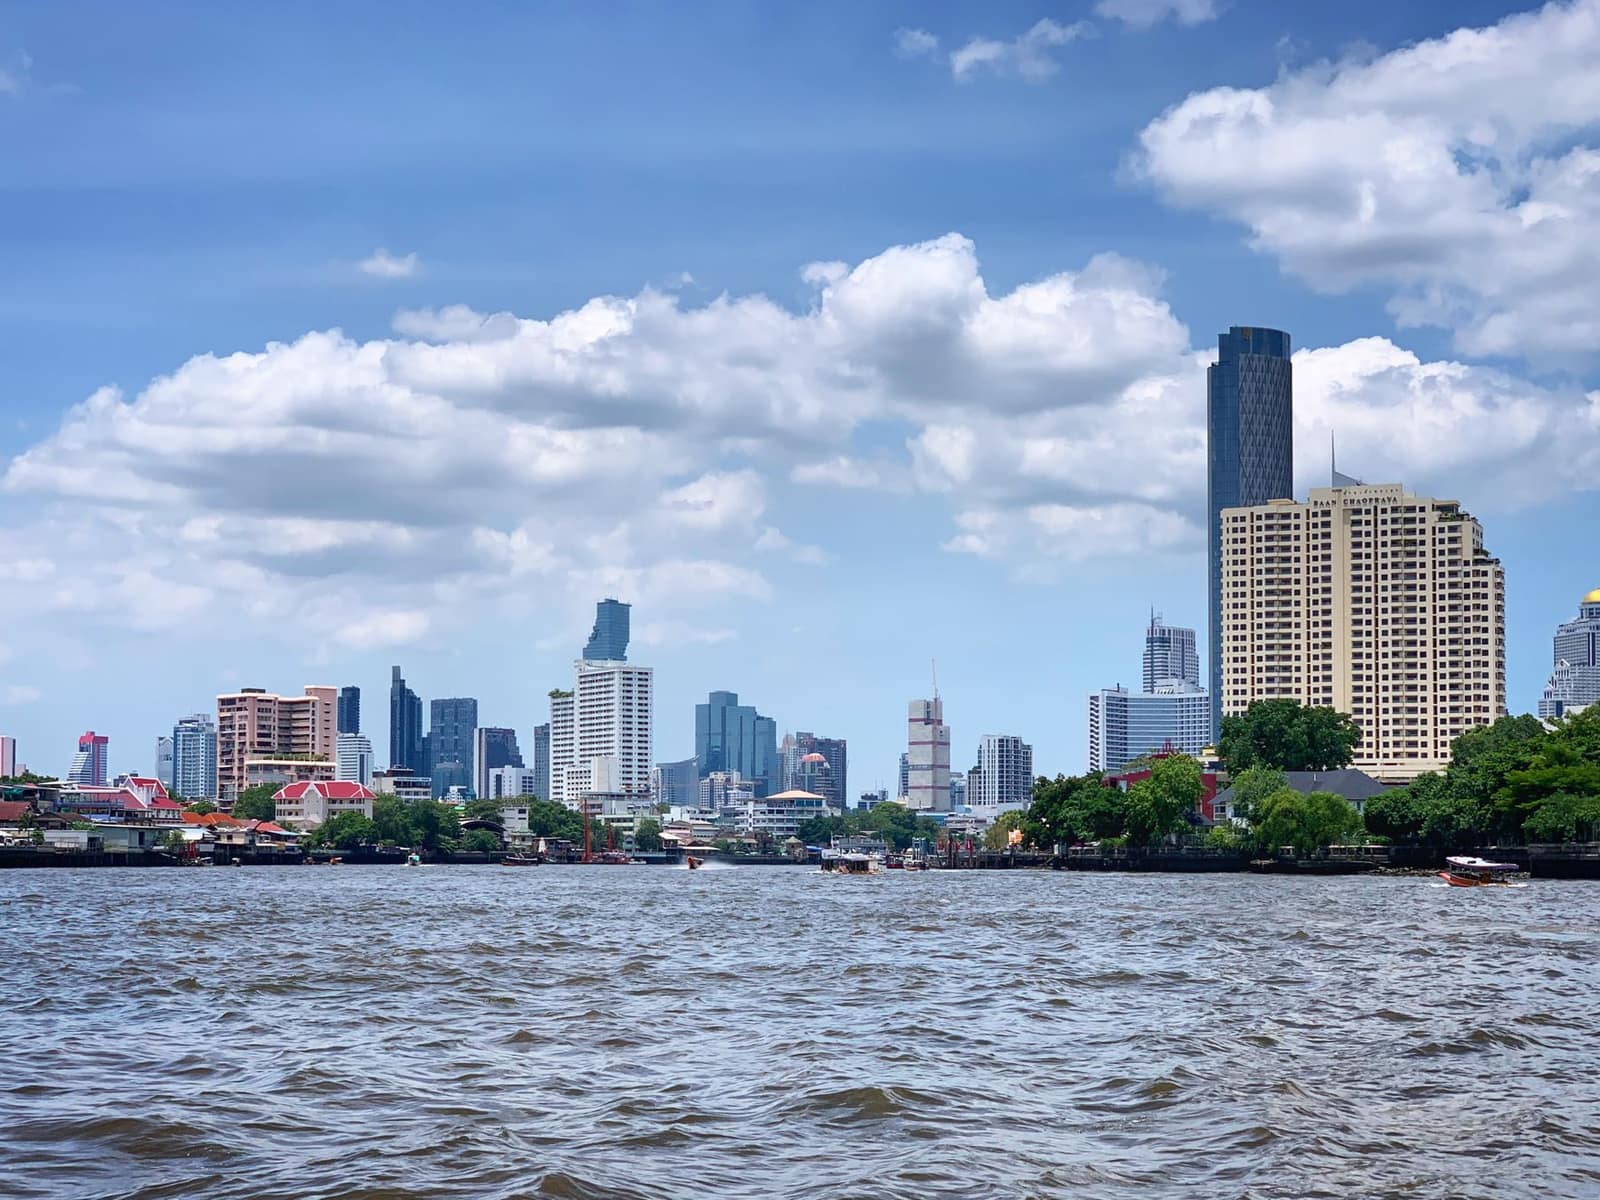 AITIGATHBBangkokThailandFood-processing and auto hub of South-East Asia. Buys Indian marine products, chemicals, machinery and gems.From India 2025-26US$ 5.06 bn
More in marine
All products →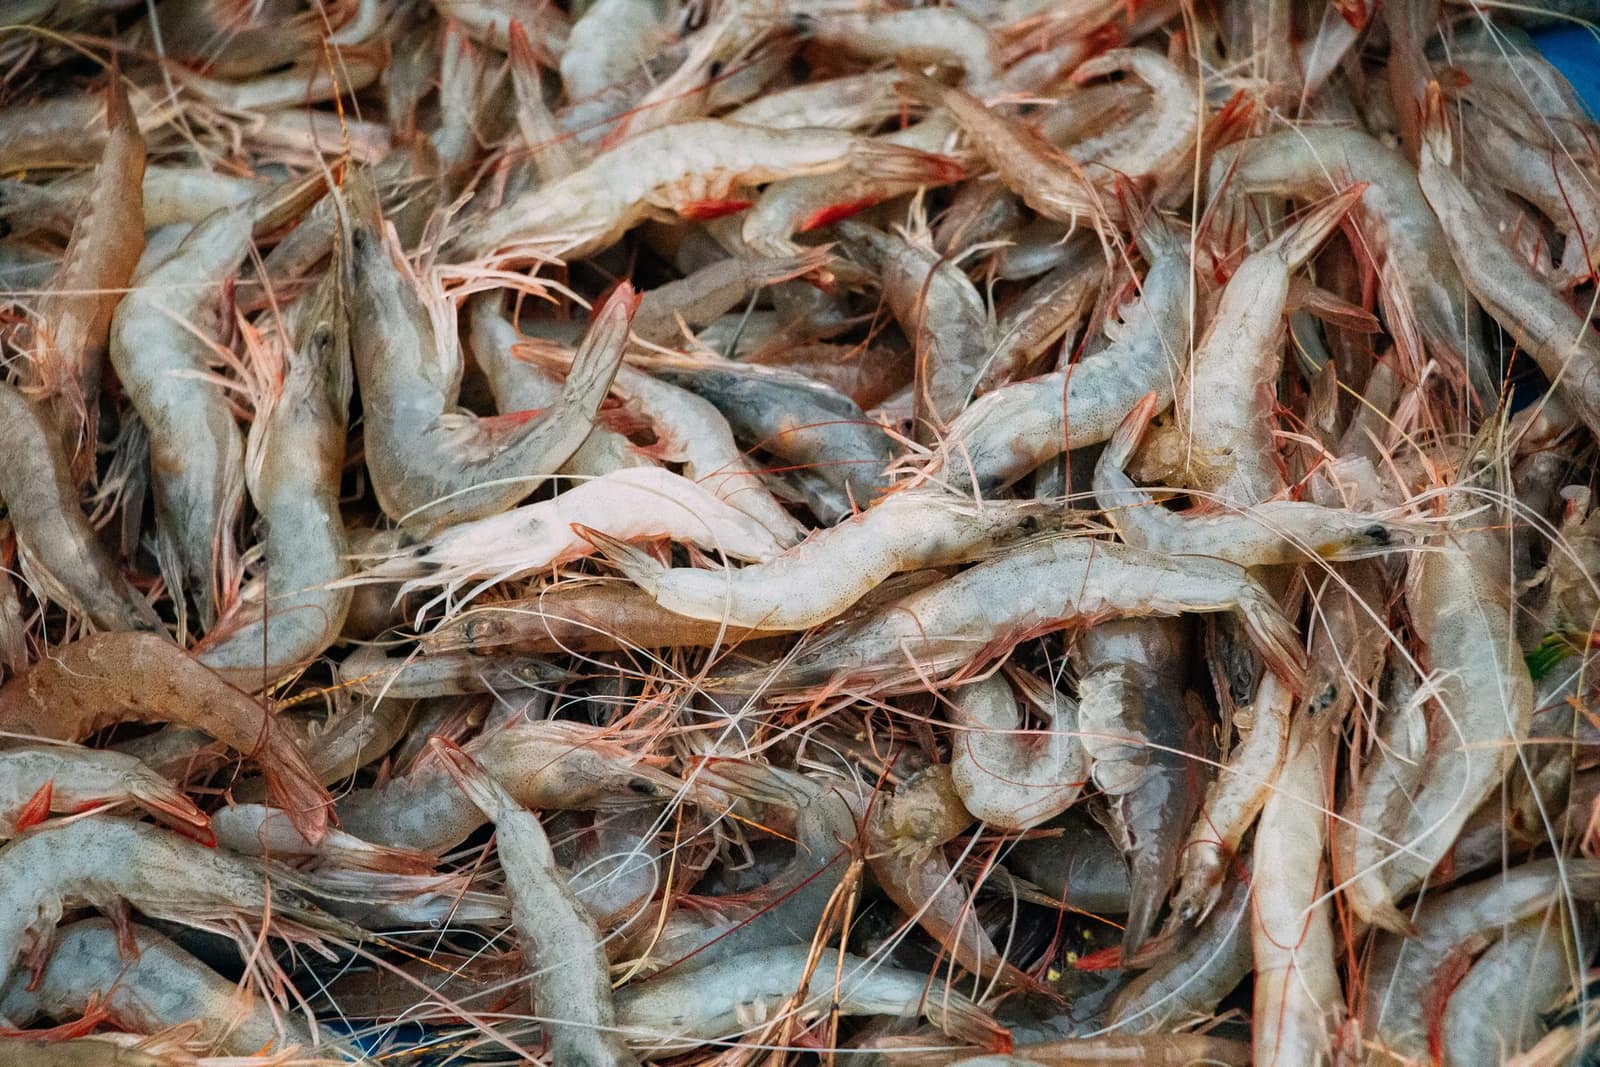 Free to exportMarineFrozen shrimpIndia’s top seafood export. Needs MPEDA registration and an EIC-approved plant; residue testing and US trade measures shape the business.HS0306.17Exports 2025-26US$ 5.61 bn ↑9.1%
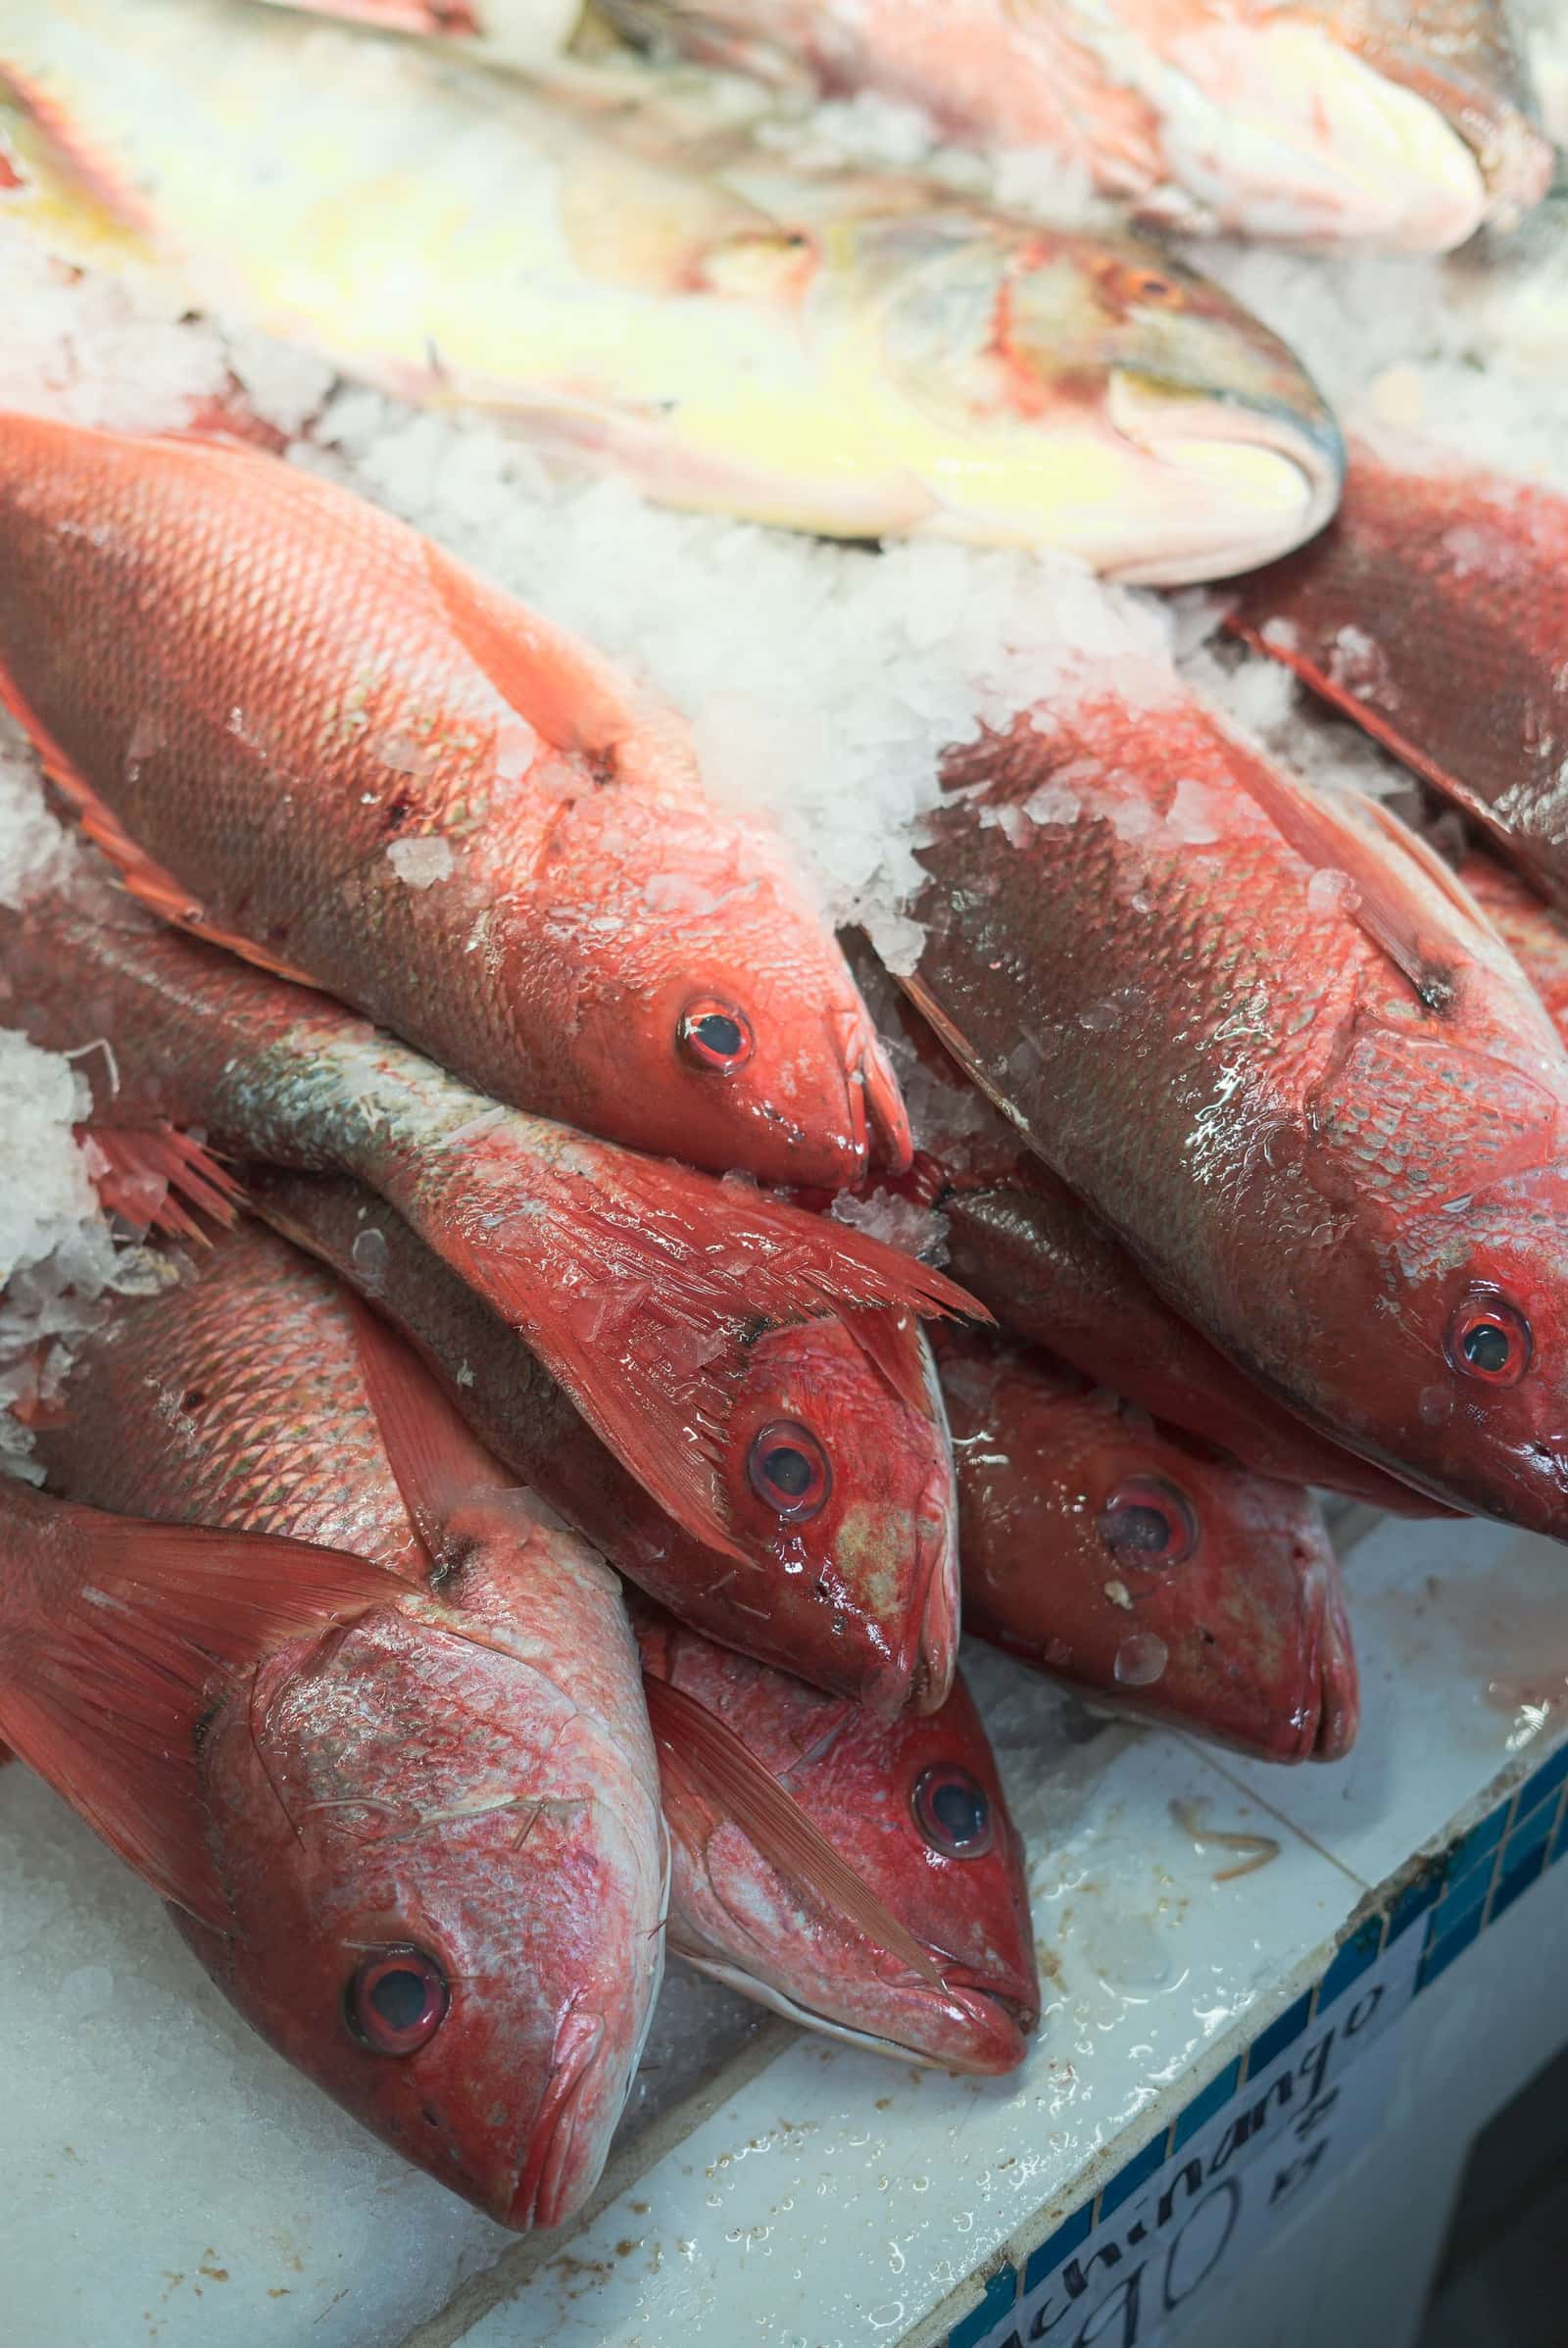 Free to exportMarineFrozen fishIndia’s second-largest seafood export. MPEDA registration, an EIC-approved plant and a health certificate are the gate.HS0303Exports 2025-26US$ 917 mn ↑8.9%
 Free, with conditionsMarineSquid, cuttlefish and octopusFrozen squid, cuttlefish and octopus from the west and south coasts. Needs MPEDA registration, an EIC plant and an EU catch certificate.HS0307Exports 2025-26US$ 930 mn ↑30.3%