


East Asia
Export to South Korea
Industrial buyer of Indian naphtha, metals, chemicals and yarn. Food plants must register with MFDS first.
- Capital
- Seoul
- Currency
- KRW
- Trade agreement with India
- India–Korea Comprehensive Economic Partnership Agreement (CEPA); also APTA 1 January 2010
- Main ports
- Busan, Incheon, Gwangyang
Korea mostly buys industrial inputs from India — naphtha and petroleum products, iron and steel, aluminium, chemicals and cotton yarn. There is a smaller but growing market for Indian food, spices and sesame. Korean buyers care about specifications, certificates and fast responses.

Korea gives reduced duties to many Indian goods under the CEPA. Talks to upgrade the CEPA have been going on since 2016 (11th round held in July 2024); confirm current status on commerce.gov.in.
What it buys from India
- Naphtha and other petroleum products
- Iron, steel, aluminium and other metals
- Organic chemicals and cotton yarn
- Sesame, spices and marine products
Import rules on their side
- Foreign food factories must be registered with Korea's Ministry of Food and Drug Safety (MFDS) before their products can be imported; each shipment is declared and may be tested.
- Labels must be in Korean (a Korean sticker label is accepted for many products).
- Electrical and children's products need KC certification.
Practical tips
- Seoul Food is the main food trade show; KOTRA helps foreign suppliers meet importers.
- Expect detailed quality agreements and testing of samples before a contract.
- Payment by LC or telegraphic transfer is normal; Korean buyers are generally reliable payers.
Trade data
India’s exports to South Korea in numbers
From the Department of Commerce’s TradeStat (Indian financial years, April–March), the country’s imports from the world from UN Comtrade, and its basics from the World Bank.
- India’s exports here, 2025-26
- US$ 6.01 bn No. 19 of our 30 countries
- Change from 2024-25
- ↑ +3.3% US$ 5.82 bn → US$ 6.01 bn
- Share of all Indian exports
- 1.36%
- Its imports from the world
- US$ 631.7 bn 2024 · India’s share 1.02%
What India sells here most
By HS chapter, 2025-26. Change is against 2024-25.
What is rising and what is falling
Chapters where India sells at least US$ 5 million. Change from 2024-25 to 2025-26.
↑ High demand
- CopperUS$ 79.1 mn → US$ 318 mn↑+302.5%
- Gems, jewellery, precious metalsUS$ 84.6 mn → US$ 187 mn↑+121%
- Fats and oilsUS$ 23.5 mn → US$ 36.6 mn↑+55.6%
- Coffee, tea, spicesUS$ 32.4 mn → US$ 48.9 mn↑+51%
- Jute and other plant fibresUS$ 24.5 mn → US$ 36.6 mn↑+49.1%
- LeadUS$ 278 mn → US$ 343 mn↑+23.3%
- Instruments, medical devicesUS$ 46.4 mn → US$ 56.3 mn↑+21.3%
- Iron and steel articlesUS$ 28.3 mn → US$ 33.4 mn↑+17.9%
↓ Low demand
- Animal feed and food residuesUS$ 159 mn → US$ 86.8 mn↓-45.6%
- Inorganic chemicalsUS$ 92 mn → US$ 67.7 mn↓-26.5%
- Fuels and petroleum productsUS$ 976 mn → US$ 777 mn↓-20.3%
- CottonUS$ 137 mn → US$ 122 mn↓-11.3%
- Oilseeds and seedsUS$ 62.8 mn → US$ 56.3 mn↓-10.3%
Opportunity: what this country buys from the world, and from India
The country’s own recorded imports in UN Comtrade, 2024. Chapters with the biggest gap between what it buys from the world and what it buys from India.
Our product guides that sell here
India’s exports of each product to this country, 2025-26.
The 20 biggest export lines
4-digit HS lines, 2025-26, with their Harmonized System descriptions.
What India buys from South Korea
India’s imports from this country in 2025-26 by HS chapter, from TradeStat — this country can be your supplier too.
- India’s imports, 2025-26
- US$ 21.4 bn US$ 21.1 bn → US$ 21.4 bn
- India’s exports, 2025-26
- US$ 6.01 bn
- Trade balance
- −US$ 15.3 bn exports minus imports
- Change in imports
- +1.4%
The country at a glance
- Population
- 51.7 mn 2025
- GDP
- US$ 1,872.4 bn 2025
- GDP per person
- US$ 36,227 2025
- Imports (goods and services)
- US$ 760.2 bn 2025
Sources: TradeStat — Export Import Data Bank, Department of Commerce · UN Comtrade database (United Nations Statistics Division) · World Bank — World Development Indicators · Figures taken 29 October 2026.
What to send to South Korea
All products → Free to exportFarm produceSesame seed (til)Natural and hulled sesame from Gujarat, Rajasthan, MP and UP. EU shipments need an IOPEPC Certificate of Export and strict residue testing.HS1207.40Exports 2025-26US$ 423 mn ↓13.8%
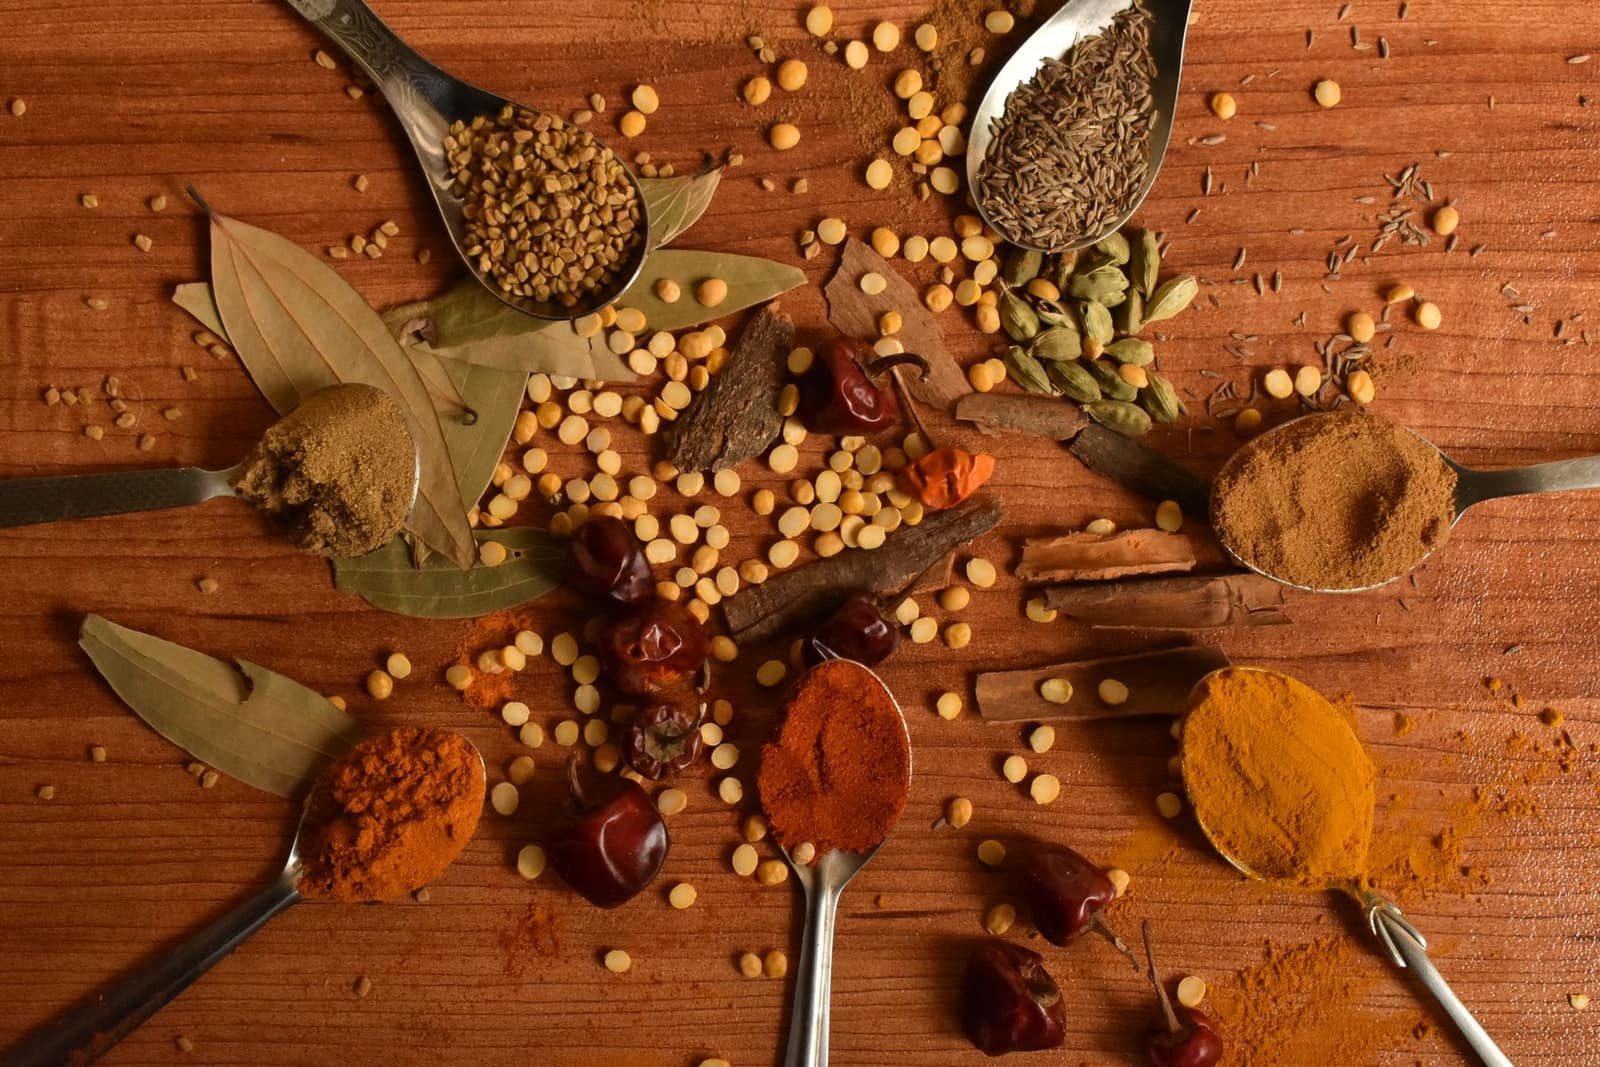 Free to exportFarm produceSpicesWhole, ground and blended spices. Spices Board registration (CRES) is compulsory; residue and ethylene oxide tests keep buyers.HS0904–0910Exports 2025-26US$ 3.12 bn ↓5.1%
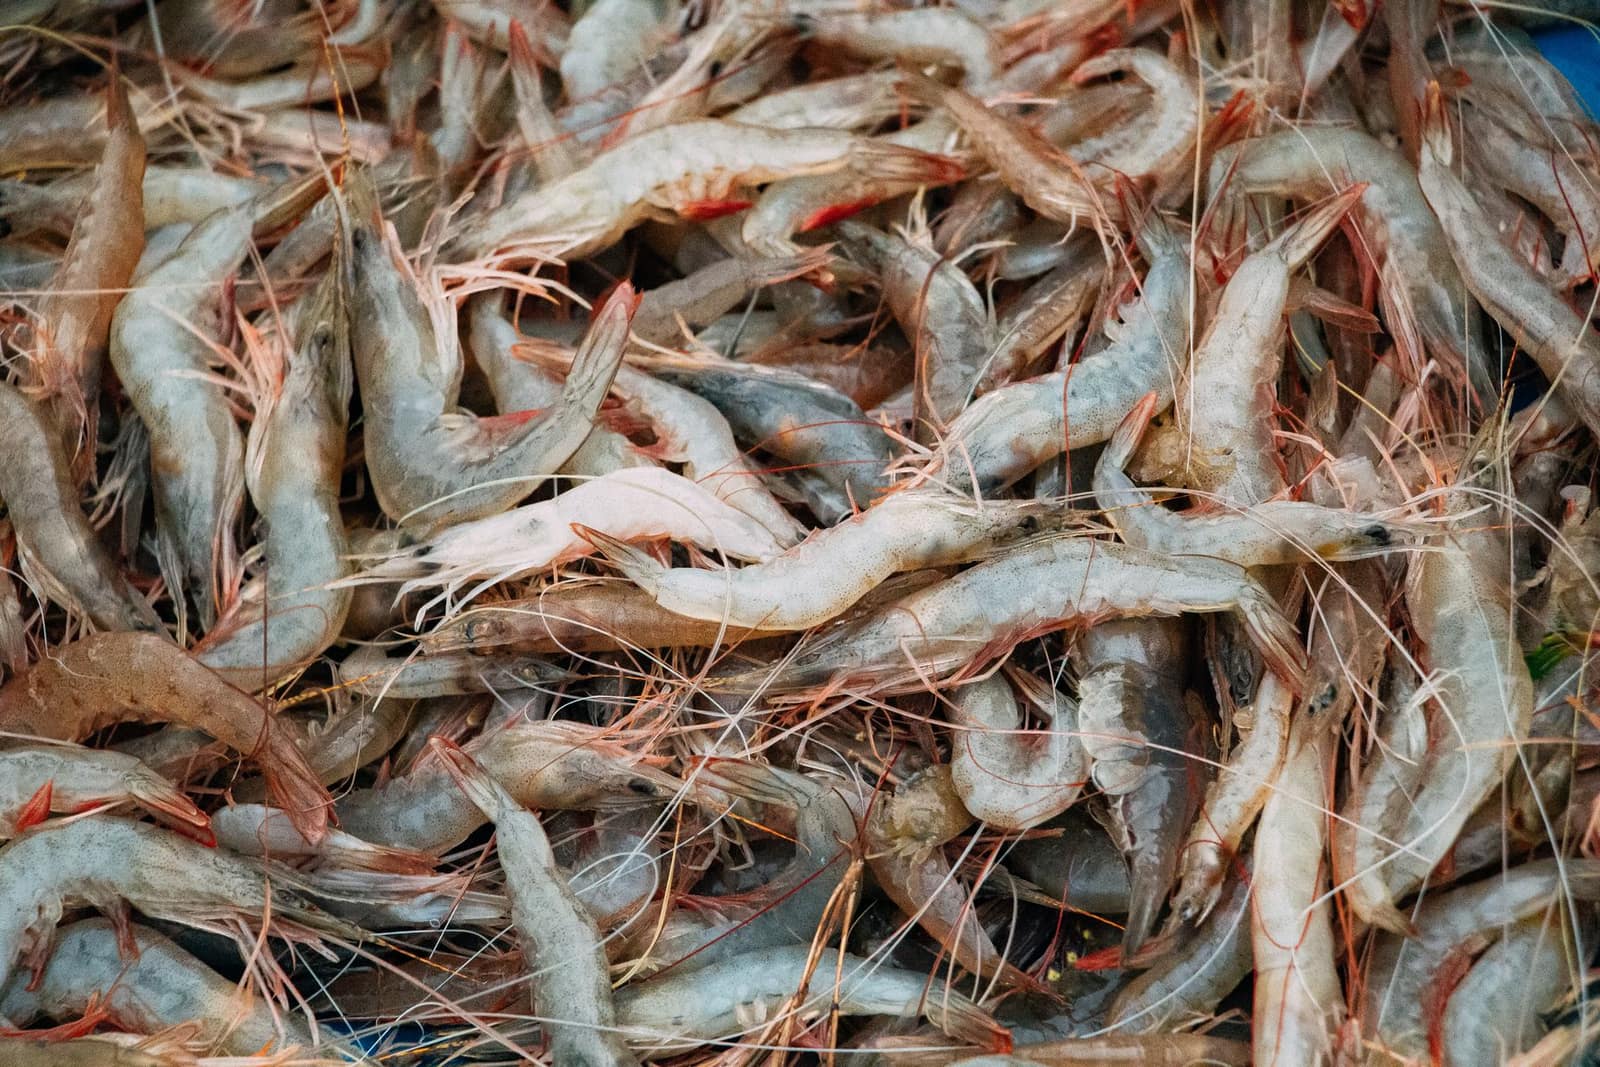 Free to exportMarineFrozen shrimpIndia’s top seafood export. Needs MPEDA registration and an EIC-approved plant; residue testing and US trade measures shape the business.HS0306.17Exports 2025-26US$ 5.61 bn ↑9.1%
 Free to exportTextiles & apparelCotton yarnBulk cotton yarn sold to weaving and knitting mills abroad; Bangladesh is by far the largest buyer.HS5205Exports 2025-26US$ 3.22 bn ↓4.1%
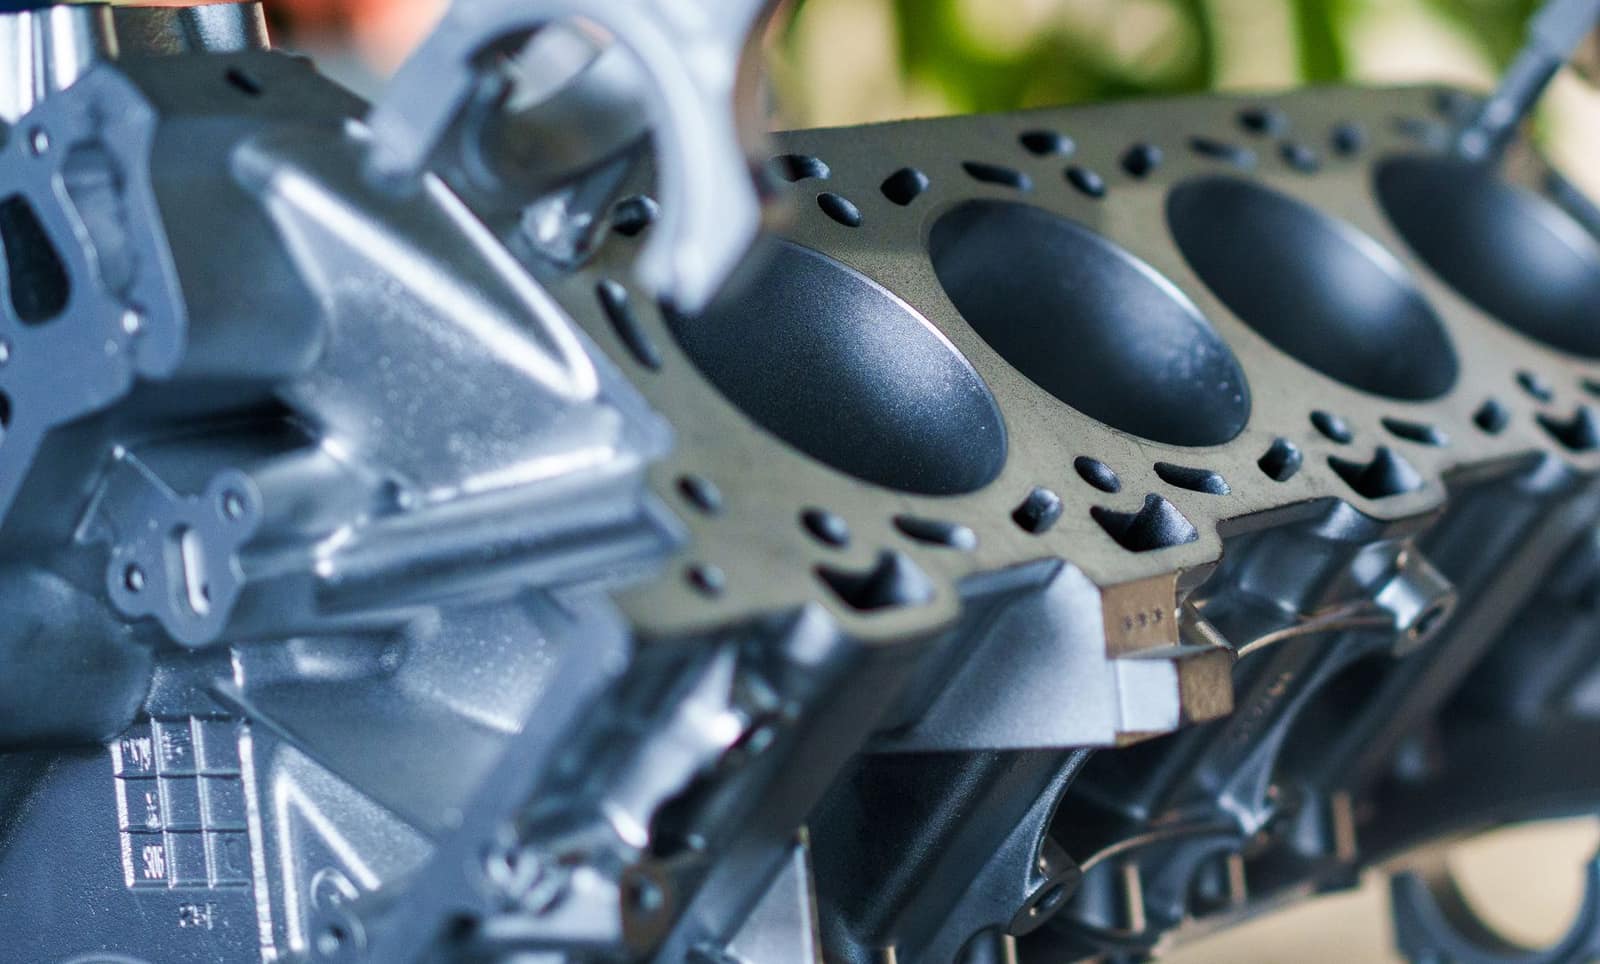
 Free to exportEngineering goodsIron and steel castingsGrey and ductile iron and steel castings from Kolhapur, Rajkot, Coimbatore and Howrah; the USA leads.HS7325Exports 2025-26US$ 1.25 bn ↑3.2%
 Free to exportEngineering goodsAuto parts and componentsOEM and aftermarket vehicle parts; the USA, Germany and Italy buy most, with strong demand in Latin America.HS8708Exports 2025-26US$ 7.64 bn ↑1.8%
 Free to exportPharma & chemicalsGeneric medicines (formulations)Tablets, capsules and injectables; every market needs product registration. The USA buys the most.HS3004Exports 2025-26US$ 21.9 bn ↓0.7%
 Free, with conditionsFarm produceOrganic productsCertified organic grains, oilseeds, spices, tea and processed foods. Only NPOP certification lets you export as "organic".HSVaries
More in East Asia
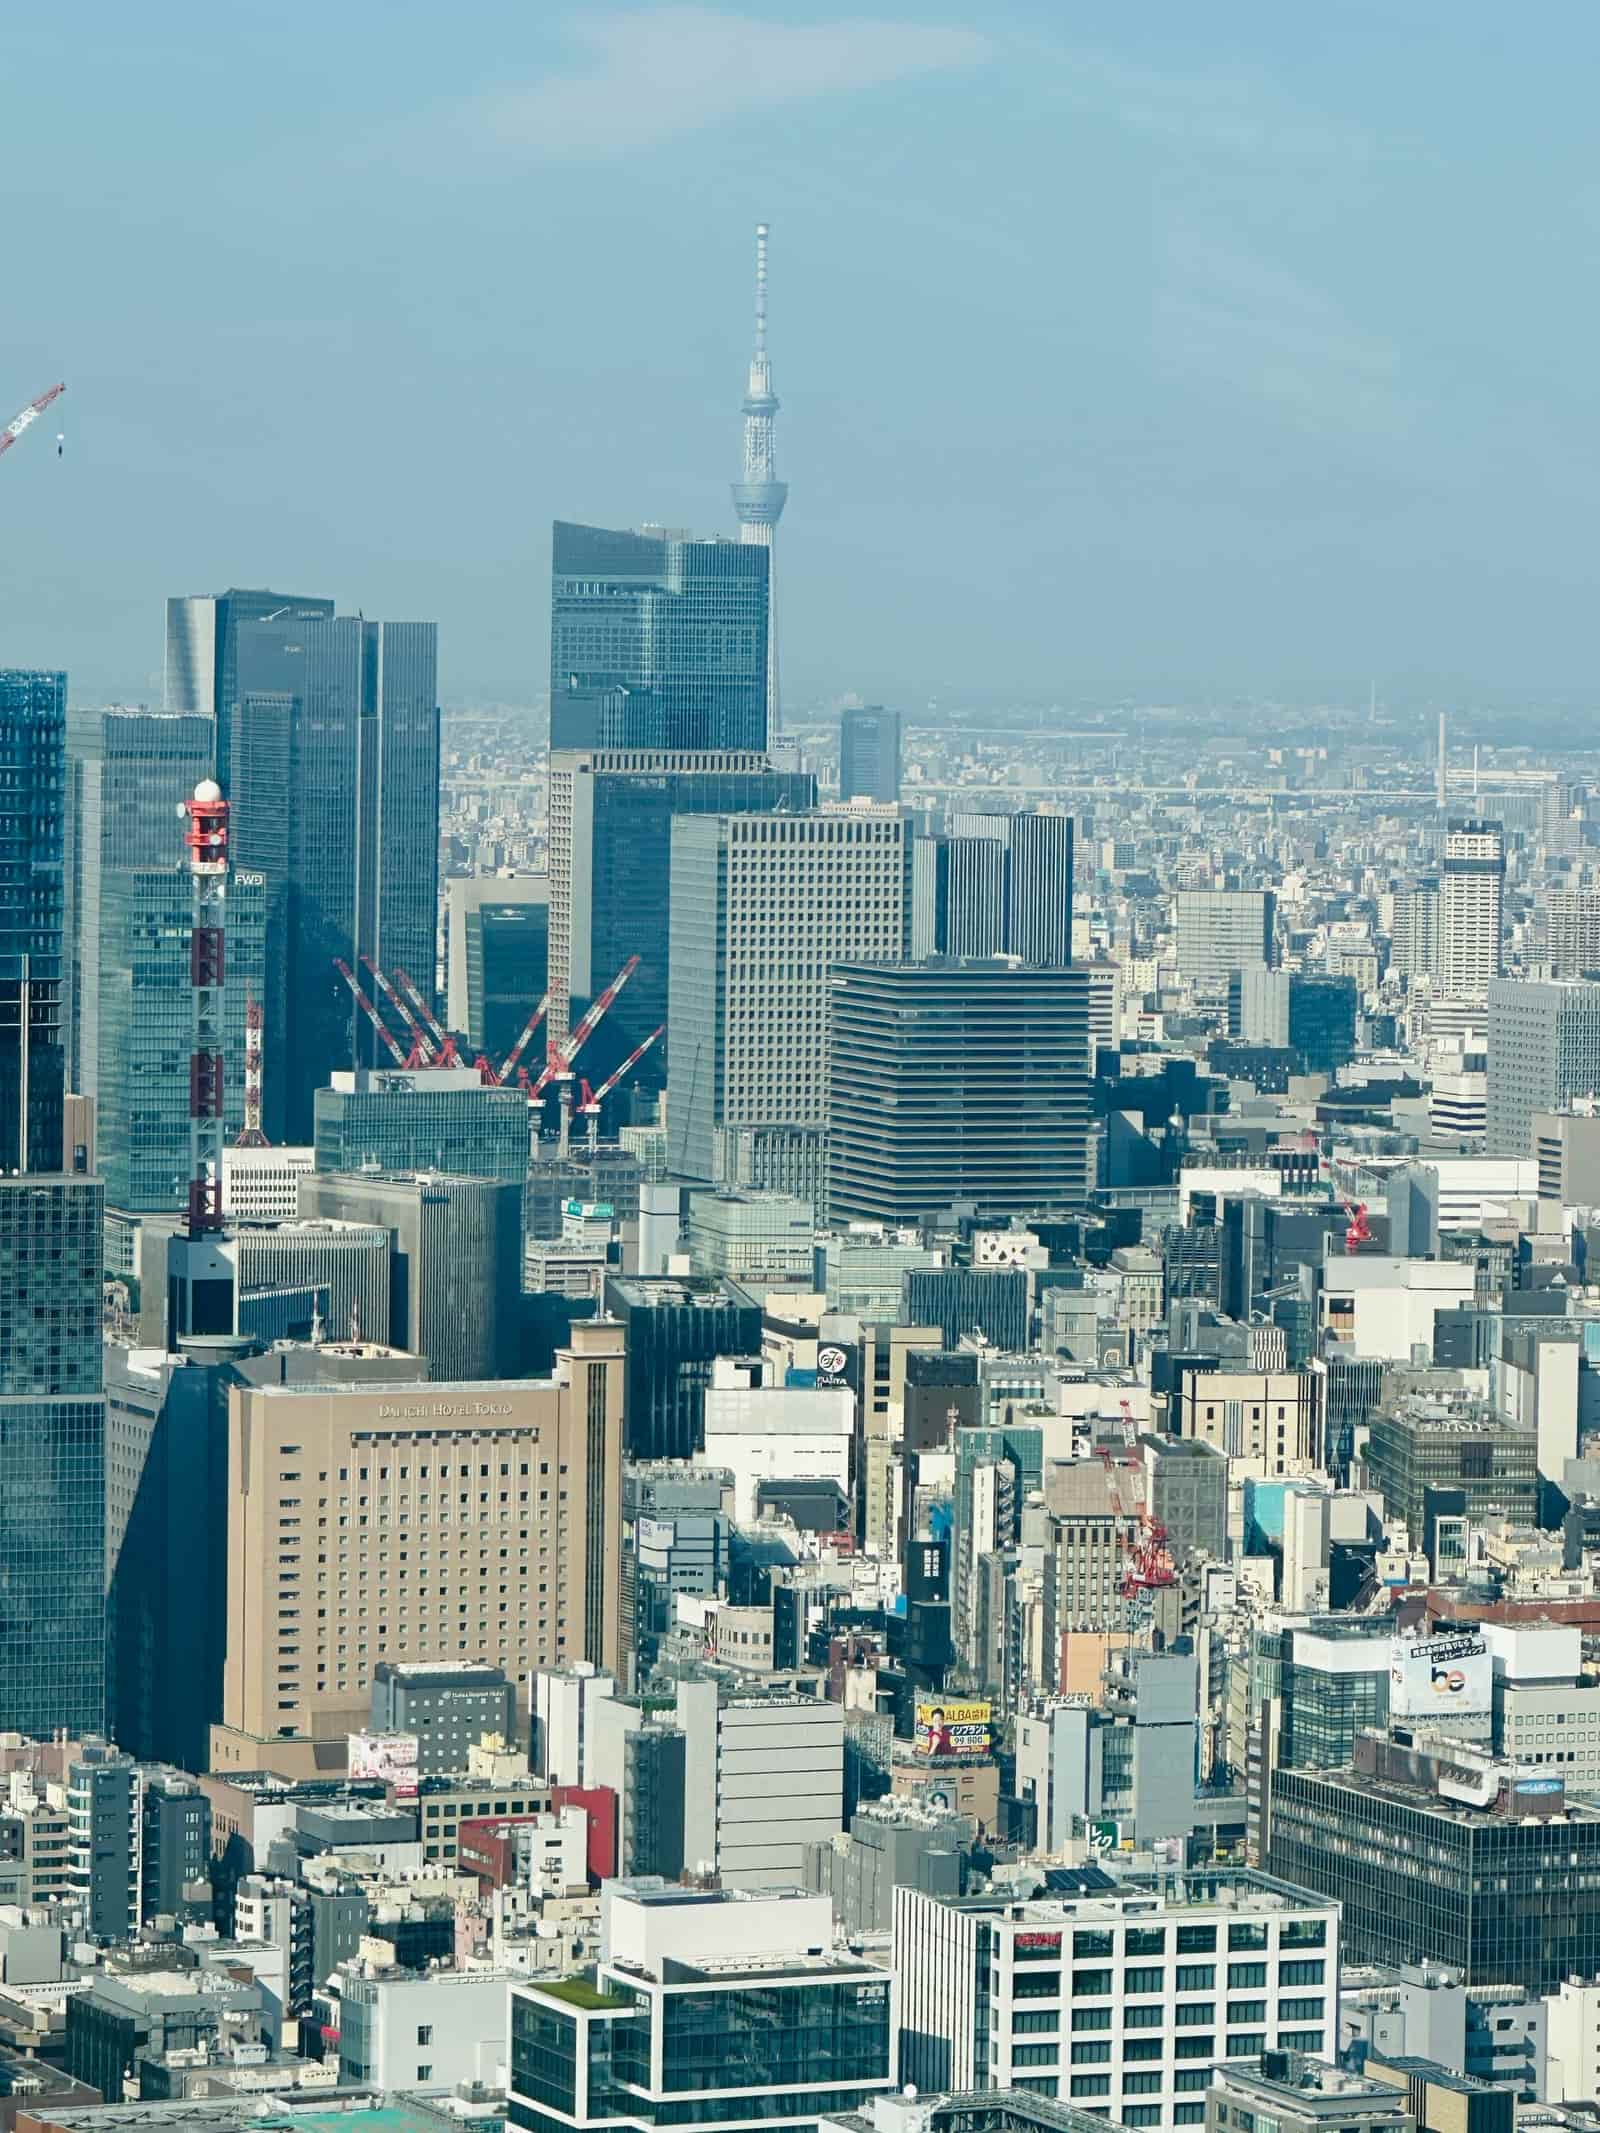 CEPAJPYTokyoJapanHigh-value, quality-obsessed market. Buys shrimp, chemicals, auto parts and garments; strict food-sanitation checks.From India 2025-26US$ 6.04 bn
 APTACNYBeijingChinaHuge market, but mostly for raw materials. Food plants must be registered with GACC; fresh produce needs a protocol.From India 2025-26US$ 19.5 bn