

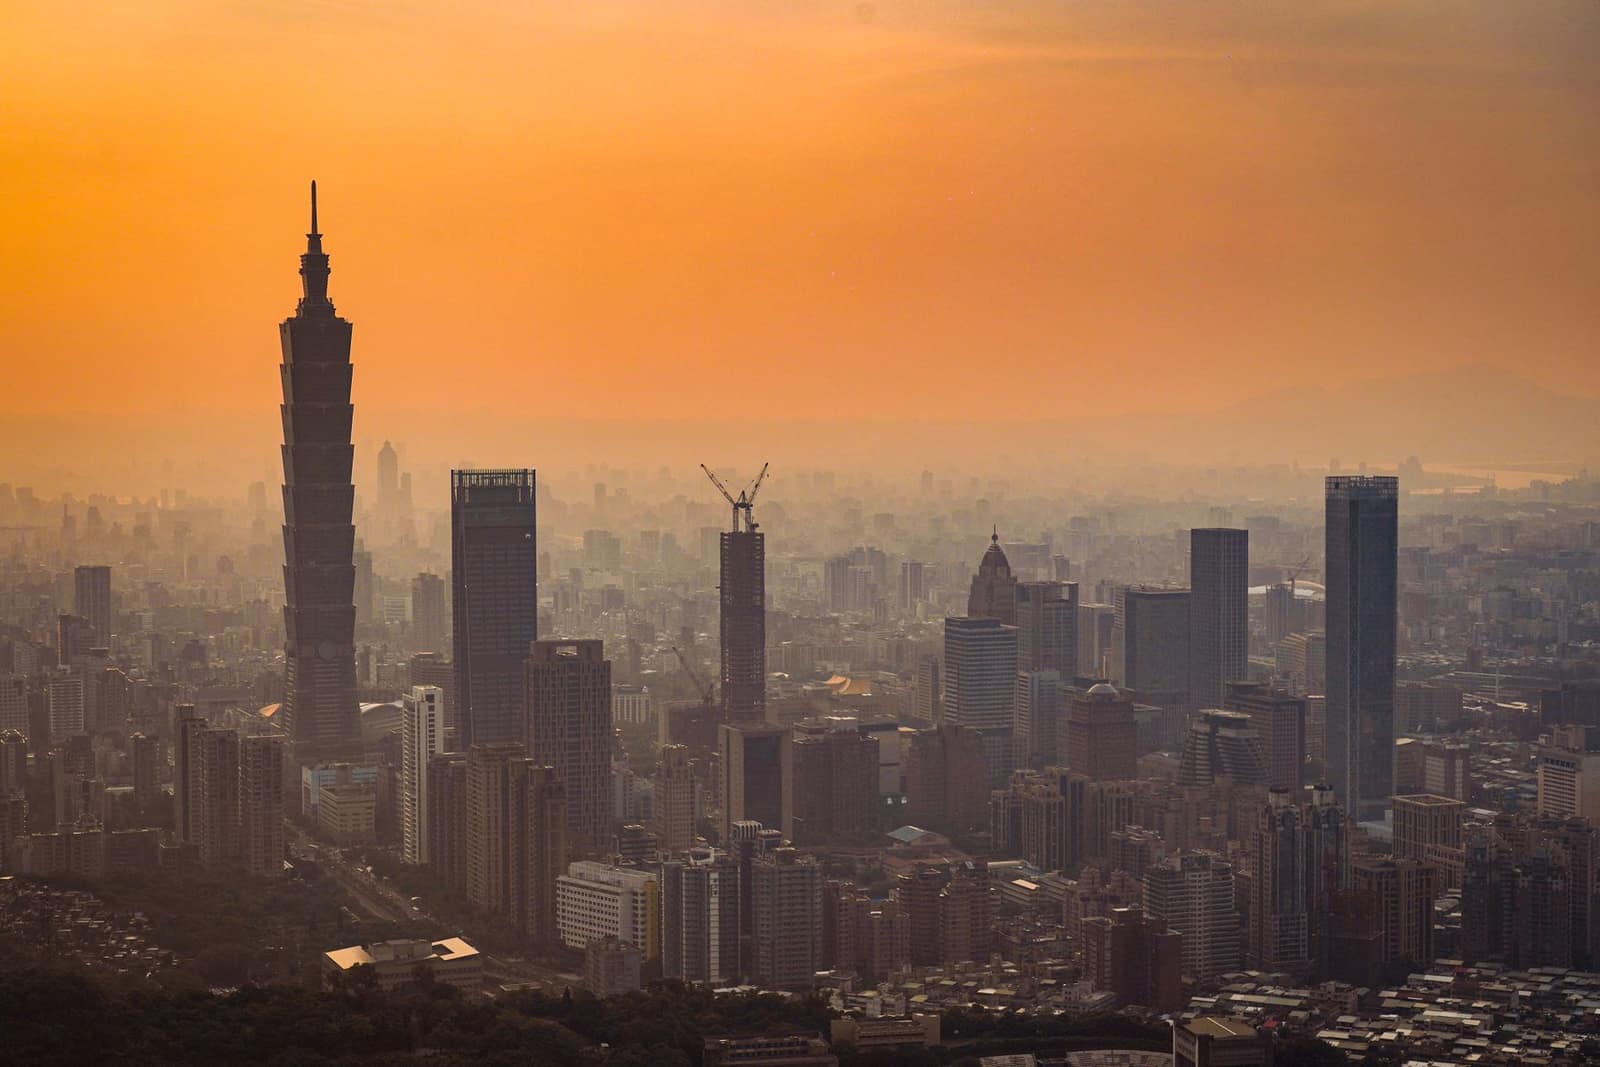
East Asia
Export to Taiwan
High-tech economy that buys Indian chemicals, metals, marine products and food. Strict food inspection and product standards.
- Capital
- Taipei
- Currency
- TWD
- Trade agreement with India
- None
- Main ports
- Kaohsiung, Keelung, Taichung
Taiwan buys Indian petroleum products, organic chemicals, aluminium, iron and steel, marine products and spices. There is no trade agreement, so normal duties apply. Food goes through border inspection by the Taiwan FDA, and many industrial products need BSMI inspection or certification.
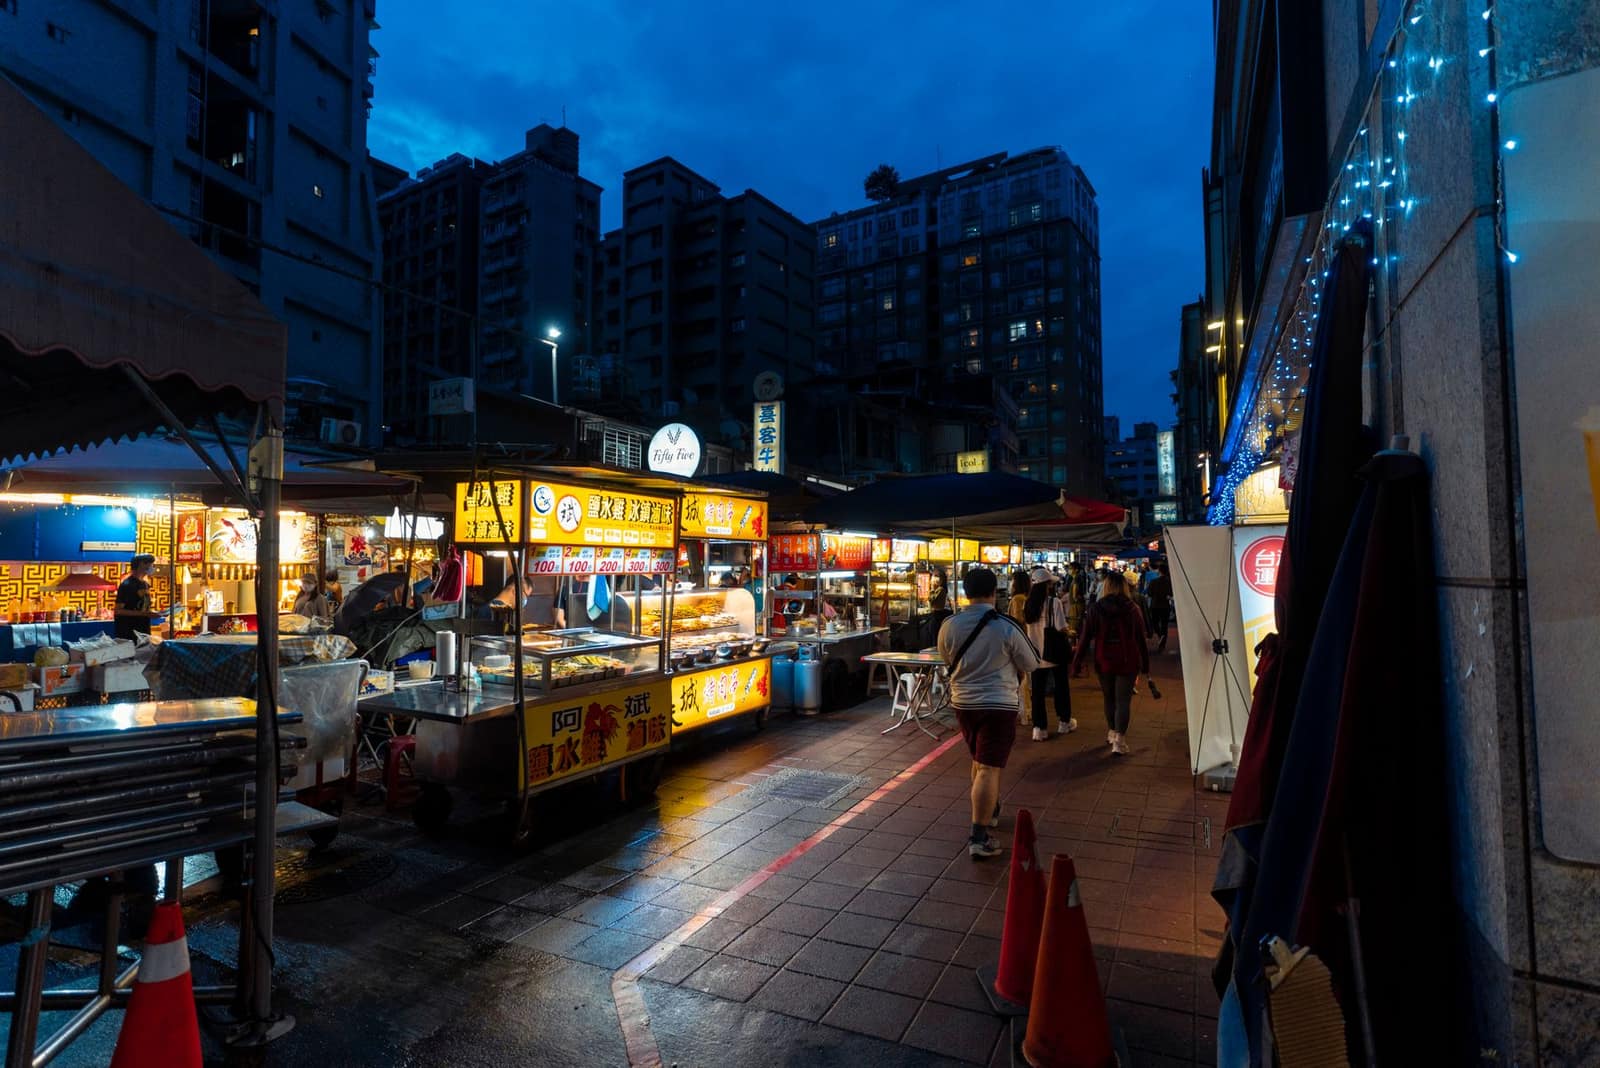
What it buys from India
- Petroleum products and organic chemicals
- Aluminium, iron and steel
- Marine products, spices and cotton yarn
Import rules on their side
- Imported food is inspected at the border by the Taiwan Food and Drug Administration; the importer must be registered and file an inspection application for each shipment.
- Plants and animal products need quarantine clearance from the Animal and Plant Health Inspection Agency (APHIA).
- Many electrical, electronic and consumer products need inspection or certification by BSMI before sale. Labels must be in traditional Chinese.
Practical tips
- There is no trade agreement, so the buyer pays the normal (most-favoured-nation) duty. Ask the buyer or a local customs broker for the duty on your exact HS code before you quote a landed price.
- Food Taipei and other TAITRA fairs are the main places to meet Taiwanese importers.
- Buyers expect consistent quality and test reports; a rejected food consignment is put under tighter checks for later shipments.
Sources (6)
- Taiwan Food and Drug Administration — imported food inspection
- Animal and Plant Health Inspection Agency, Taiwan (APHIA)
- Bureau of Standards, Metrology and Inspection, Taiwan (BSMI)
- Customs Administration, Ministry of Finance, Taiwan
- Department of Commerce — TradeStat export-import data bank
- Indian Trade Portal (FIEO / Department of Commerce) — market access by country
Trade data
India’s exports to Taiwan in numbers
From the Department of Commerce’s TradeStat (Indian financial years, April–March), the country’s imports from the world from UN Comtrade, and its basics from the World Bank.
- India’s exports here, 2025-26
- US$ 1.95 bn No. 40 of our 80 countries
- Change from 2024-25
- ↑ +9.4% US$ 1.78 bn → US$ 1.95 bn
- Share of all Indian exports
- 0.44%
- Its imports from the world
- —
What India sells here most
By HS chapter, 2025-26. Change is against 2024-25.
What is rising and what is falling
Chapters where India sells at least US$ 5 million. Change from 2024-25 to 2025-26.
↑ High demand
- Iron and steel articlesUS$ 9.6 mn → US$ 196 mn↑+1,947.2%
- Fuels and petroleum productsUS$ 29.4 mn → US$ 86.2 mn↑+193.5%
- Electrical and electronicsUS$ 94.5 mn → US$ 152 mn↑+60.9%
- Instruments, medical devicesUS$ 17.5 mn → US$ 23.4 mn↑+33.5%
- Other chemical productsUS$ 23.6 mn → US$ 31.5 mn↑+33.1%
- MachineryUS$ 123 mn → US$ 151 mn↑+22.5%
- Oilseeds and seedsUS$ 20.8 mn → US$ 24.1 mn↑+16.2%
- Salt, stone, cementUS$ 33.4 mn → US$ 37.3 mn↑+11.6%
↓ Low demand
- Organic chemicalsUS$ 395 mn → US$ 238 mn↓-39.7%
- LeadUS$ 71.2 mn → US$ 44.9 mn↓-36.9%
- Inorganic chemicalsUS$ 26.1 mn → US$ 17.8 mn↓-31.7%
- CottonUS$ 40.8 mn → US$ 31 mn↓-24%
- Vehicles and partsUS$ 22 mn → US$ 16.8 mn↓-23.8%
Our product guides that sell here
India’s exports of each product to this country, 2025-26.
The 20 biggest export lines
4-digit HS lines, 2025-26, with their Harmonized System descriptions.
What India buys from Taiwan
India’s imports from this country in 2025-26 by HS chapter, from TradeStat — this country can be your supplier too.
- India’s imports, 2025-26
- US$ 8.88 bn US$ 10 bn → US$ 8.88 bn
- India’s exports, 2025-26
- US$ 1.95 bn
- Trade balance
- −US$ 6.93 bn exports minus imports
- Change in imports
- -11.3%
Sources: TradeStat — Export Import Data Bank, Department of Commerce · Figures taken 29 October 2026.
What to send to Taiwan
All products →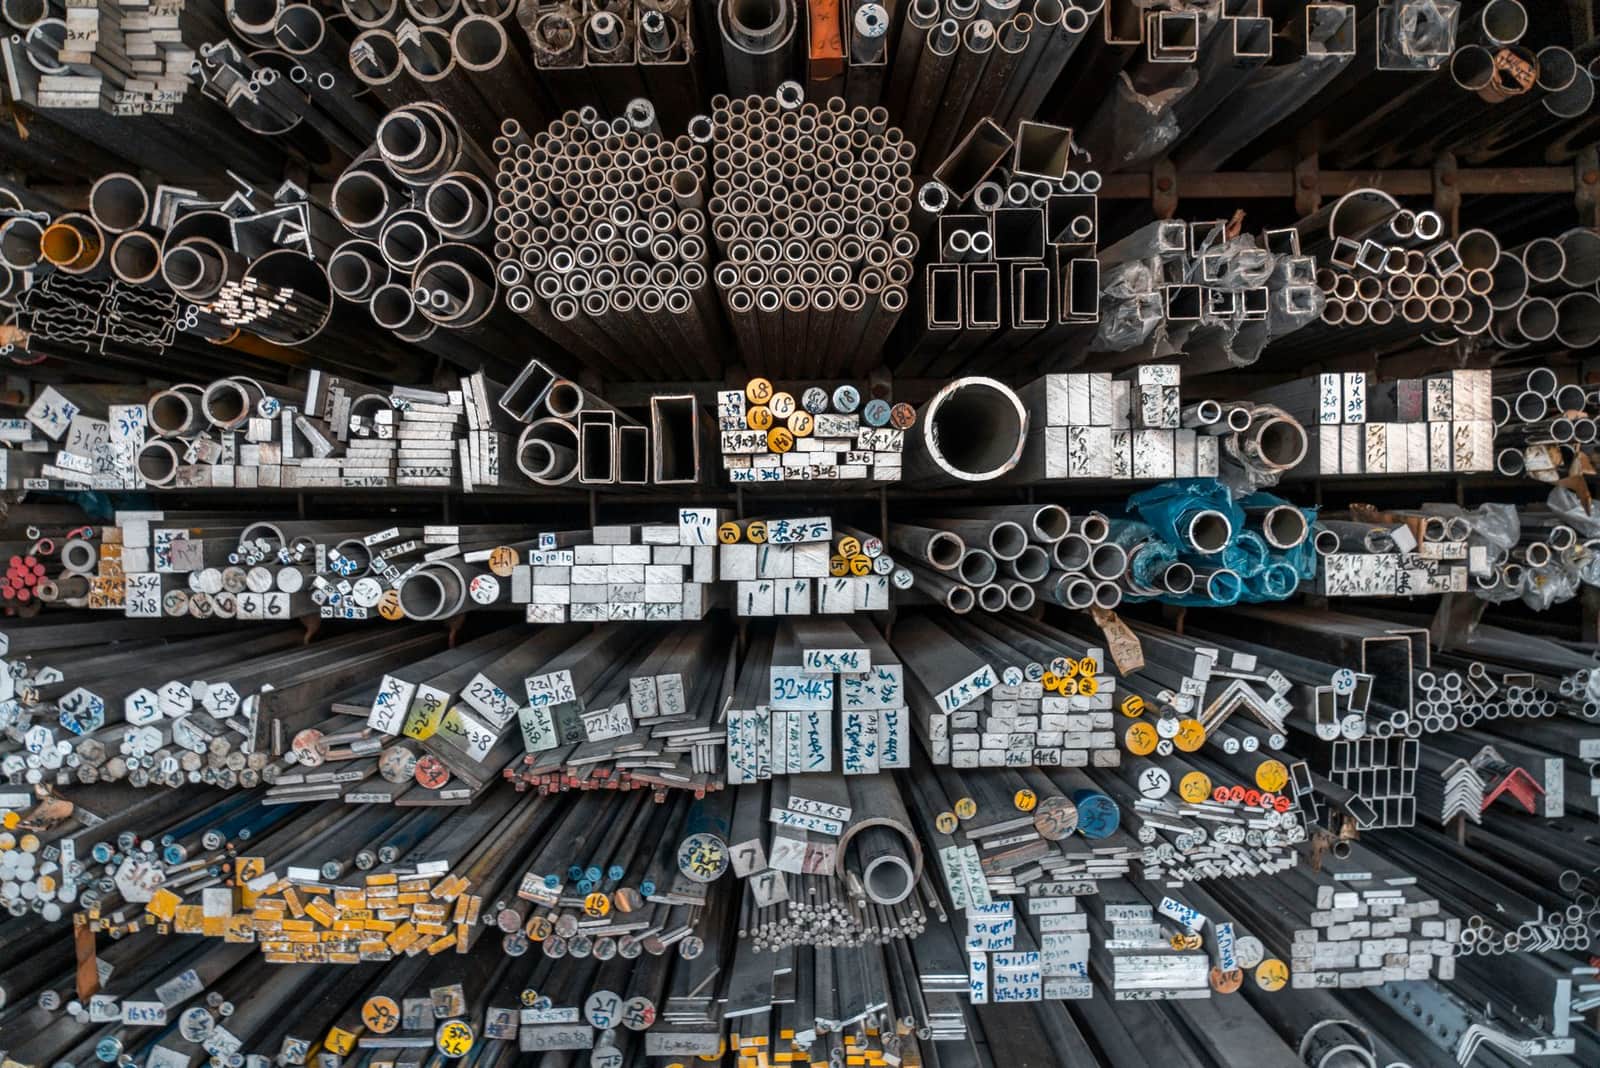 Free to exportEngineering goodsAluminium productsPrimary aluminium, extrusions and sheets; Korea, Vietnam, China and Japan lead for metal, the USA and UAE for products.HS7601Exports 2025-26US$ 4.62 bn ↓2.5%
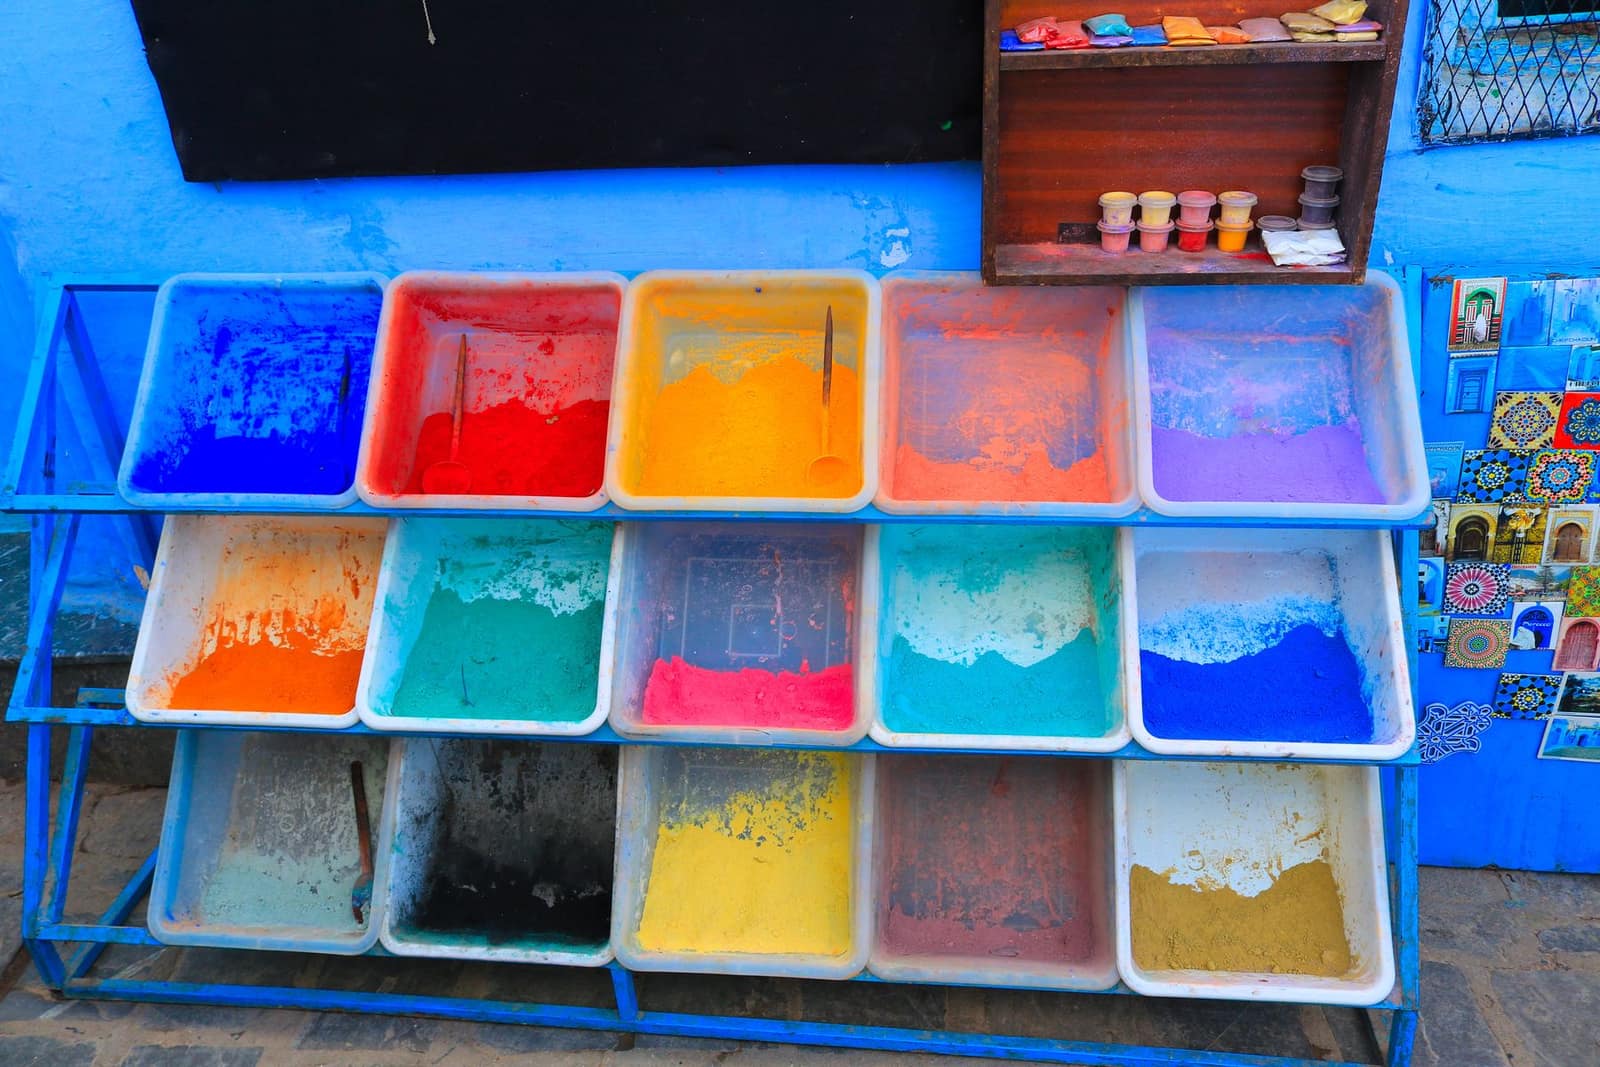 Free to exportPharma & chemicalsDyes and pigmentsReactive and disperse dyes and organic pigments from Gujarat and Maharashtra; textile hubs in Asia and Europe buy them.HS3204Exports 2025-26US$ 2.46 bn ↓8.7%
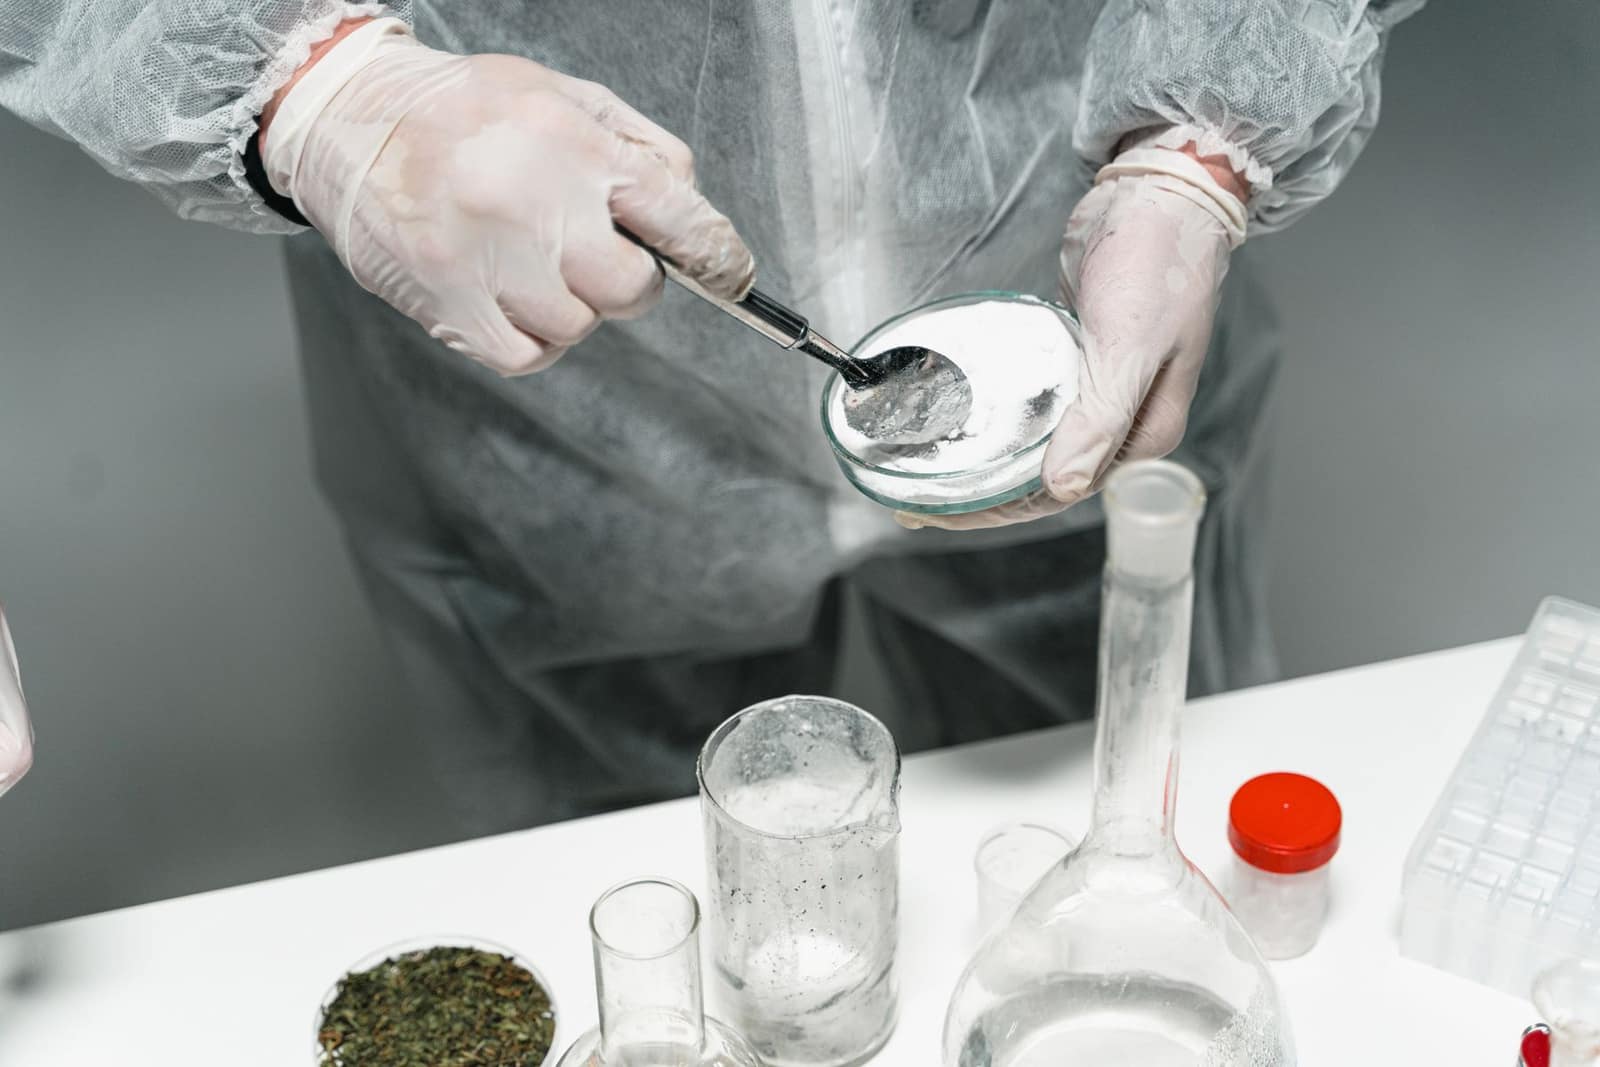 Free to exportPharma & chemicalsBulk drugs (APIs)APIs and intermediates from Hyderabad, Visakhapatnam and Gujarat; regulated buyers need DMFs and GMP inspections.HS2933Exports 2025-26US$ 7.78 bn ↓0.6%
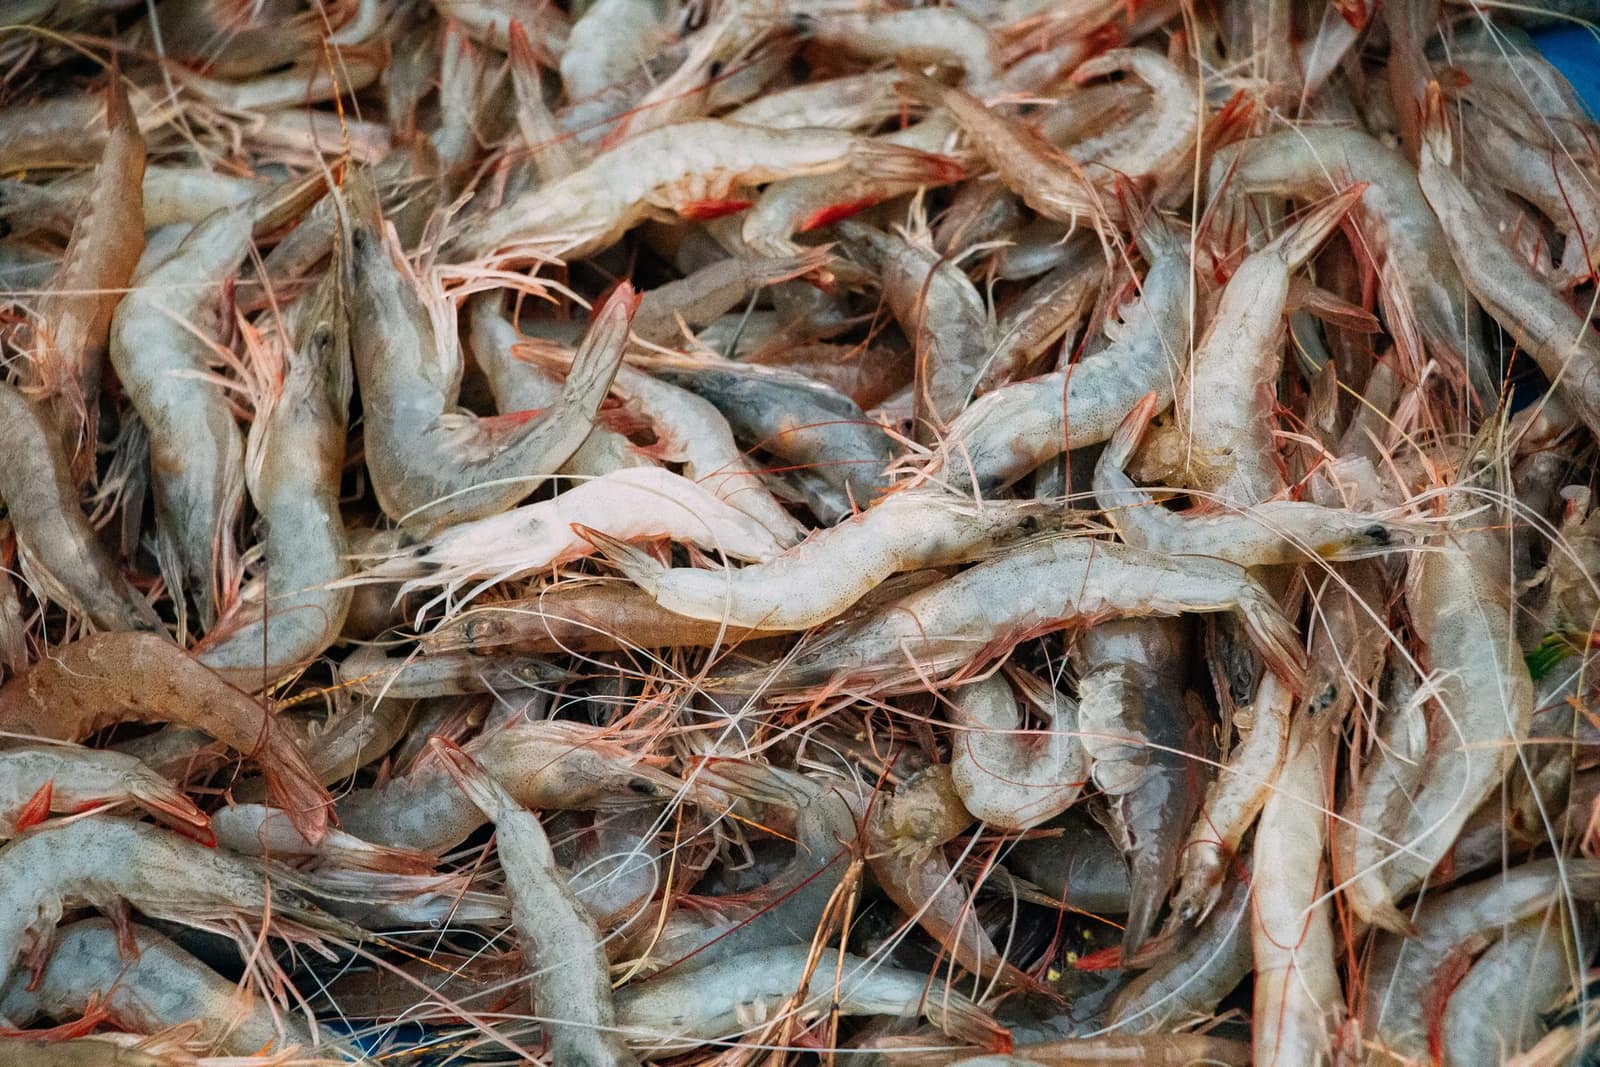 Free to exportMarineFrozen shrimpIndia’s top seafood export. Needs MPEDA registration and an EIC-approved plant; residue testing and US trade measures shape the business.HS0306.17Exports 2025-26US$ 5.61 bn ↑9.1%
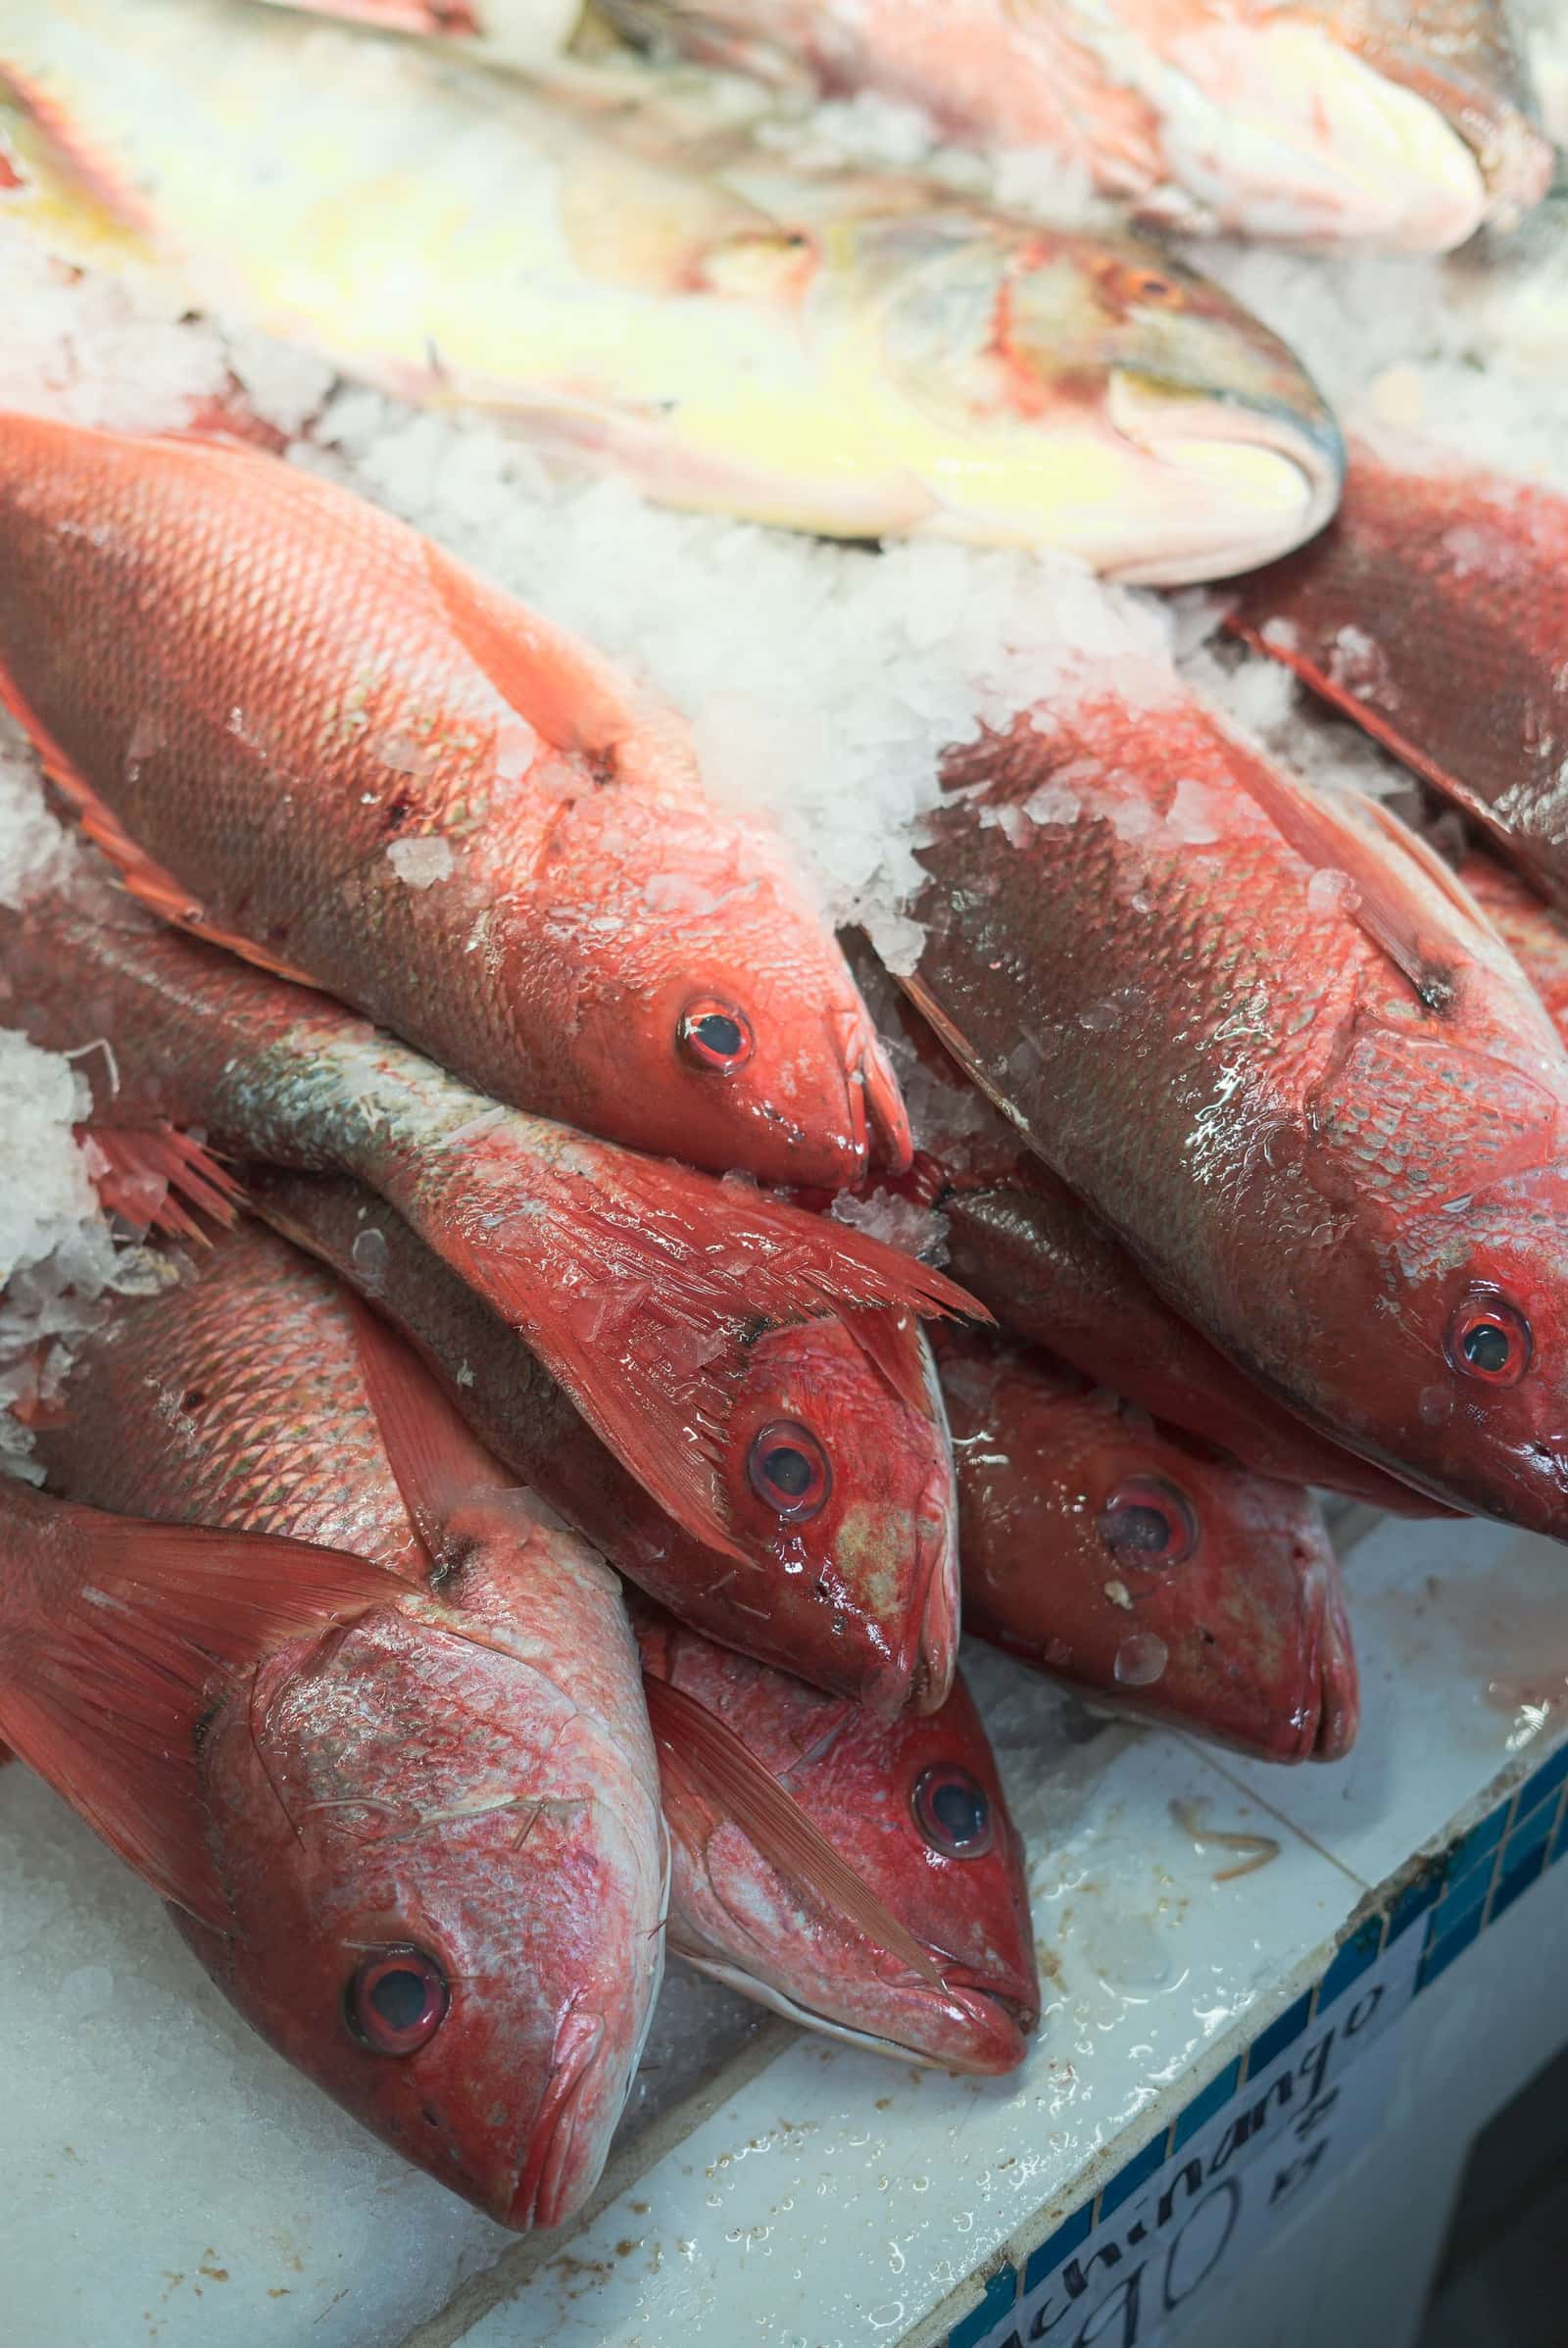 Free to exportMarineFrozen fishIndia’s second-largest seafood export. MPEDA registration, an EIC-approved plant and a health certificate are the gate.HS0303Exports 2025-26US$ 917 mn ↑8.9%
 Free to exportFarm produceSpicesWhole, ground and blended spices. Spices Board registration (CRES) is compulsory; residue and ethylene oxide tests keep buyers.HS0904–0910Exports 2025-26US$ 3.12 bn ↓5.1%
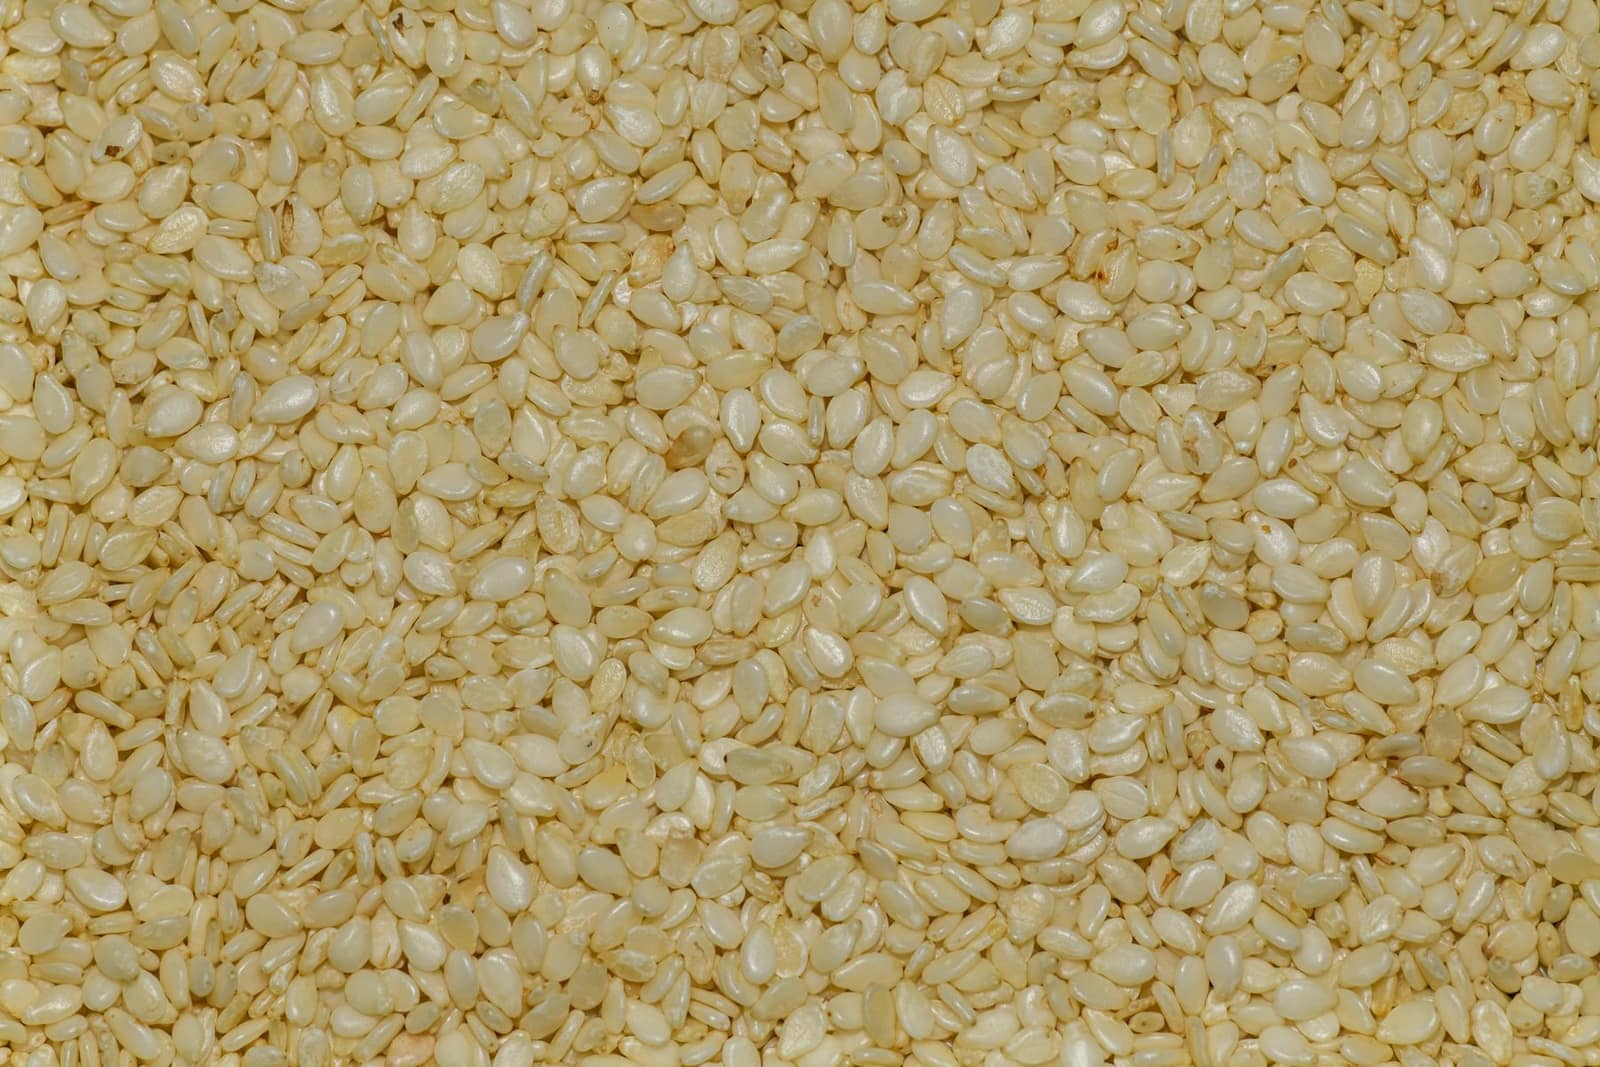 Free to exportFarm produceSesame seed (til)Natural and hulled sesame from Gujarat, Rajasthan, MP and UP. EU shipments need an IOPEPC Certificate of Export and strict residue testing.HS1207.40Exports 2025-26US$ 423 mn ↓13.8%
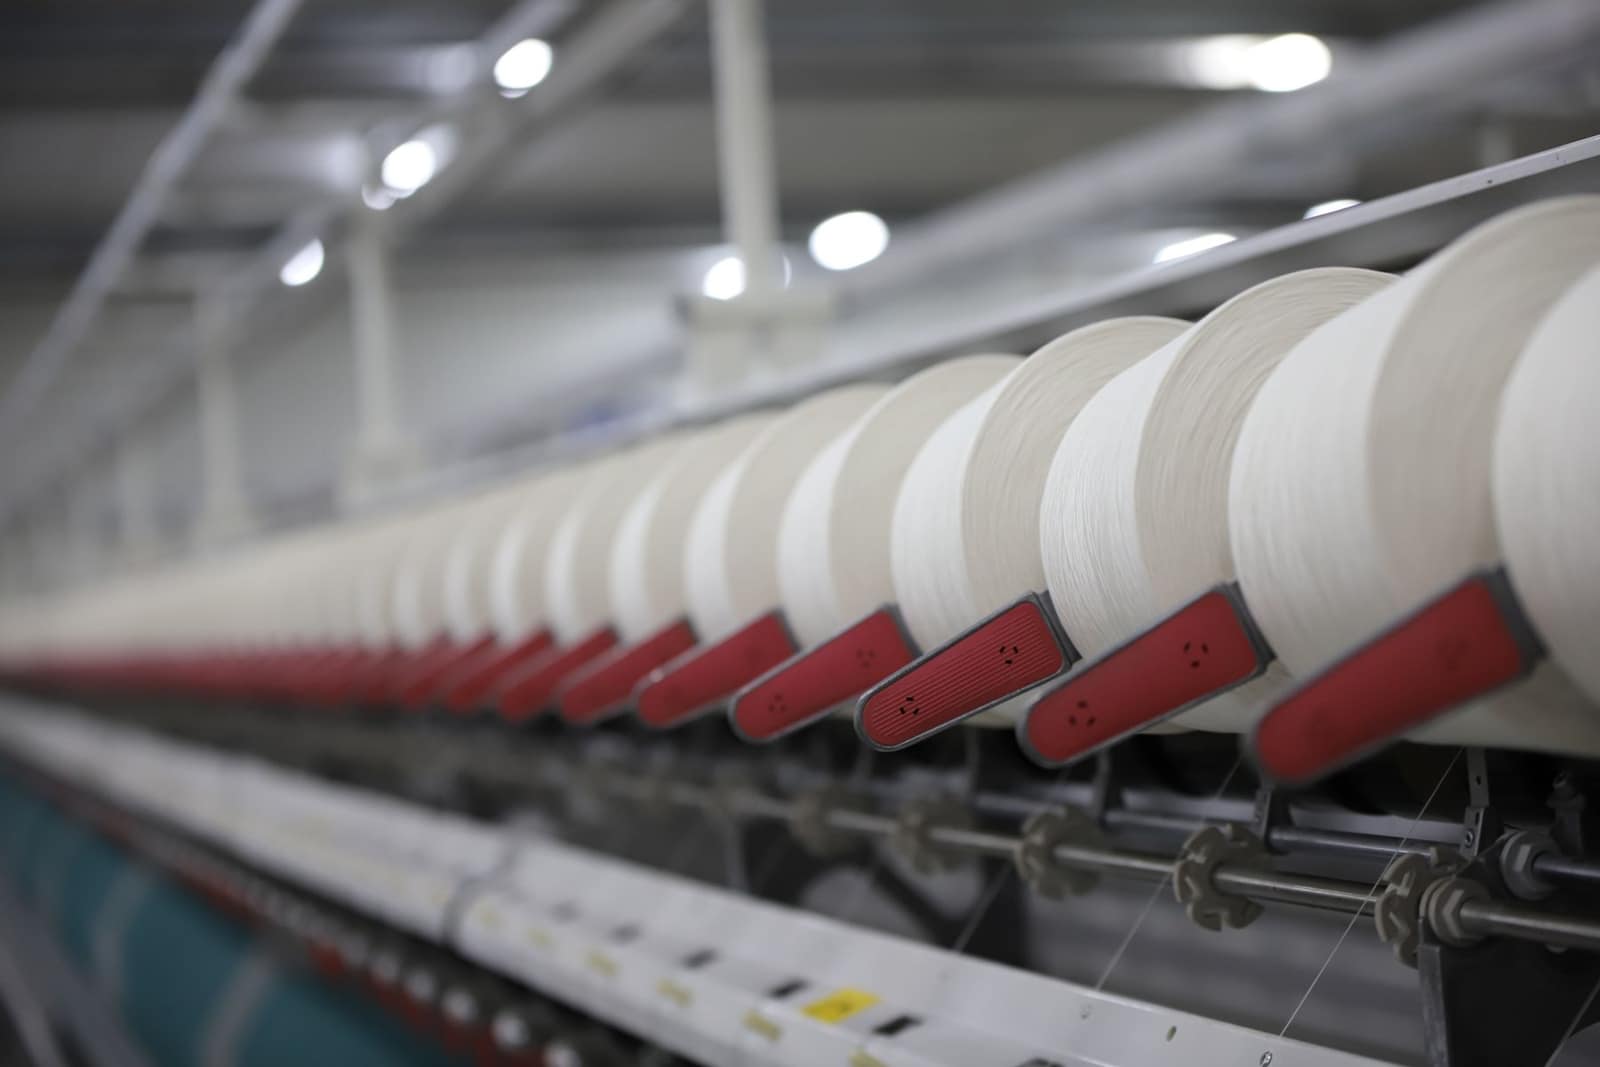 Free to exportTextiles & apparelCotton yarnBulk cotton yarn sold to weaving and knitting mills abroad; Bangladesh is by far the largest buyer.HS5205Exports 2025-26US$ 3.22 bn ↓4.1%
More in East Asia
 CEPAJPYTokyoJapanHigh-value, quality-obsessed market. Buys shrimp, chemicals, auto parts and garments; strict food-sanitation checks.From India 2025-26US$ 6.04 bn
 CEPAKRWSeoulSouth KoreaIndustrial buyer of Indian naphtha, metals, chemicals and yarn. Food plants must register with MFDS first.From India 2025-26US$ 6.01 bn
 APTACNYBeijingChinaHuge market, but mostly for raw materials. Food plants must be registered with GACC; fresh produce needs a protocol.From India 2025-26US$ 19.5 bn
 HKDHong Kong (Special Administrative Region of China)Hong KongFree port with almost no import duty. A top buyer of Indian diamonds and jewellery and a re-export hub for Asia.From India 2025-26US$ 8.08 bn