


Europe
Export to Spain
Growing EU buyer of Indian garments, seafood, chemicals and auto parts; Valencia and Algeciras are key ports.
- Capital
- Madrid
- Currency
- EUR
- Trade agreement with India
- India–EU Free Trade Agreement (concluded, not yet in force) Not in force yetNot yet in force (talks concluded 27 Jan 2026)
- Main ports
- Valencia, Algeciras, Barcelona
Spain has big fashion retailers that source garments from India, a large seafood-processing industry, and a strong car industry that buys auto parts. It also buys organic chemicals, iron and steel goods and spices. All EU rules apply, and labels must be in Spanish.
Spain trades with India under EU rules. The India–EU FTA was concluded on 27 January 2026, with signing expected by December 2026 and entry into force around early 2027 (Commerce Minister, June 2026). Normal EU duties apply until then. Confirm current status on commerce.gov.in.
What it buys from India
- Garments, cotton yarn and fabrics
- Marine products, especially frozen shrimp and cephalopods
- Organic chemicals, iron and steel goods
- Auto parts and machinery
Import rules on their side
- All EU rules apply. Seafood plants must be on the EU list of approved establishments (through EIC / MPEDA) and each consignment needs an EU health certificate.
- Food is checked against EU MRLs and contaminant limits at the border.
- Consumer labels must be in Spanish.
Practical tips
- Alimentaria (Barcelona) is the main food fair; Seafood Expo Global is held in Barcelona for seafood buyers.
- Fashion buyers want fast turnaround and small repeat orders; be ready for short lead times.
- Spanish is preferred for smaller buyers; larger groups work in English.
Sources (7)
- Department of Commerce — India-EU Free Trade Agreement concluded (27 Jan 2026)
- All India Radio News — India-EU likely to sign FTA by December: Piyush Goyal (21 Jun 2026)
- European Commission — Access2Markets (EU tariffs and import rules by product)
- European Commission — EU pesticides database (maximum residue levels)
- European Commission — Food safety
- Spanish Tax Agency — customs (Agencia Tributaria)
- Department of Commerce — TradeStat export-import data bank
Trade data
India’s exports to Spain in numbers
From the Department of Commerce’s TradeStat (Indian financial years, April–March), the country’s imports from the world from UN Comtrade, and its basics from the World Bank.
- India’s exports here, 2025-26
- US$ 6.96 bn No. 17 of our 80 countries
- Change from 2024-25
- ↑ +46.1% US$ 4.76 bn → US$ 6.96 bn
- Share of all Indian exports
- 1.58%
- Its imports from the world
- US$ 451.3 bn 2024 · India’s share 1.42%
What India sells here most
By HS chapter, 2025-26. Change is against 2024-25.
What is rising and what is falling
Chapters where India sells at least US$ 5 million. Change from 2024-25 to 2025-26.
↑ High demand
- Fuels and petroleum productsUS$ 43.8 mn → US$ 1.56 bn↑+3,457.9%
- Vehicles and partsUS$ 127 mn → US$ 410 mn↑+223%
- Jute and other plant fibresUS$ 22.8 mn → US$ 44.5 mn↑+94.7%
- MachineryUS$ 269 mn → US$ 398 mn↑+48%
- Inorganic chemicalsUS$ 40.7 mn → US$ 53.8 mn↑+32.2%
- Home textiles, made-upsUS$ 140 mn → US$ 181 mn↑+28.8%
- Medicines and pharmaUS$ 103 mn → US$ 129 mn↑+25.1%
- Knitted garmentsUS$ 226 mn → US$ 256 mn↑+13.4%
↓ Low demand
- Coffee, tea, spicesUS$ 50.5 mn → US$ 41.3 mn↓-18.2%
Opportunity: what this country buys from the world, and from India
The country’s own recorded imports in UN Comtrade, 2024. Chapters with the biggest gap between what it buys from the world and what it buys from India.
Our product guides that sell here
India’s exports of each product to this country, 2025-26.
The 20 biggest export lines
4-digit HS lines, 2025-26, with their Harmonized System descriptions.
What India buys from Spain
India’s imports from this country in 2025-26 by HS chapter, from TradeStat — this country can be your supplier too.
- India’s imports, 2025-26
- US$ 2.23 bn US$ 2.22 bn → US$ 2.23 bn
- India’s exports, 2025-26
- US$ 6.96 bn
- Trade balance
- +US$ 4.73 bn exports minus imports
- Change in imports
- +0.7%
The country at a glance
- Population
- 49.4 mn 2025
- GDP
- US$ 1,906.5 bn 2025
- GDP per person
- US$ 38,627 2025
- Imports (goods and services)
- US$ 625.6 bn 2025
Sources: TradeStat — Export Import Data Bank, Department of Commerce · UN Comtrade database (United Nations Statistics Division) · World Bank — World Development Indicators · Figures taken 29 October 2026.
What to send to Spain
All products →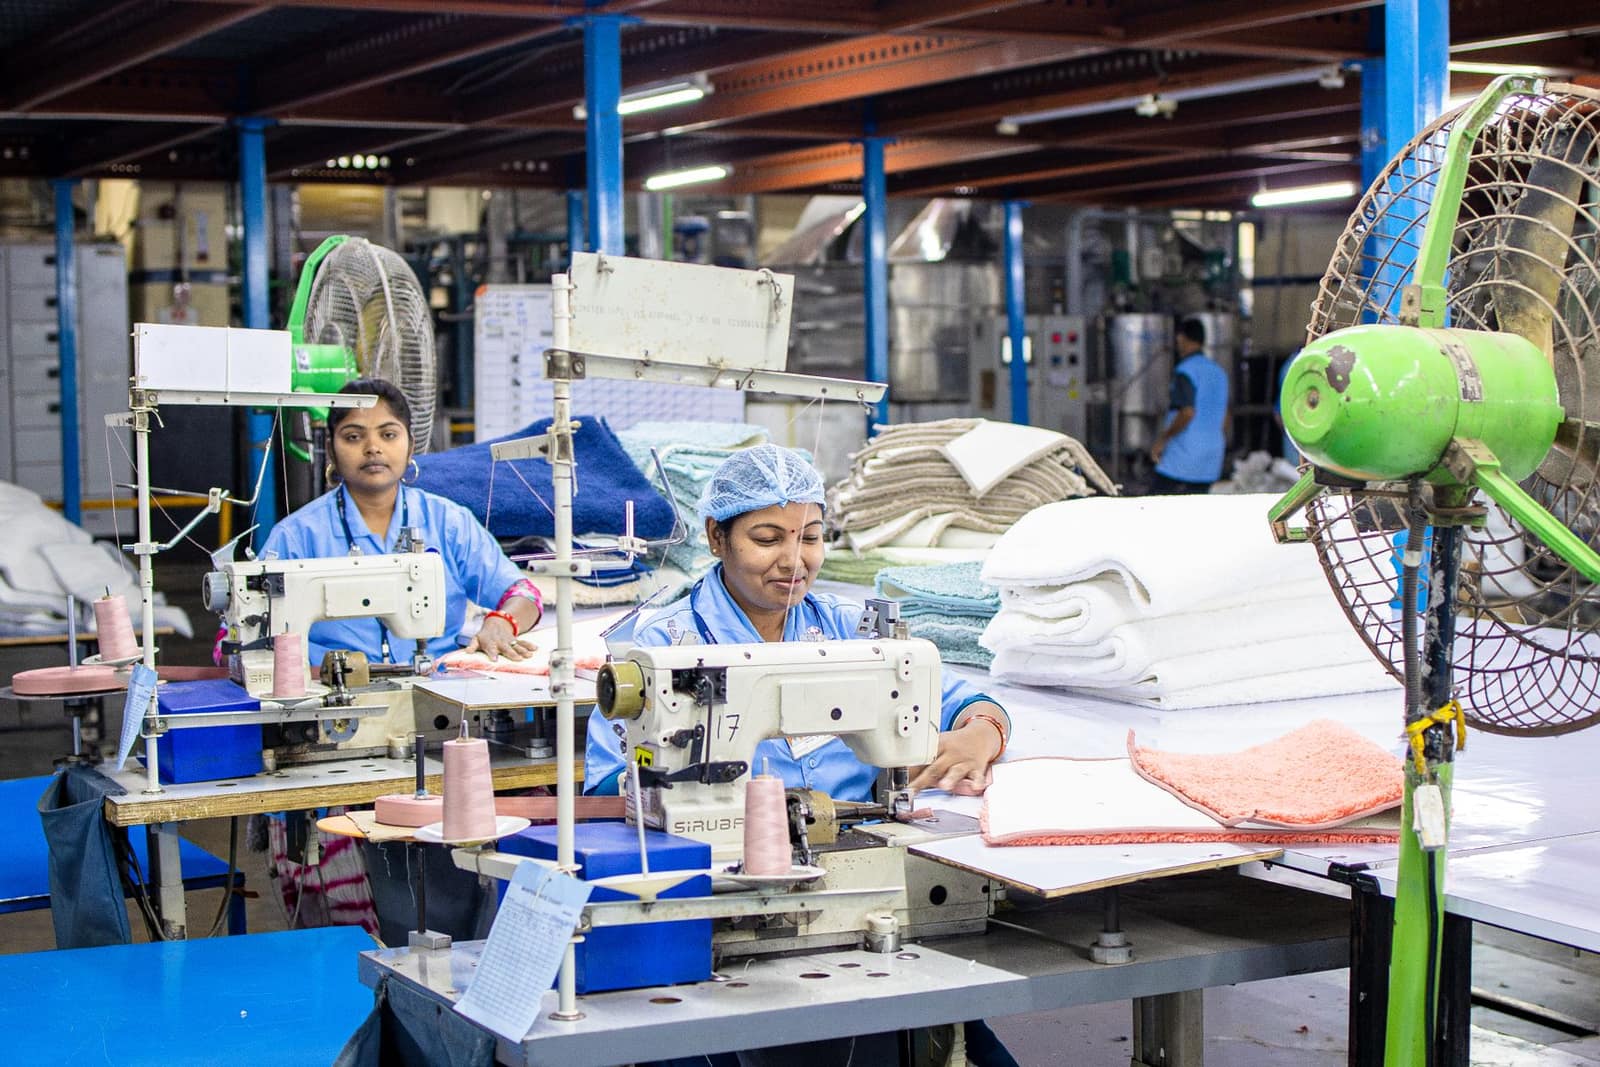 Free to exportTextiles & apparelReadymade garmentsKnitted and woven clothing for brands and retailers; the USA, UK, UAE and the EU are the big buyers.HS6109.10Exports 2025-26US$ 15.8 bn ↓1.2%
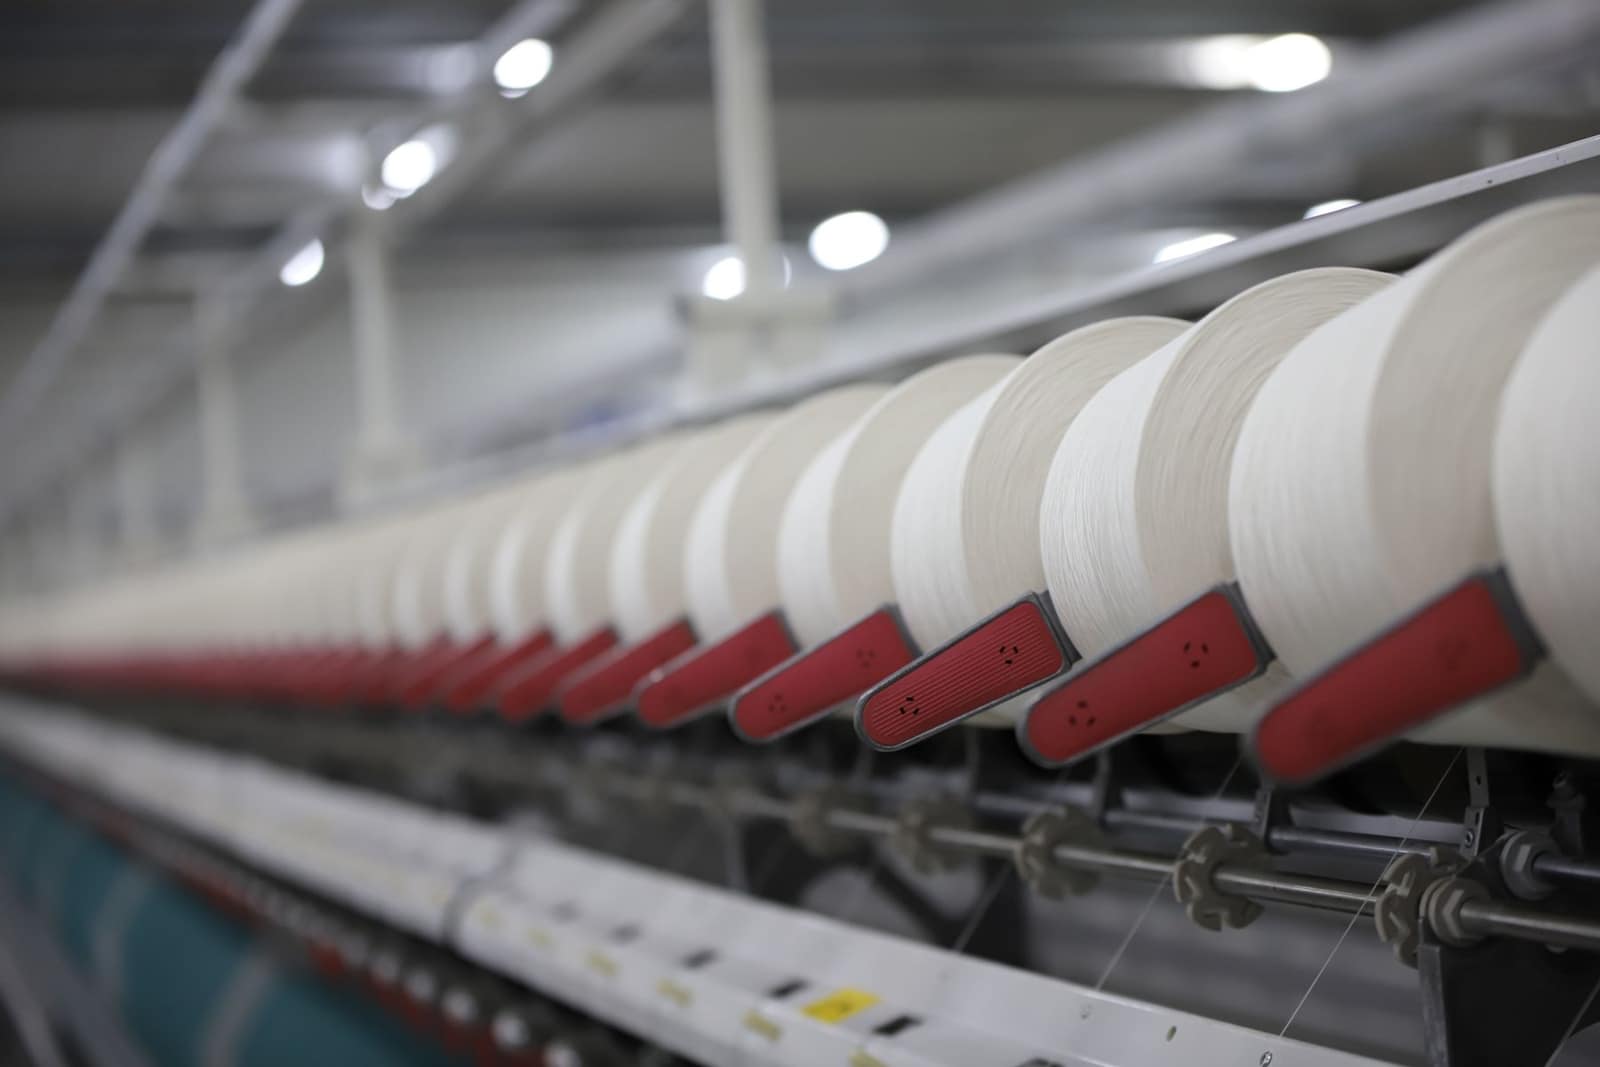 Free to exportTextiles & apparelCotton yarnBulk cotton yarn sold to weaving and knitting mills abroad; Bangladesh is by far the largest buyer.HS5205Exports 2025-26US$ 3.22 bn ↓4.1%
 Free to exportTextiles & apparelHome textiles (bed, bath and kitchen linen)Bedsheets, towels and kitchen linen for retailers; the USA buys more than half of India's exports.HS6302Exports 2025-26US$ 2.01 bn ↓5.7%
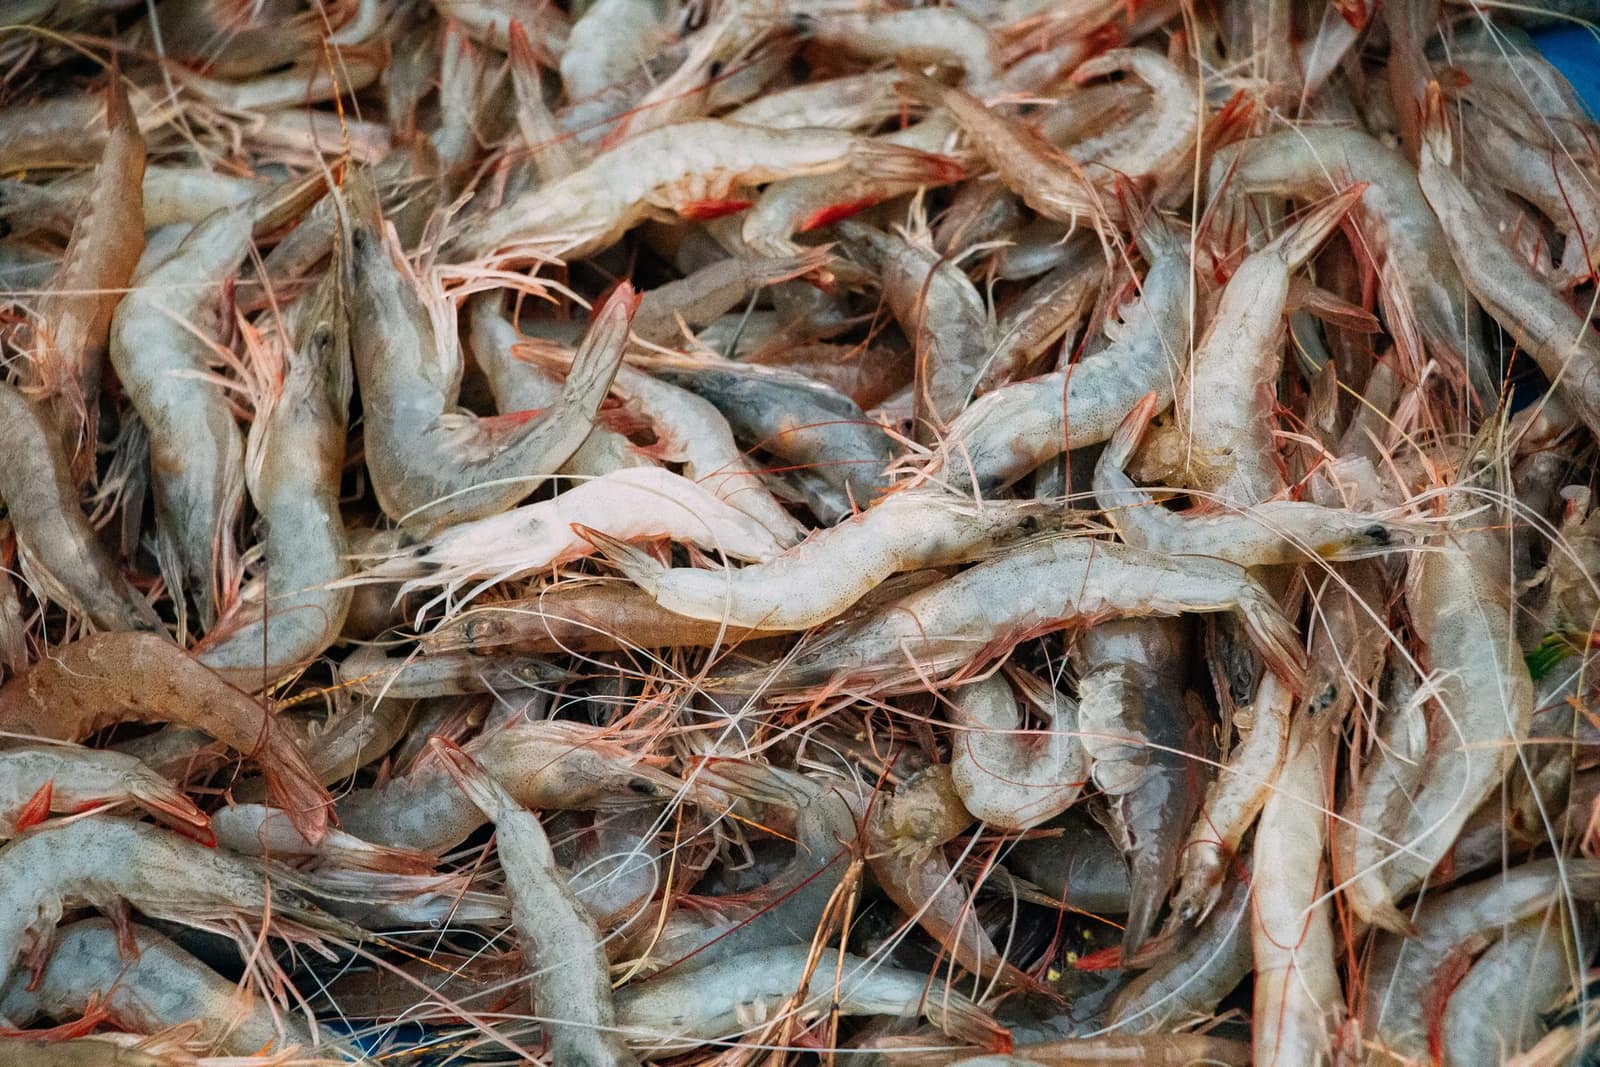 Free to exportMarineFrozen shrimpIndia’s top seafood export. Needs MPEDA registration and an EIC-approved plant; residue testing and US trade measures shape the business.HS0306.17Exports 2025-26US$ 5.61 bn ↑9.1%
 Free to exportFarm produceSpicesWhole, ground and blended spices. Spices Board registration (CRES) is compulsory; residue and ethylene oxide tests keep buyers.HS0904–0910Exports 2025-26US$ 3.12 bn ↓5.1%
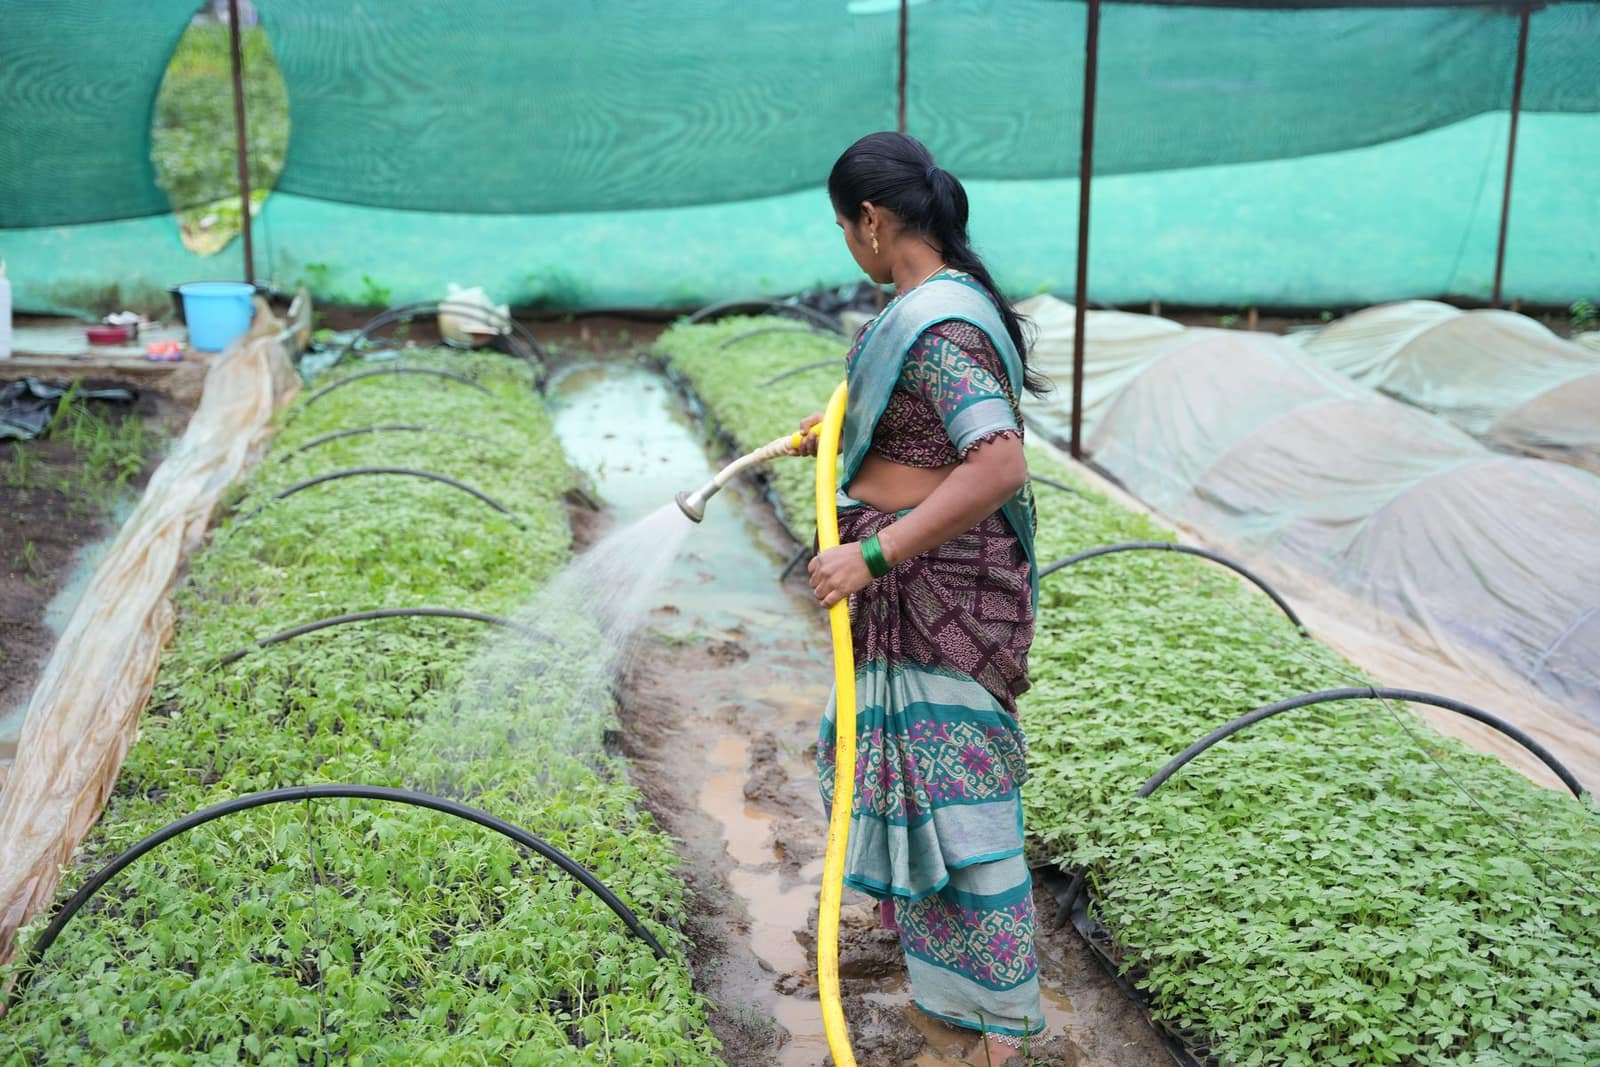 Free, with conditionsFarm produceOrganic productsCertified organic grains, oilseeds, spices, tea and processed foods. Only NPOP certification lets you export as "organic".HSVaries
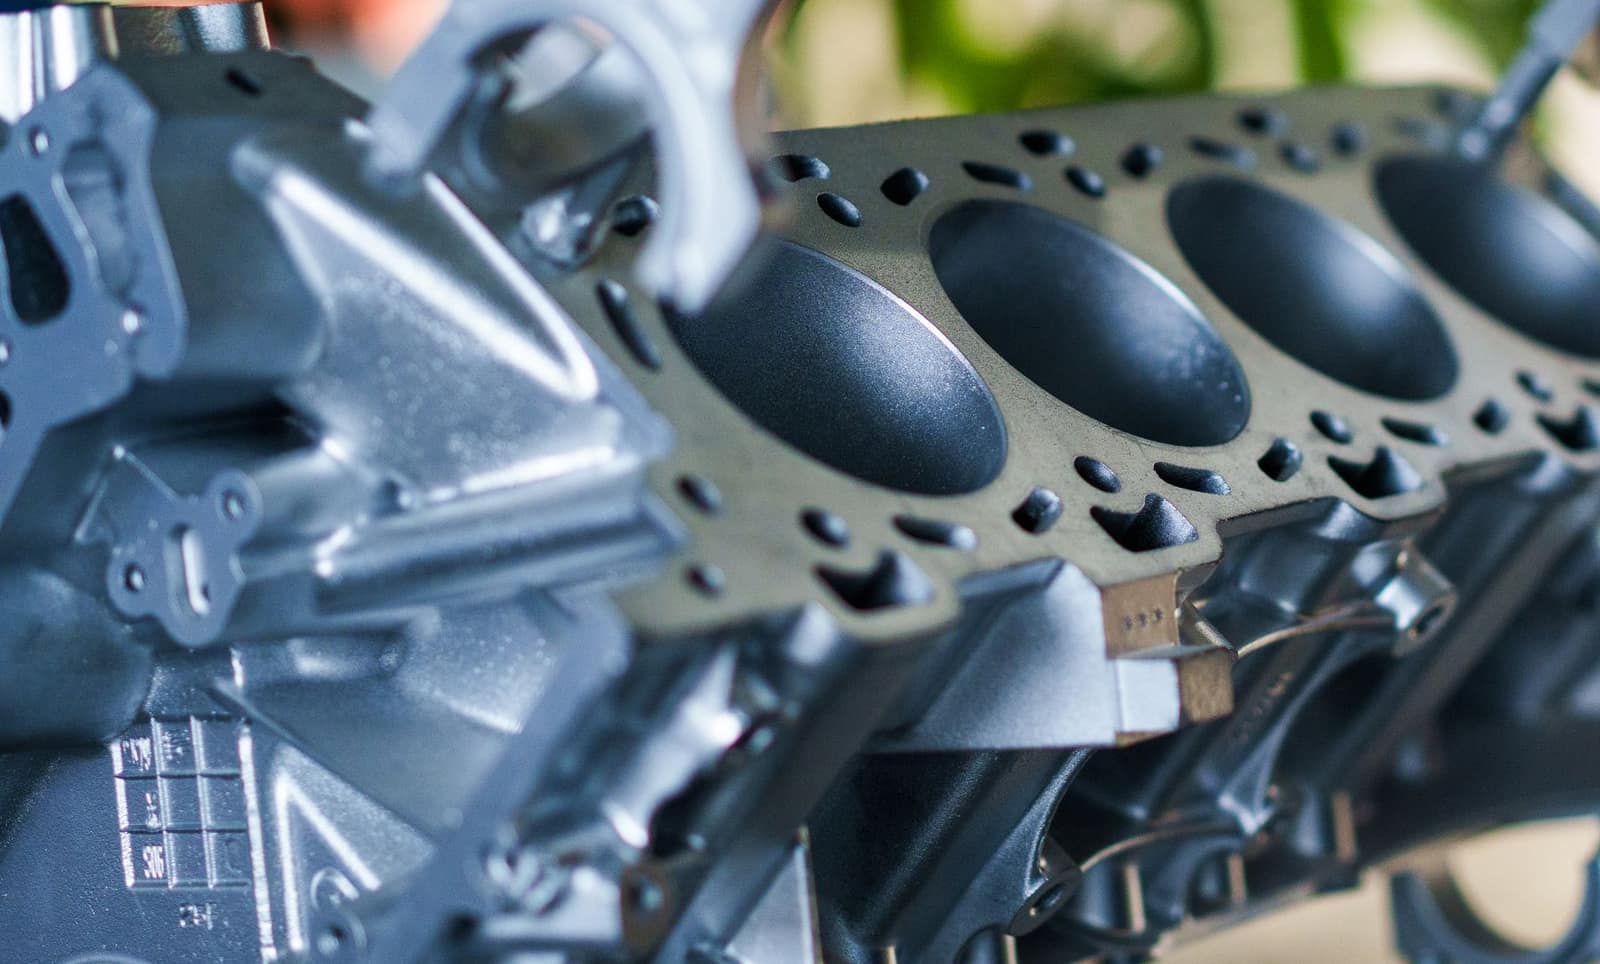 Free to exportEngineering goodsAuto parts and componentsOEM and aftermarket vehicle parts; the USA, Germany and Italy buy most, with strong demand in Latin America.HS8708Exports 2025-26US$ 7.64 bn ↑1.8%
 Free to exportEngineering goodsIron and steel castingsGrey and ductile iron and steel castings from Kolhapur, Rajkot, Coimbatore and Howrah; the USA leads.HS7325Exports 2025-26US$ 1.25 bn ↑3.2%
More in Europe
 CETAGBPLondonUnited KingdomNew CETA in force since July 2026 — most Indian goods now enter duty-free. Strong market for garments, food and engineering.From India 2025-26US$ 13.4 bn
 EURAmsterdamNetherlandsEurope's main gateway: Rotterdam handles goods for the whole EU. EU food-safety and residue rules apply.From India 2025-26US$ 17.5 bn
 EURBerlinGermanyEurope's largest economy and India's biggest EU partner. Values quality, certificates and supply-chain transparency.From India 2025-26US$ 11.5 bn
 EURParisFranceFashion, food and design market. EU rules plus French-language labels; SIAL Paris is a key food fair.From India 2025-26US$ 7.1 bn