


Europe
Export to Türkiye
Large manufacturing economy that buys Indian yarn, chemicals and machinery parts. Extra import duties apply to many goods.
- Capital
- Ankara
- Currency
- TRY
- Trade agreement with India
- None
- Main ports
- Mersin, Ambarlı (Istanbul), İzmir
Türkiye is a big industrial buyer: its textile, automotive and chemical industries import Indian yarn, fibres, organic chemicals, auto parts and machinery. It is in a customs union with the EU for industrial goods, so many EU standards apply. On top of the normal duty, Türkiye charges additional customs duties on many goods from countries without a trade agreement, including India.

What it buys from India
- Cotton and synthetic yarn and fibres
- Organic chemicals, dyes and medicines
- Auto parts, machinery and iron and steel products
Import rules on their side
- Check the full duty, including any additional customs duty, on the Ministry of Trade’s tariff for your HS code. Some goods also face anti-dumping or surveillance measures.
- Food and plant products need clearance from the Ministry of Agriculture and Forestry, with health or phytosanitary certificates; labels need Turkish.
- Industrial goods under product-safety rules need CE marking or Turkish standards (TSE) conformity, much like in the EU.
Practical tips
- Turkish buyers bargain hard and compare prices with Chinese and Central Asian suppliers. Quote clearly in US dollars or euros.
- The Turkish lira has been volatile; prefer an LC or advance payment until the buyer has a track record with you.
- There is no trade agreement, so the buyer pays the normal (most-favoured-nation) duty. Ask the buyer or a local customs broker for the duty on your exact HS code before you quote a landed price.
Sources (6)
- Republic of Türkiye Ministry of Trade — import
- Republic of Türkiye Ministry of Agriculture and Forestry
- Turkish Standards Institution (TSE)
- Department of Commerce — TradeStat export-import data bank
- Indian Trade Portal (FIEO / Department of Commerce) — market access by country
- WTO — Regional Trade Agreements database
Trade data
India’s exports to Türkiye in numbers
From the Department of Commerce’s TradeStat (Indian financial years, April–March), the country’s imports from the world from UN Comtrade, and its basics from the World Bank.
- India’s exports here, 2025-26
- US$ 4.54 bn No. 28 of our 80 countries
- Change from 2024-25
- ↓ -20.5% US$ 5.72 bn → US$ 4.54 bn
- Share of all Indian exports
- 1.03%
- Its imports from the world
- —
What India sells here most
By HS chapter, 2025-26. Change is against 2024-25.
What is rising and what is falling
Chapters where India sells at least US$ 5 million. Change from 2024-25 to 2025-26.
↑ High demand
- Animal feed and food residuesUS$ 12.7 mn → US$ 59.8 mn↑+372.7%
- Gems, jewellery, precious metalsUS$ 32.7 mn → US$ 67.1 mn↑+105%
- Coffee, tea, spicesUS$ 40.2 mn → US$ 75.6 mn↑+88%
- Iron and steelUS$ 280 mn → US$ 446 mn↑+59%
- Fats and oilsUS$ 28.3 mn → US$ 36.3 mn↑+28.2%
- Stone, plaster, cement articlesUS$ 39.5 mn → US$ 49.7 mn↑+25.8%
- Cereals (rice, wheat, maize)US$ 78.5 mn → US$ 95.2 mn↑+21.3%
- Essential oils, cosmeticsUS$ 24.8 mn → US$ 28.7 mn↑+15.9%
↓ Low demand
- AluminiumUS$ 764 mn → US$ 176 mn↓-76.9%
- Fuels and petroleum productsUS$ 147 mn → US$ 84.5 mn↓-42.5%
- Vehicles and partsUS$ 663 mn → US$ 424 mn↓-36%
- CottonUS$ 65.2 mn → US$ 46.5 mn↓-28.6%
- Man-made filamentsUS$ 165 mn → US$ 122 mn↓-25.8%
- MachineryUS$ 576 mn → US$ 435 mn↓-24.6%
- PlasticsUS$ 130 mn → US$ 101 mn↓-21.8%
- TobaccoUS$ 51 mn → US$ 40.9 mn↓-19.9%
Our product guides that sell here
India’s exports of each product to this country, 2025-26.
The 20 biggest export lines
4-digit HS lines, 2025-26, with their Harmonized System descriptions.
What India buys from Türkiye
India’s imports from this country in 2025-26 by HS chapter, from TradeStat — this country can be your supplier too.
- India’s imports, 2025-26
- US$ 2.34 bn US$ 2.99 bn → US$ 2.34 bn
- India’s exports, 2025-26
- US$ 4.54 bn
- Trade balance
- +US$ 2.2 bn exports minus imports
- Change in imports
- -21.7%
The country at a glance
- Population
- 85.9 mn 2025
- GDP
- US$ 1,597.3 bn 2025
- GDP per person
- US$ 18,599 2025
- Imports (goods and services)
- US$ 400.7 bn 2025
Sources: TradeStat — Export Import Data Bank, Department of Commerce · World Bank — World Development Indicators · Figures taken 29 October 2026.
What to send to Türkiye
All products →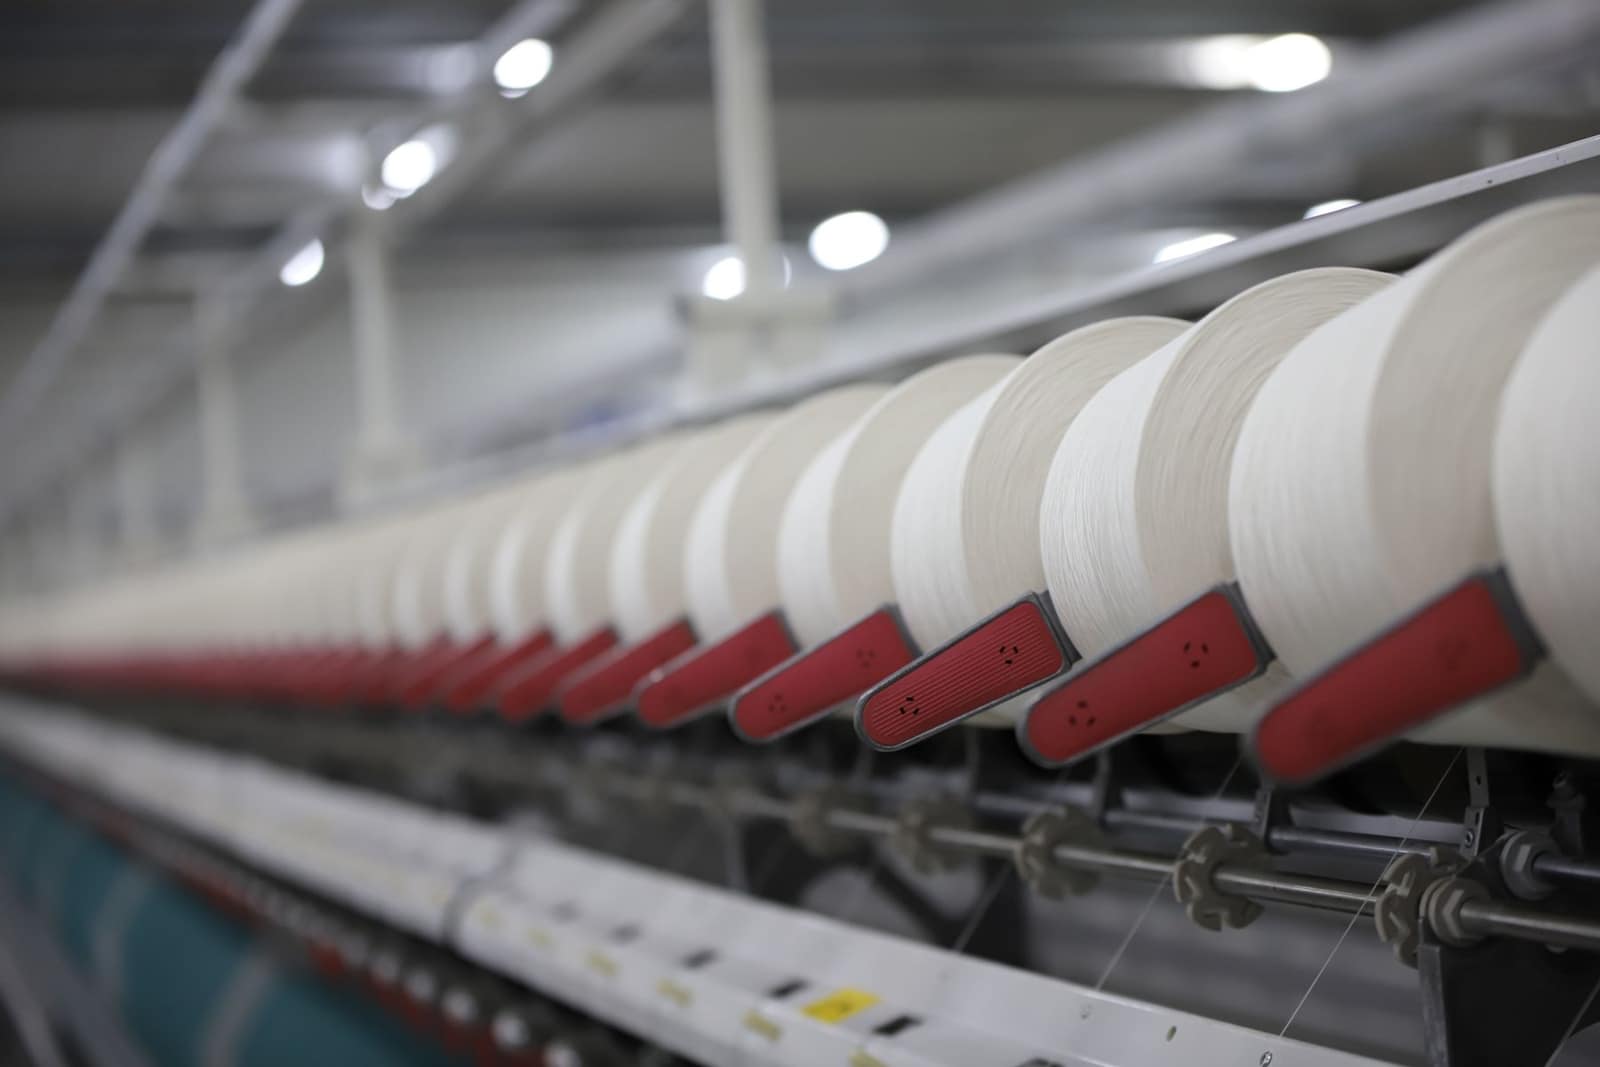 Free to exportTextiles & apparelCotton yarnBulk cotton yarn sold to weaving and knitting mills abroad; Bangladesh is by far the largest buyer.HS5205Exports 2025-26US$ 3.22 bn ↓4.1%
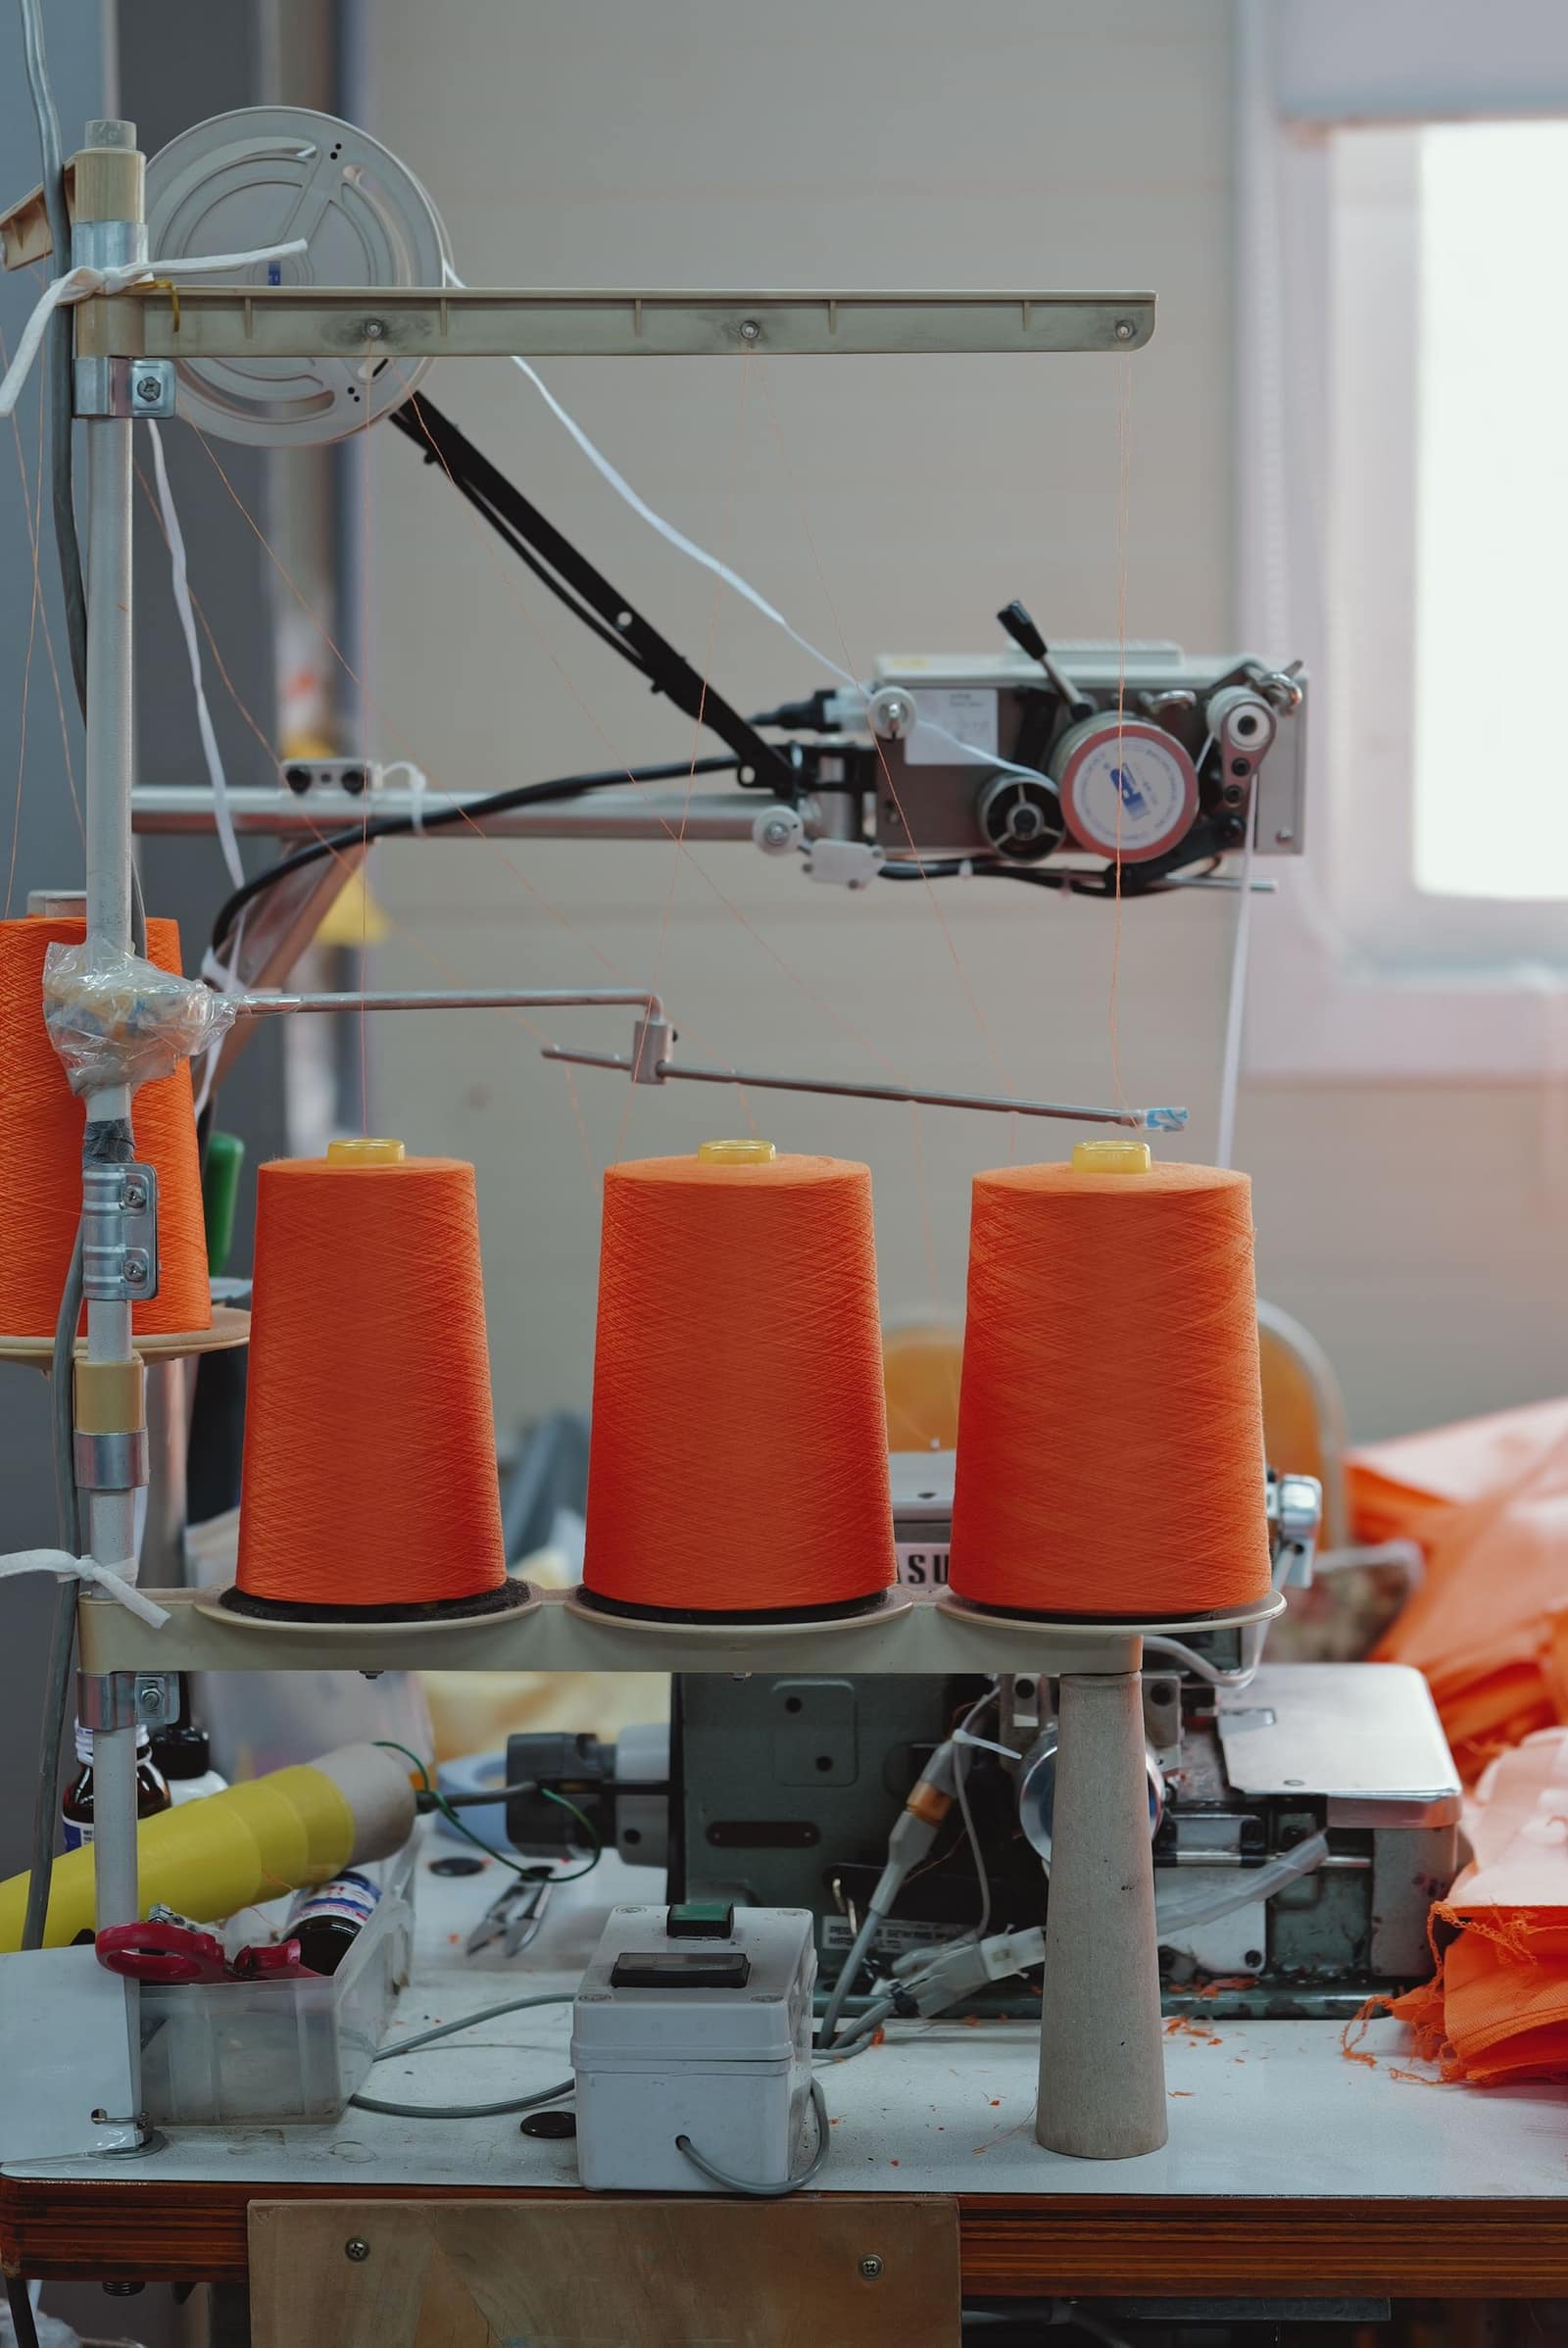 Free to exportTextiles & apparelPolyester and synthetic yarnPolyester filament and spun yarns from Surat, Silvassa and Bhilwara, sold to weavers and knitters abroad.HS5402Exports 2025-26US$ 1.06 bn ↓16.8%
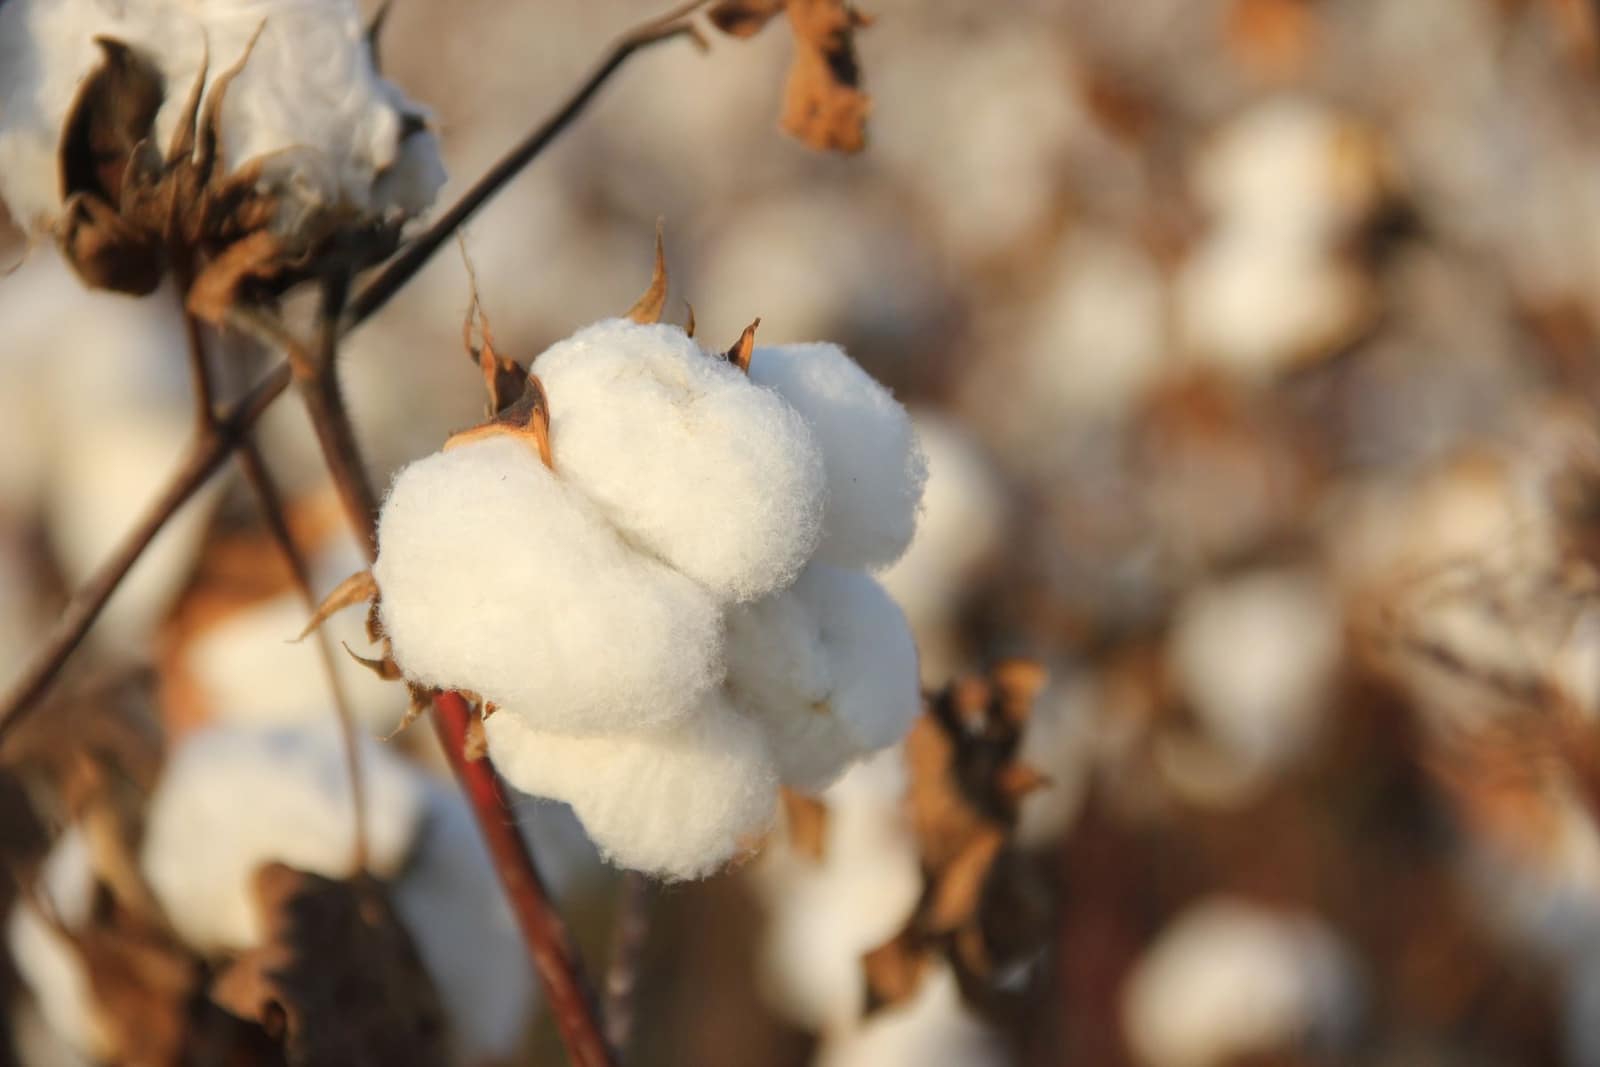 Free to exportTextiles & apparelRaw cottonGinned cotton bales from Gujarat, Maharashtra and Telangana, sold mainly to spinning mills in Bangladesh, Vietnam and China.HS5201Exports 2025-26US$ 436 mn ↓33.9%
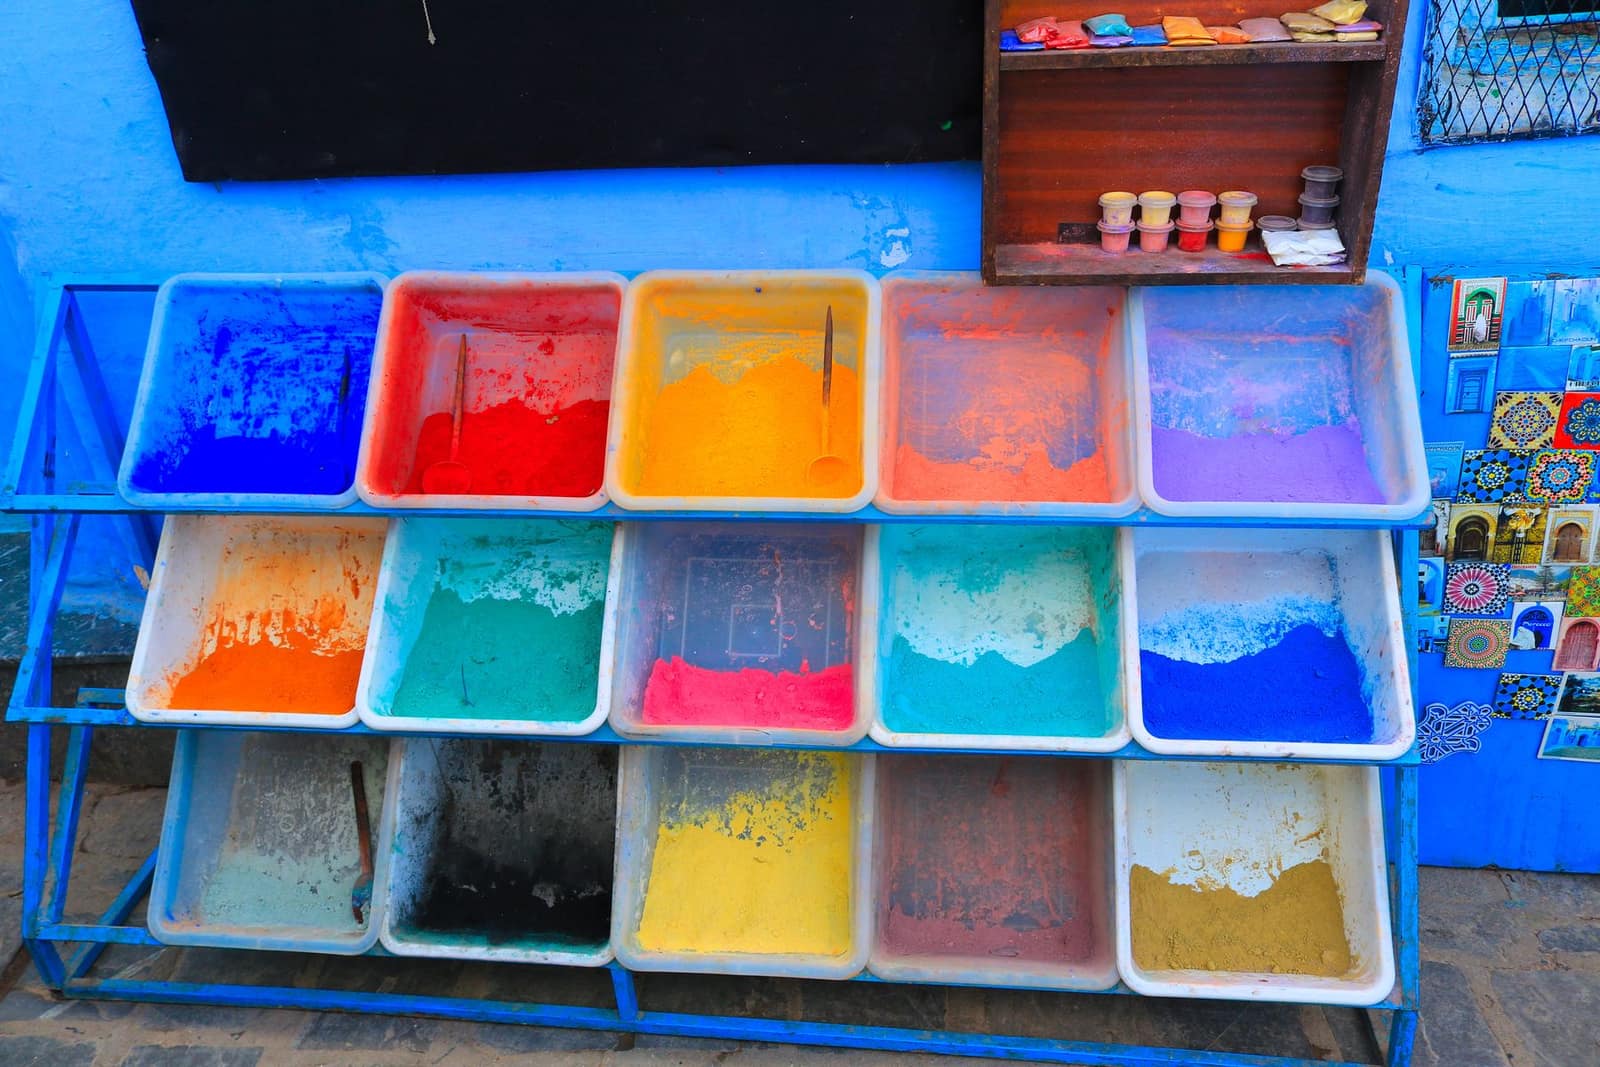 Free to exportPharma & chemicalsDyes and pigmentsReactive and disperse dyes and organic pigments from Gujarat and Maharashtra; textile hubs in Asia and Europe buy them.HS3204Exports 2025-26US$ 2.46 bn ↓8.7%
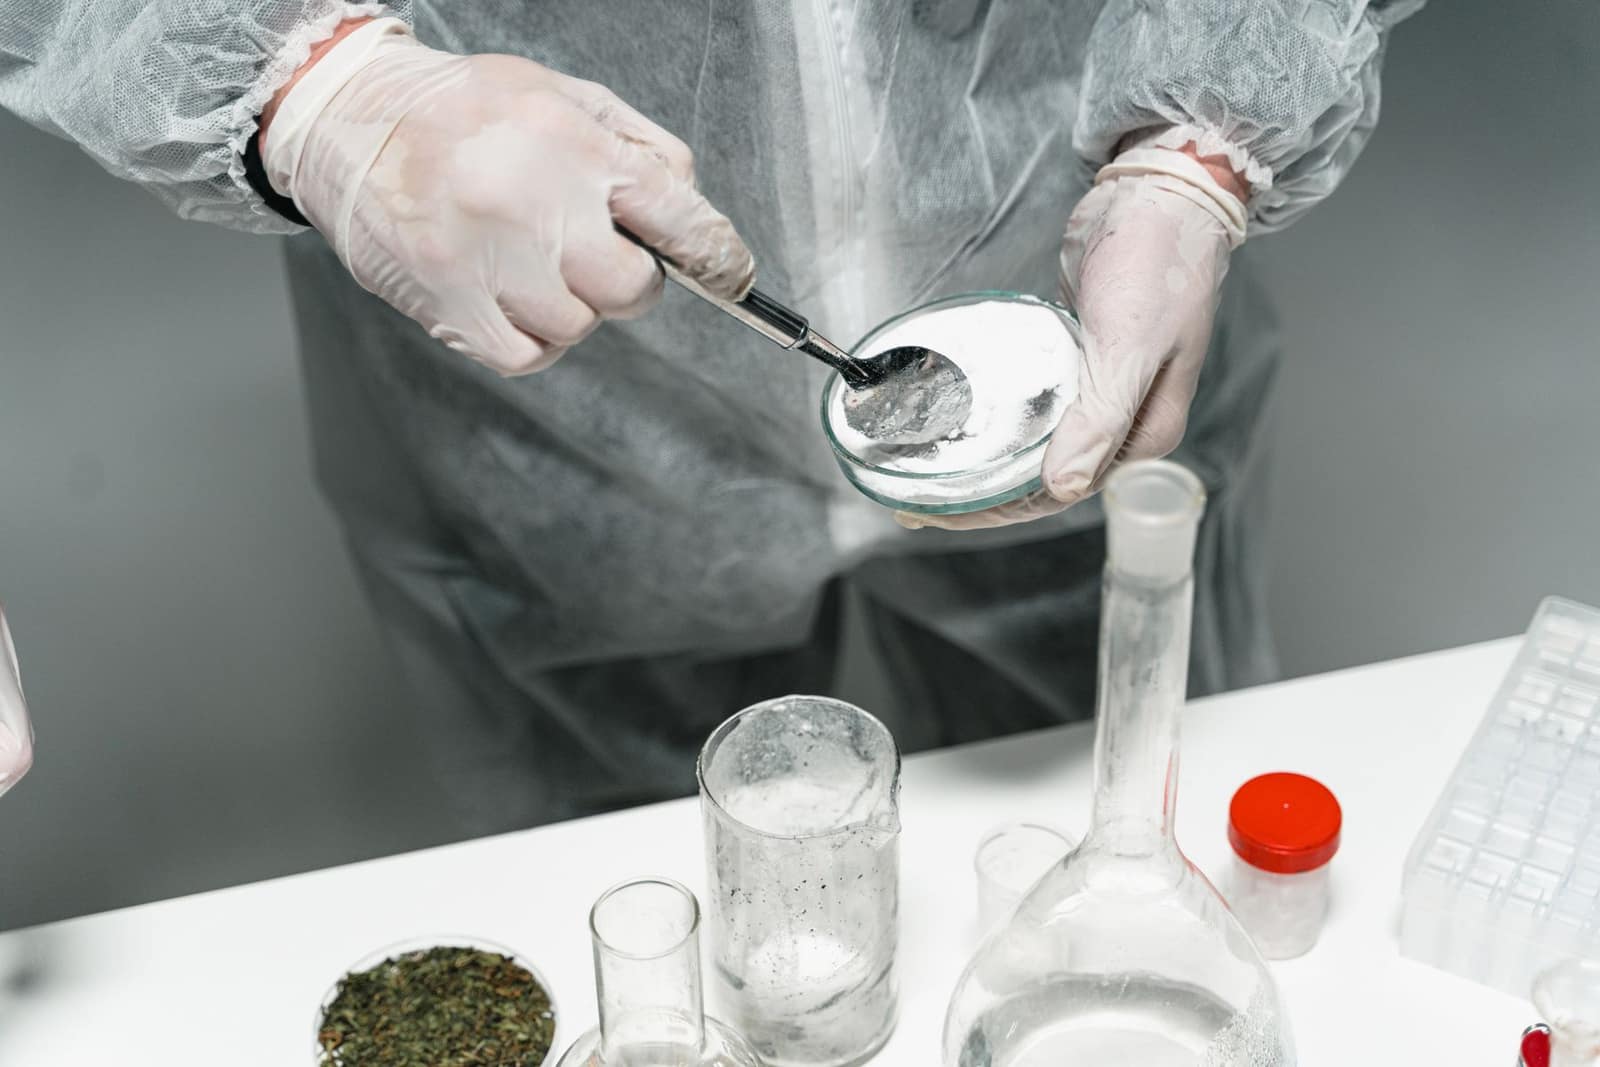 Free to exportPharma & chemicalsBulk drugs (APIs)APIs and intermediates from Hyderabad, Visakhapatnam and Gujarat; regulated buyers need DMFs and GMP inspections.HS2933Exports 2025-26US$ 7.78 bn ↓0.6%
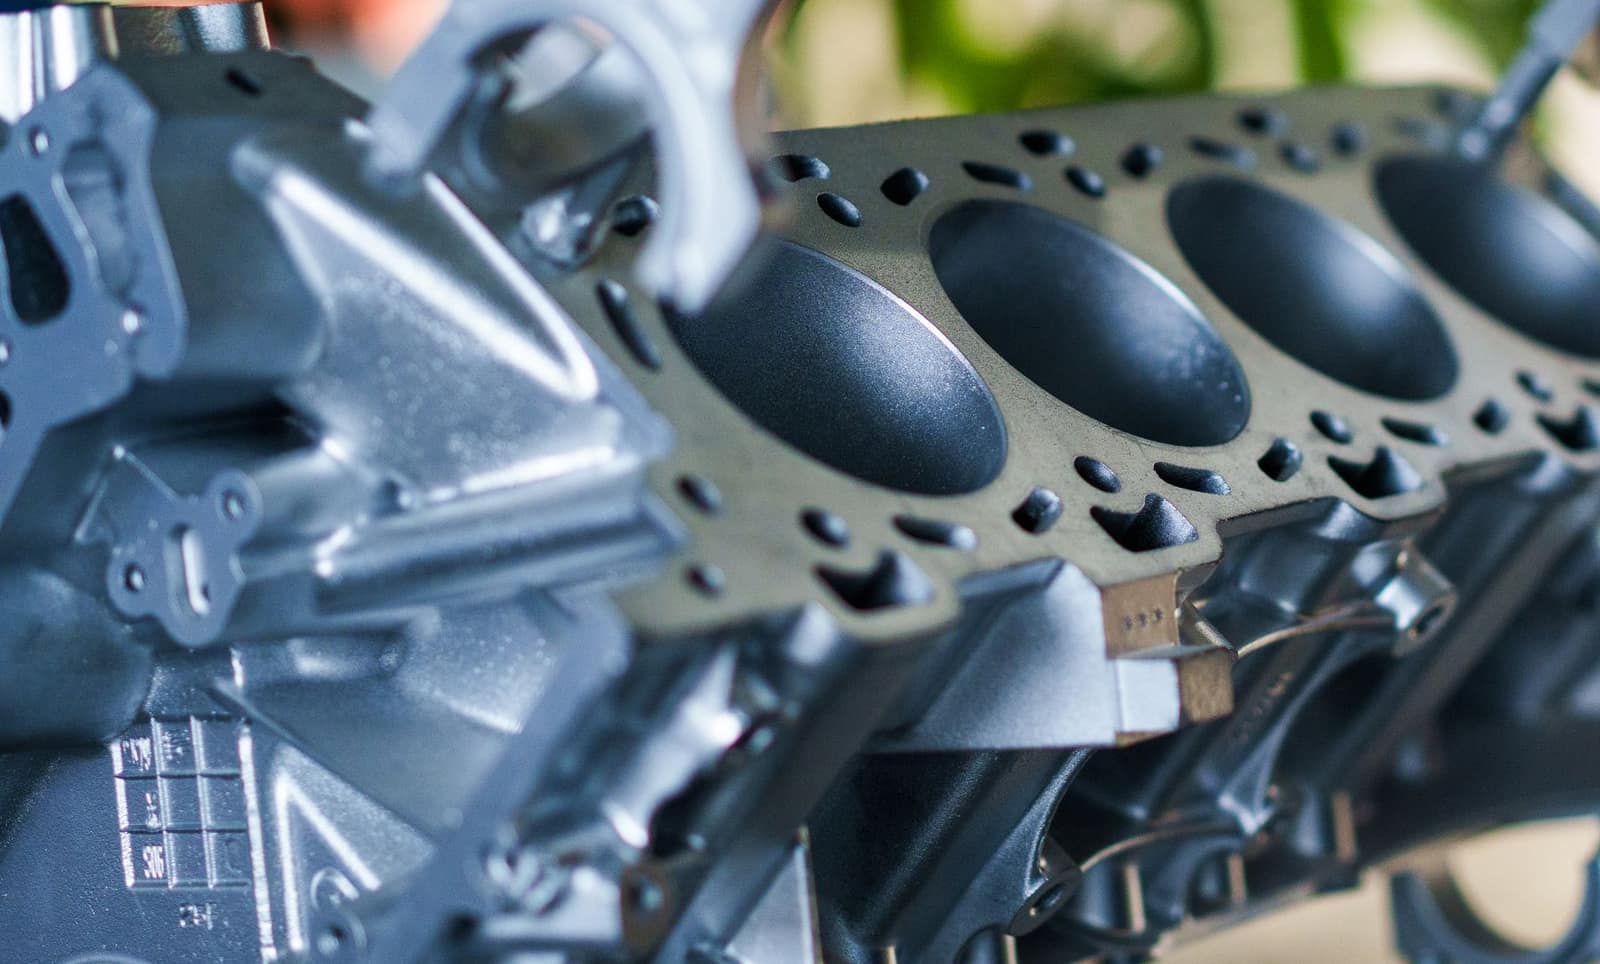 Free to exportEngineering goodsAuto parts and componentsOEM and aftermarket vehicle parts; the USA, Germany and Italy buy most, with strong demand in Latin America.HS8708Exports 2025-26US$ 7.64 bn ↑1.8%
 Free to exportEngineering goodsIron and steel castingsGrey and ductile iron and steel castings from Kolhapur, Rajkot, Coimbatore and Howrah; the USA leads.HS7325Exports 2025-26US$ 1.25 bn ↑3.2%
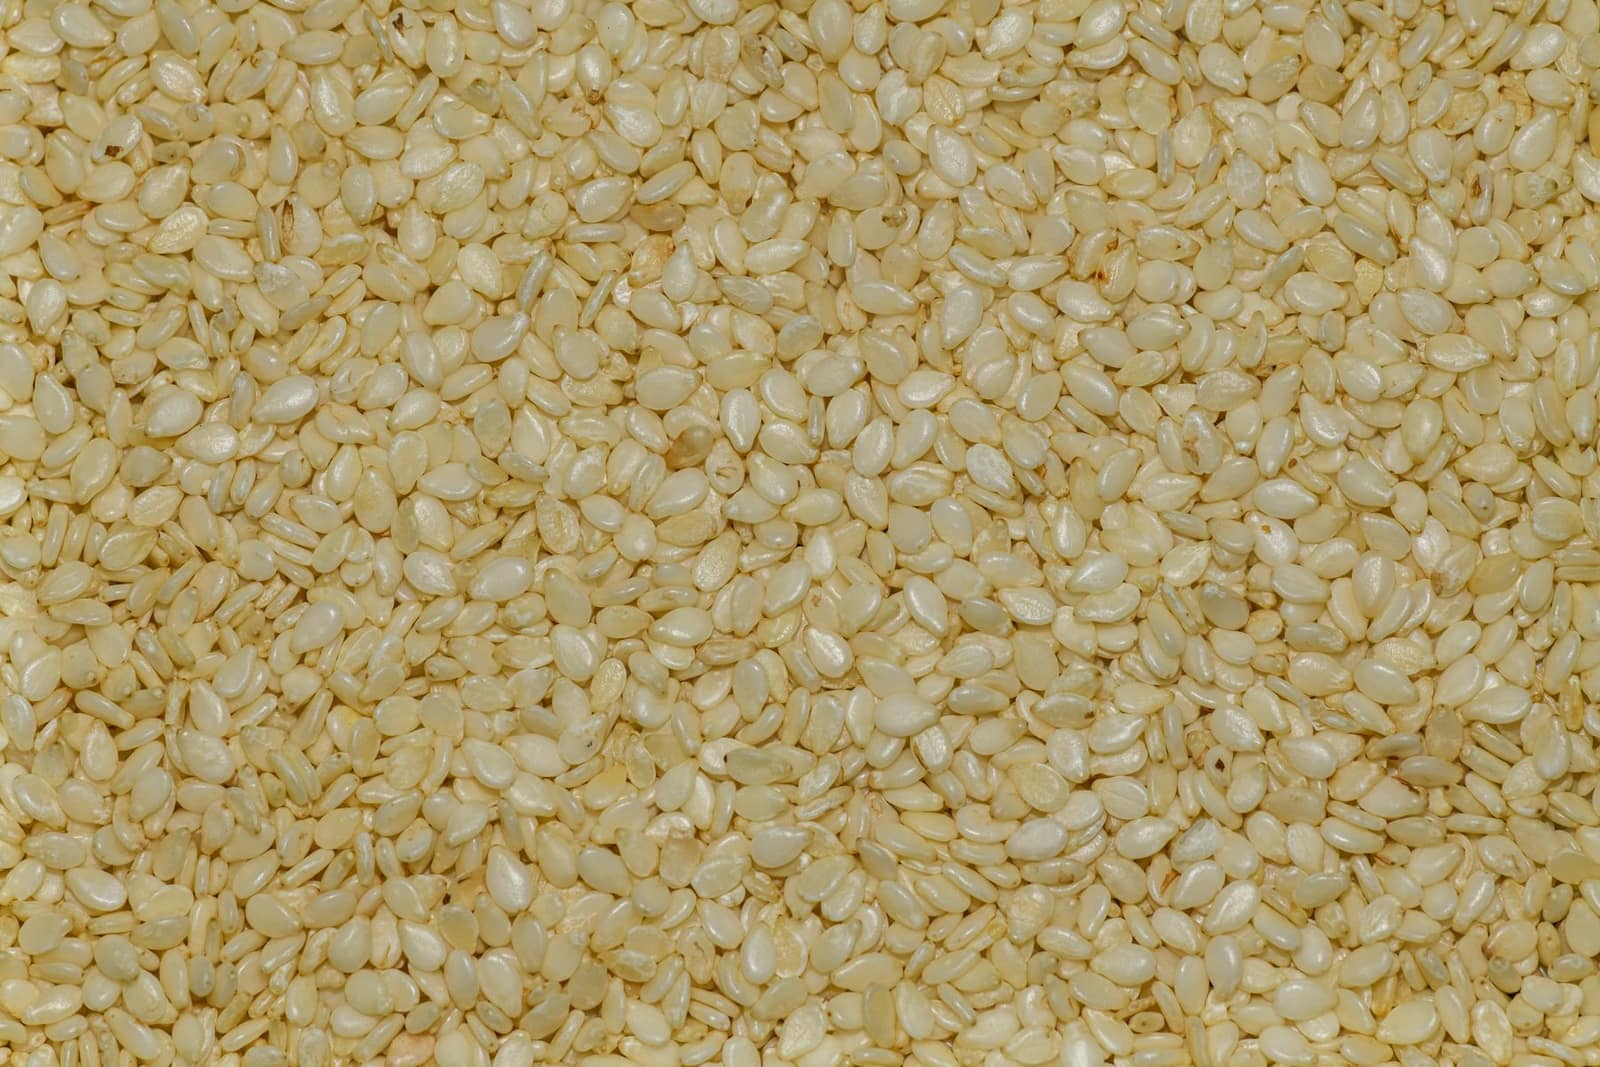 Free to exportFarm produceSesame seed (til)Natural and hulled sesame from Gujarat, Rajasthan, MP and UP. EU shipments need an IOPEPC Certificate of Export and strict residue testing.HS1207.40Exports 2025-26US$ 423 mn ↓13.8%
More in Europe
 CETAGBPLondonUnited KingdomNew CETA in force since July 2026 — most Indian goods now enter duty-free. Strong market for garments, food and engineering.From India 2025-26US$ 13.4 bn
 EURAmsterdamNetherlandsEurope's main gateway: Rotterdam handles goods for the whole EU. EU food-safety and residue rules apply.From India 2025-26US$ 17.5 bn
 EURBerlinGermanyEurope's largest economy and India's biggest EU partner. Values quality, certificates and supply-chain transparency.From India 2025-26US$ 11.5 bn
 EURParisFranceFashion, food and design market. EU rules plus French-language labels; SIAL Paris is a key food fair.From India 2025-26US$ 7.1 bn