

Pharma & chemicals
Export plastic raw materials (polymers)
Polyethylene, polypropylene, PVC and PET granules from big refineries; Nepal, China, Kenya and Vietnam lead.
- HS code
- 3901 Polymers in primary forms — polyethylene (3901), polypropylene (3902), polystyrene and ABS (3903), PVC (3904), polyesters such as PET and epoxy resins (3907).
- Export policy
- Free to export Free to export under ITC(HS) Schedule 2 as checked in November 2026. Plastic waste and scrap have separate, stricter entries; check them if you deal in recycled material. Confirm your exact 8-digit line on the DGFT ITC(HS) search before you ship.
- Registrations
- 3 IEC, GST and those below
- India’s exports, 2025-26
- US$ 1.84 bn to 142 countries
What is exported
Polymers are made by large refinery and petrochemical complexes in Gujarat (Jamnagar, Dahej, Hazira, Vadodara), Haryana (Panipat), West Bengal (Haldia), Assam and Maharashtra; traders and distributors resell their output abroad. In 2025-26 India exported about US$ 435 million of polyethylene (HS 3901), led by Nepal, China, Kenya and Vietnam, about US$ 303 million of polypropylene (3902) and about US$ 736 million of polyesters (3907), led by the USA, the UAE and Singapore.
Varieties, grades and forms
- Polyethylene (LLDPE, LDPE, HDPE)Film, moulding and pipe grades (3901).
- PolypropyleneHomopolymer and copolymer for raffia, moulding and fibre (3902).
- PVC resinSuspension and emulsion grades for pipes and profiles (3904).
- PET and polyestersBottle-grade PET chips, alkyd and epoxy resins (3907).
- Polystyrene and ABSGPPS, HIPS, EPS and ABS (3903).
Where it is grown or made
- GujaratJamnagar, Dahej, Hazira and Vadodara
- HaryanaPanipat
- West Bengal and AssamHaldia; Lepetkata (Dibrugarh)
- Maharashtra and KarnatakaNagothane, Mumbai; Mangaluru
The quality buyers ask for
- Grade
- Producer grade code (film, injection, blow, pipe, raffia, fibre)
- Melt flow index
- MFI in g/10 min at stated test conditions (ASTM D1238 / ISO 1133)
- Density
- g/cm³ (for example 0.918–0.965 for polyethylene)
- PVC K-value
- K-value and bulk density for PVC resin
- PET IV
- Intrinsic viscosity (dl/g) for bottle and fibre grades; acetaldehyde for bottle grade
Certificates
- Producer certificate of analysisRequiredRequired with every lot.
- Food-contact declarations (EU 10/2011, FDA 21 CFR 177)Often askedFor grades used in food packaging.
- REACH status of monomers and additivesOften askedEU buyers need confirmation that monomers and additives are registered.
- Producer distributor authorisationOften askedProves you are an authorised channel for the producer's grades.
Shipping, storage and shelf life
A 40-ft container typically holds about 24–26 tonnes of granules in 25 kg bags on pallets or floor-loaded; a 20-ft carries about 16–18 tonnes.
Sea freight; road and rail to Nepal and Bangladesh.
Dry, shaded storage; protect bags from sunlight and rain.
What goes on the pack and carton
- Producer name, grade code, lot number, net weight and production date on each bag.
- Pallet and container marks matching the packing list and bill of lading.
CIPET centres across India test polymer properties (MFI, density, mechanical tests). NABL-accredited polymer labs also test grades and food-contact migration.
Benefits of exporting this product
- RoDTEP: 1.5% of FOB
Tariff item 3901 10 20 (low density polyethylene (LDPE)) earns 1.5% of FOB value, capped at ₹1 per kg, as a duty credit scrip on ICEGATE. Polypropylene (3902 10 00) carries 1.4% and PET chips (3907 61 10) 1.3%, both without a cap. These rates continue to 31 Dec 2026 (DGFT Notification 41/2026-27). Confirm your exact 8-digit line on the DGFT RoDTEP page before you price an order.
DGFT — Appendix 4R, RoDTEP schedule for DTA exports w.e.f. 10.10.2024 (Notification 32/2024-25); rates continued to 31.12.2026 by Notification 41/2026-27 ↗ - Duty drawback: 1.2% of FOB
Drawback item 3901 (polymers of ethylene in primary forms) has an All Industry Rate of 1.2% of FOB, paid into your bank account. It is not available on exports under Advance Authorisation or from EOU/SEZ units. Polypropylene (3902) and polystyrene (3903) also have 1.2%; epoxy resin (390701) has 2.5% capped at ₹10.4/kg. Check the current schedule on the CBIC drawback page before shipping.
Gazette of India — Notification 77/2023-Customs (N.T.) dated 20.10.2023: All Industry Rates of duty drawback ↗
Where to register
- PLEXCONCILAll plastics products, including plastic raw materials, are listed under PLEXCONCIL in Appendix 2T; take your RCMC from PLEXCONCIL.plexconcil.org ↗
Quality and checks
- Grade data sheet and certificate of analysis per lot (melt flow index, density, additives); buyers match grade codes exactly.
- EU REACH: polymers themselves are exempt from registration, but their monomers and additives must be registered; food-contact grades need EU Regulation (EU) 10/2011 compliance.
- Moisture-proof bags and clean, dry containers; contamination complaints are the most common claim.
Polymer exports run through producers and their authorised distributors. A newcomer can become a distributor or buy from one, then sell to plastics processors in Nepal, Bangladesh, Sri Lanka or East Africa, full container loads on LC.
Where new exporters go wrong
- Prices follow crude oil and Asian benchmarks; quotes go stale within days.
- Selling off-grade or recycled material as prime grade.
- Wet or torn bags from poor stuffing — use liners and dunnage.
Documents this product needs
Schemes that apply
- RoDTEP Remission of Duties and Taxes on Exported Products
- Drawback Duty Drawback (All Industry Rates)
- Advance Authorisation Advance Authorisation
- EPCG Export Promotion Capital Goods Scheme
- ECGC ECGC export credit insurance for small exporters
- LUT Letter of Undertaking for zero-rated exports under GST
- Status Holder Status Holder certificate (One to Five Star Export House)
- MAI / MAS Market Access Initiative (now Market Access Support under EPM)
Sources (5)
- Department of Commerce, Export Import Data Bank — India's exports of HS 3901 by country, 2025-26
- DGFT — Appendix 2T: Export Promotion Councils and the products under each
- DGFT — ITC(HS) export policy search (Schedule 2) and SCOMET list (Appendix 3)
- ECHA — Understanding REACH
- PLEXCONCIL (Plastics Export Promotion Council) — official site
Trade data
Indian plastic raw materials (polymers) exports in numbers
From the Department of Commerce’s TradeStat, country by country. US$, Indian financial years (April–March).
- Exports in 2025-26
- US$ 1.84 bn -7.5% a year on average, 2020-21 to 2025-26
- Change from 2024-25
- ↓ -14.8% US$ 2.16 bn → US$ 1.84 bn
- Buyer countries
- 142
- Average export price
- US$ 1.34 per kg · 1.38 mn tonnes shipped · US$ 1.31 the year before
The price cycle
India’s average export price per kg each year (total value ÷ total quantity). Highest in 2022-23, lowest in 2020-21 — a 69% swing between them. Keep this swing in mind when you quote.
What next: a projection from the trend
The past trend carried forward — not a forecast by any authority. Sudden changes in policy, prices or demand are not in it.
Likely range US$ 1.27 bn to US$ 1.84 bn.
- Trend
- -9.1% a year
- Fit (R²)
- 0.73
- Based on
- 6 years of official figures
Method: a straight line through the logarithm of yearly exports (log-linear regression); range = ±1 standard error.
Biggest buyer countries
By value in 2025-26. Change is against 2024-25.
Where demand is rising and falling
Only countries that buy at least US$ 1 million or 1% of India’s exports of this product. Change from 2024-25 to 2025-26.
↑ High demand
- CanadaUS$ 8.7 mn → US$ 39.1 mn↑+346.9%
- NetherlandsUS$ 10.6 mn → US$ 23.3 mn↑+118.8%
- TanzaniaUS$ 25.2 mn → US$ 42.2 mn↑+67.7%
- KenyaUS$ 55.1 mn → US$ 79.1 mn↑+43.5%
- AlgeriaUS$ 20.7 mn → US$ 28.1 mn↑+36.1%
- United KingdomUS$ 27 mn → US$ 31.8 mn↑+17.8%
- ItalyUS$ 52.2 mn → US$ 60.1 mn↑+15.1%
↓ Low demand
- VietnamUS$ 131 mn → US$ 57.4 mn↓-56.1%
- DjiboutiUS$ 19.1 mn → US$ 9.4 mn↓-50.6%
- BangladeshUS$ 127 mn → US$ 66.9 mn↓-47.3%
- IsraelUS$ 38 mn → US$ 21 mn↓-44.8%
- ChinaUS$ 168 mn → US$ 93.2 mn↓-44.5%
- IndonesiaUS$ 36.8 mn → US$ 22.4 mn↓-39.1%
- TürkiyeUS$ 87.3 mn → US$ 54.8 mn↓-37.3%
- JapanUS$ 40.8 mn → US$ 26.9 mn↓-34%
Which forms sell, and at what price
India’s exports by 8-digit tariff line, 2025-26. Average price = total value ÷ total quantity (TradeStat): the average of every shipment on that line, not the price of any one deal.
| Tariff line | Value 2025-26 | Change | Quantity | Average price |
|---|---|---|---|---|
Propylene, other olefin polymers, polypropylene in primary forms — polypropylene3902 10 00 | US$ 240 mn | ↓-36.3% | 2,44,049 tonnes | US$ 0.98 per kgwas US$ 1.03 |
Poly, in primary forms, having a viscosity of 78ml/g or higher — other primary form3907 61 90 | US$ 230 mn | ↓-28.4% | 2,64,078 tonnes | US$ 0.87 per kgwas US$ 0.96 |
Halogenated olefin polymers, fluoro-polymers, polytetrafluoroethylene, in primary forms — polytetrafluoroethylene3904 61 00 | US$ 134 mn | ↑+3.3% | 11,860 tonnes | US$ 11.26 per kgwas US$ 10.50 |
Others-of-other: poly(ethylene terephthalate)3907 69 90 · Poly, in primary forms, having a viscosity of less than 78ml/g | US$ 122 mn | ↓-3.2% | 1,28,805 tonnes | US$ 0.94 per kgwas US$ 1.02 |
Polyethylene hvng a spcfc grvty 0.94 /more3901 20 00 · Ethylene polymers, in primary forms, polyethylene having a specific gravity of 0.94 or more | US$ 111 mn | ↓-22.4% | 1,16,087 tonnes | US$ 0.96 per kgwas US$ 0.97 |
Halogenated olefin polymers, fluoro-polymers, in primary forms — other fluro-polymers3904 69 90 | US$ 97.5 mn | ↓-7.1% | 4,631 tonnes | US$ 21.06 per kgwas US$ 23.59 |
Linear low density polyethylene (lldpe)3901 40 10 · Ethylene polymers, in primary forms, ethylene-alpha-olefin copolymers, having a specific gravity of less… | US$ 96.9 mn | ↓-45.6% | 1,08,067 tonnes | US$ 0.90 per kgwas US$ 0.95 |
Epoxide resins, in primary forms — epoxy resins3907 30 10 | US$ 96 mn | ↑+57.2% | 40,121 tonnes | US$ 2.39 per kgwas US$ 2.41 |
Other polyethylene hvng a spfc grvty < 0.943901 10 90 · Ethylene polymers, in primary forms, polyethylene having a specific gravity of less than 0.94 | US$ 91.5 mn | ↑+23.8% | 59,209 tonnes | US$ 1.54 per kgwas US$ 1.59 |
Linear l0w density p0lyethylene (lldpe)3901 10 10 · Ethylene polymers, in primary forms, polyethylene having a specific gravity of less than 0.94 | US$ 67.8 mn | ↑+3.6% | 62,819 tonnes | US$ 1.08 per kgwas US$ 1.08 |
Others-of-others-of-polyacetals, other polyethers and epoxide resins,3907 29 90 · Polyethers other than polyacetals, and bis methylphosphonate, in primary forms | US$ 66.5 mn | ↓-29% | 6,429 tonnes | US$ 10.34 per kgwas US$ 13.56 |
Poly, in primary forms, having a viscosity of less than 78ml/g — pet flake (chip)3907 69 30 | US$ 60.6 mn | ↓-15.3% | 57,033 tonnes | US$ 1.06 per kgwas US$ 1.03 |
Others-of-other polyesters (saturated)3907 99 00 · Polyesters in heading no. 3907, saturated, in primary forms | US$ 55.5 mn | ↑+7.6% | 26,674 tonnes | US$ 2.08 per kgwas US$ 2.20 |
Others-of-other polymersof ethyline in primary forms3901 90 00 · Ethylene polymers, in primary forms in heading no. 3901 | US$ 54 mn | ↓-4.1% | 28,052 tonnes | US$ 1.92 per kgwas US$ 1.97 |
The world market
Each country’s own recorded exports and imports in UN Comtrade, 2023 (the latest year nearly every country has reported).
- World imports
- US$ 232.5 bn 2023
- India among exporters
- #21 of 150 countries
- India’s share of world exports
- 0.9% US$ 1.93 bn
- Left for others to win
- US$ 221.9 bn exported by other countries
Top exporters — your competitors
- 1USAUS$ 31.1 bn 13.9%
- 2ChinaUS$ 19.5 bn 8.7%
- 3Rep. of KoreaUS$ 19.1 bn 8.6%
- 4Saudi ArabiaUS$ 15.3 bn 6.8%
- 5GermanyUS$ 14.1 bn 6.3%
- 6NetherlandsUS$ 11.1 bn 5%
- 7Other Asia, nesUS$ 8.93 bn 4%
- 8SingaporeUS$ 8.44 bn 3.8%
- 9ThailandUS$ 7.77 bn 3.5%
- 10BelgiumUS$ 7.56 bn 3.4%
Biggest buyers in the world
- 1ChinaUS$ 36.5 bn 15.7%
- 2GermanyUS$ 13.4 bn 5.8%
- 3IndiaUS$ 13.3 bn 5.7%
- 4USAUS$ 12.4 bn 5.3%
- 5ItalyUS$ 9.82 bn 4.2%
- 6TürkiyeUS$ 9.28 bn 4%
- 7MexicoUS$ 8.82 bn 3.8%
- 8Viet NamUS$ 7.67 bn 3.3%
- 9PolandUS$ 6.48 bn 2.8%
- 10FranceUS$ 6.47 bn 2.8%
Opportunity: what these countries buy from the world, and from India
Each country’s own recorded imports in UN Comtrade, latest year it has reported. The long light part of each bar is demand other countries are filling today.
TradeStat’s 2023-24 quantities are double-counted, so that year is left out of the price. Sources: TradeStat — Export Import Data Bank, Department of Commerce · UN Comtrade database (United Nations Statistics Division) · Figures taken 29 October 2026.
Step by step
How to export plastic raw materials (polymers)
India has large, modern refinery-petrochemical complexes and exports polyethylene, polypropylene, PVC and PET when domestic supply allows, mainly to neighbouring and African markets. The Middle East, the USA, South Korea and Singapore are the big polymer exporters, and China is both the biggest buyer and a fast-growing producer. Demand comes from packaging, pipes, consumer goods, vehicles and textiles. Openings for smaller exporters are as distributors to processors in Nepal, Bangladesh, Sri Lanka and East Africa, and in specialty resins and compounds.
- 01Secure supply
Become or buy from an authorised distributor of an Indian producer.
- 02Find processors
Film, pipe and moulding units in nearby markets.
- 03Match grades
Map their current imported grades to Indian equivalents.
- 04Quote
Price on the day, short validity, CIF or FOB.
- 05Load and inspect
Clean, dry containers; check bag condition and lot numbers.
- 06Ship and claim
File the shipping bill; claim RoDTEP and drawback.
- 07Payment
LC at sight or advance; polymer margins are thin, so avoid credit risk.
Meet buyers
Trade fairs
Questions
Questions about exporting plastic raw materials (polymers)
Do polymers need REACH registration?
Which council?
What RoDTEP applies?
Can I export recycled plastic granules?
Why do quotes expire so fast?
Sources (6)
- PLEXCONCIL (Plastics Export Promotion Council) — official site
- ECHA — Understanding REACH
- European Commission — Food contact materials
- CIPET — Central Institute of Petrochemicals Engineering & Technology
- NABL — search for accredited testing laboratories
- DGFT — Appendix 4R, RoDTEP schedule for DTA exports w.e.f. 10.10.2024 (Notification 32/2024-25); rates continued to 31.12.2026 by Notification 41/2026-27
Who buys Indian plastic raw materials (polymers)
All countries →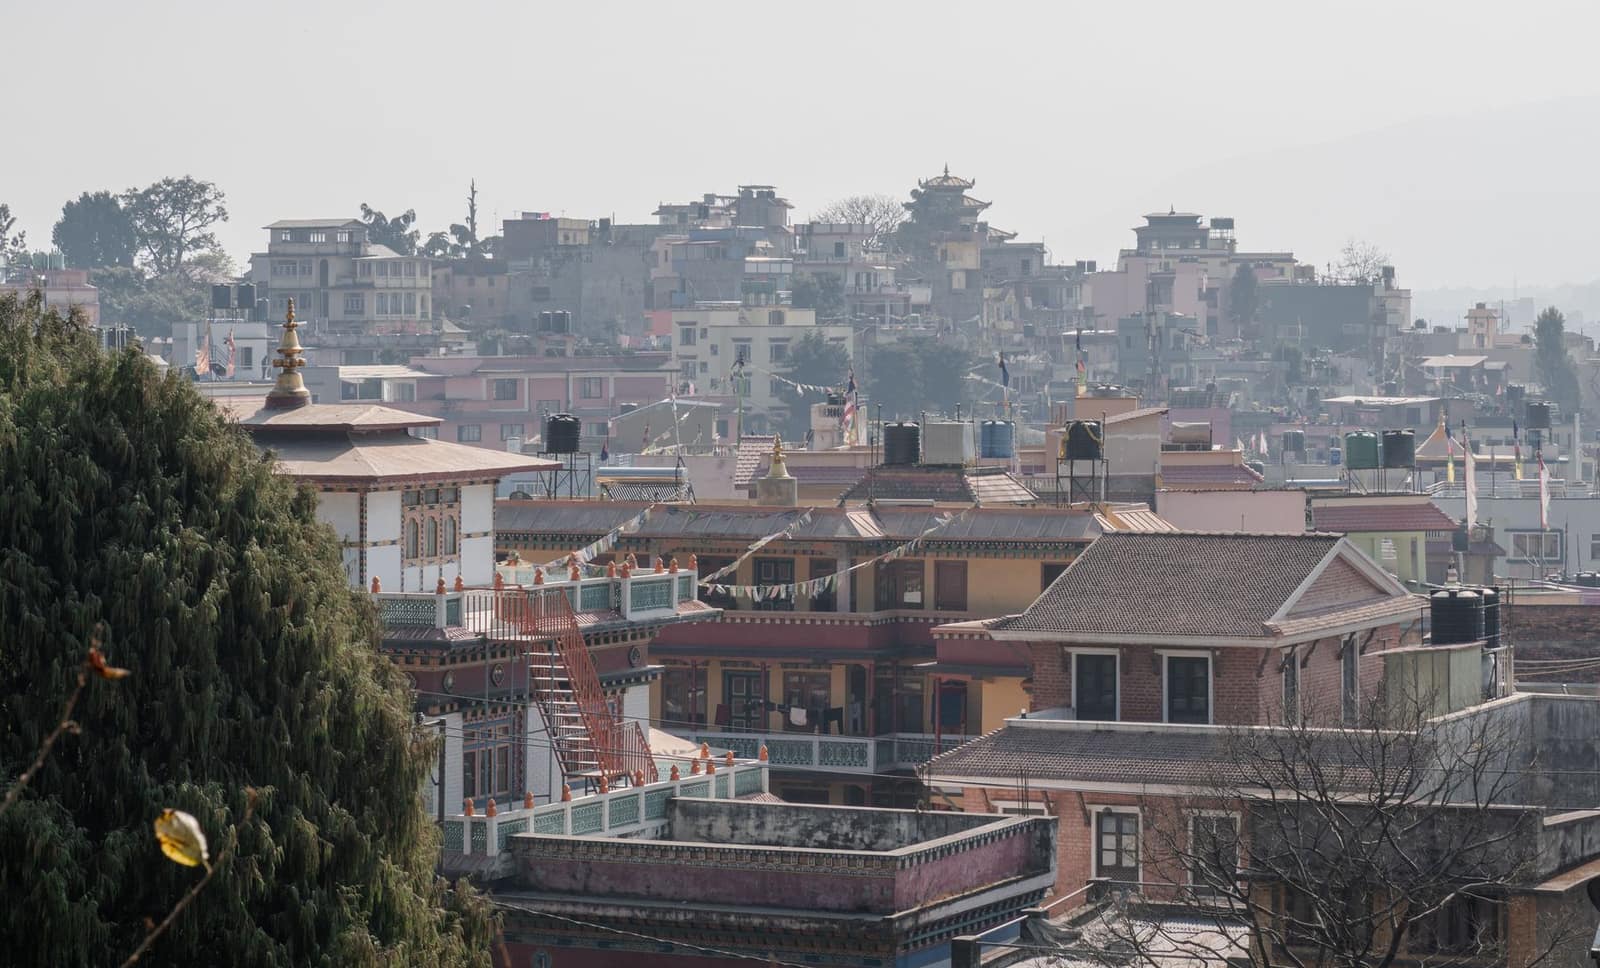 SAFTANPRKathmanduNepalOpen land border, rupee payments and a market that relies on Indian goods — an easy first market by road.From India 2025-26US$ 7.45 bn
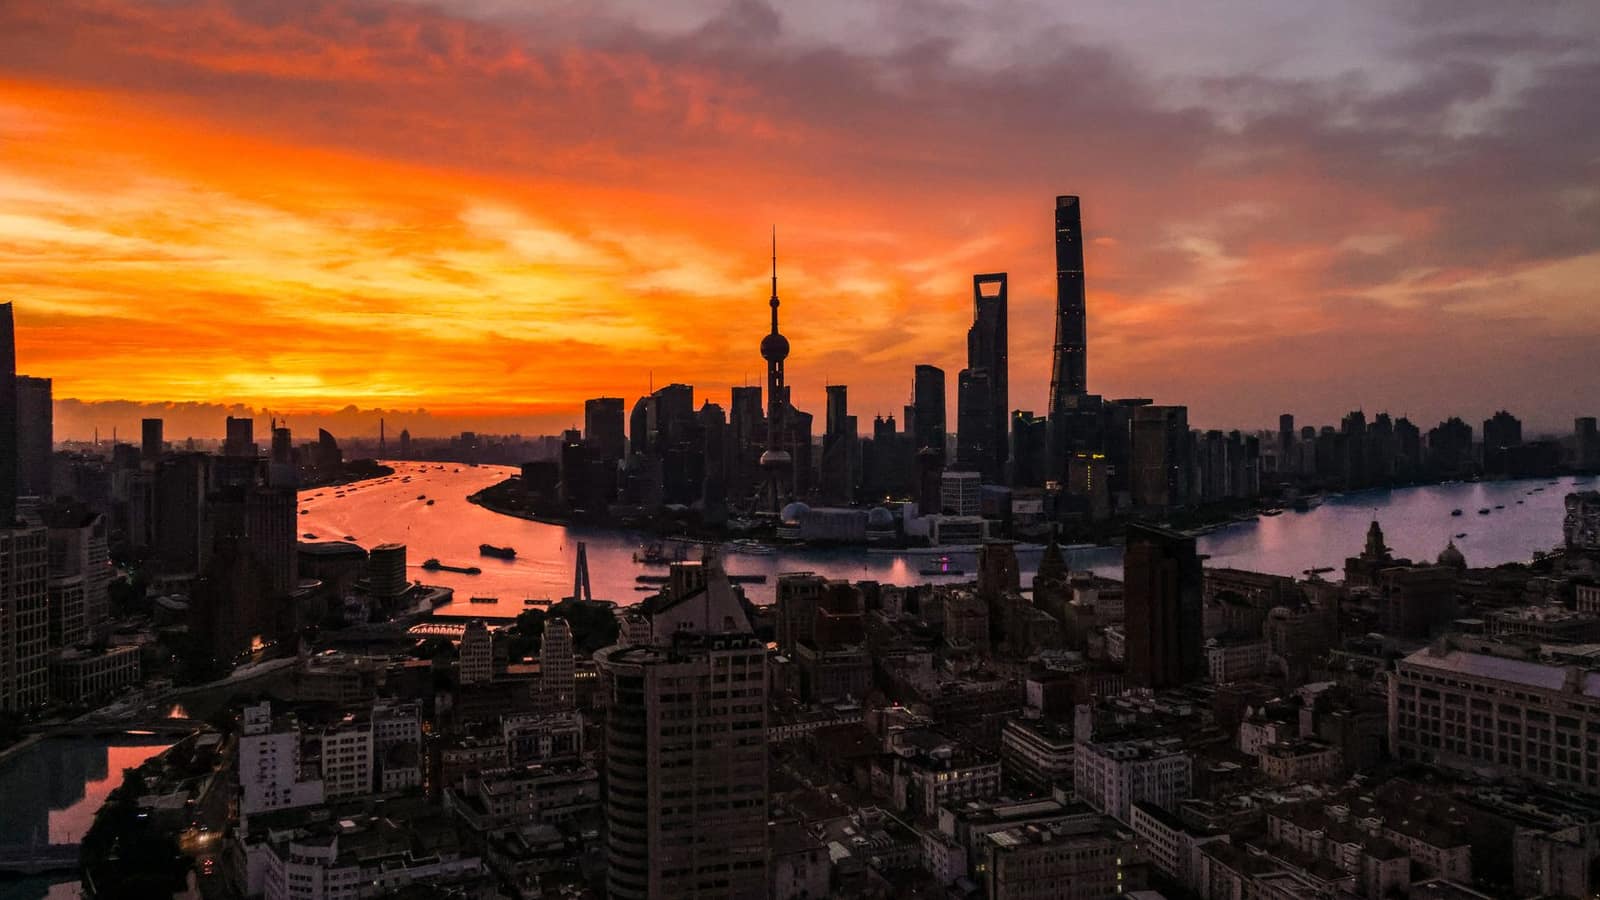 APTACNYBeijingChinaHuge market, but mostly for raw materials. Food plants must be registered with GACC; fresh produce needs a protocol.From India 2025-26US$ 19.5 bn
 KESNairobiKenyaEast Africa's trade gateway via Mombasa. Buys medicines, vehicles, steel and rice; KEBS pre-shipment checks apply.From India 2025-26US$ 4.02 bn
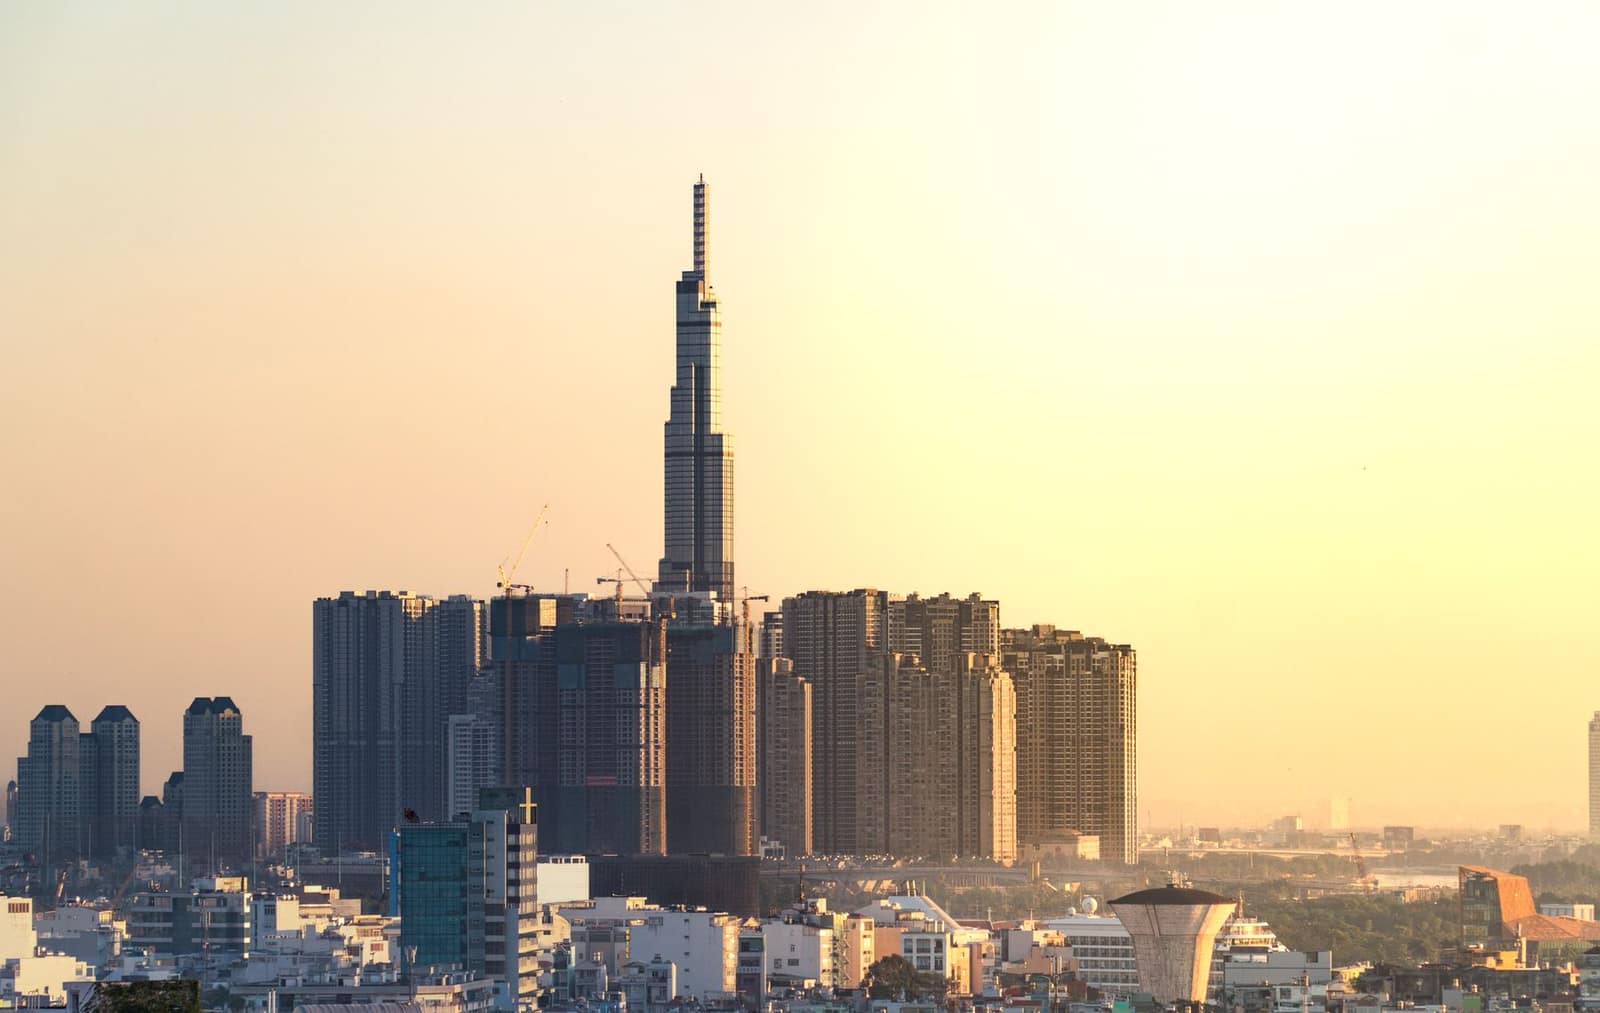 AITIGAVNDHanoiVietnamFast-growing manufacturing economy buying raw materials, yarn, steel, chemicals and feed ingredients from India.From India 2025-26US$ 6.67 bn
 CEPAAEDAbu DhabiUnited Arab EmiratesIndia's biggest Gulf buyer and a re-export hub for the Middle East and Africa. CEPA in force since 2022.From India 2025-26US$ 37.4 bn
 EGPCairoEgyptLarge North African market. Every shipment must be pre-registered on Egypt's ACI system before loading.From India 2025-26US$ 3.87 bn
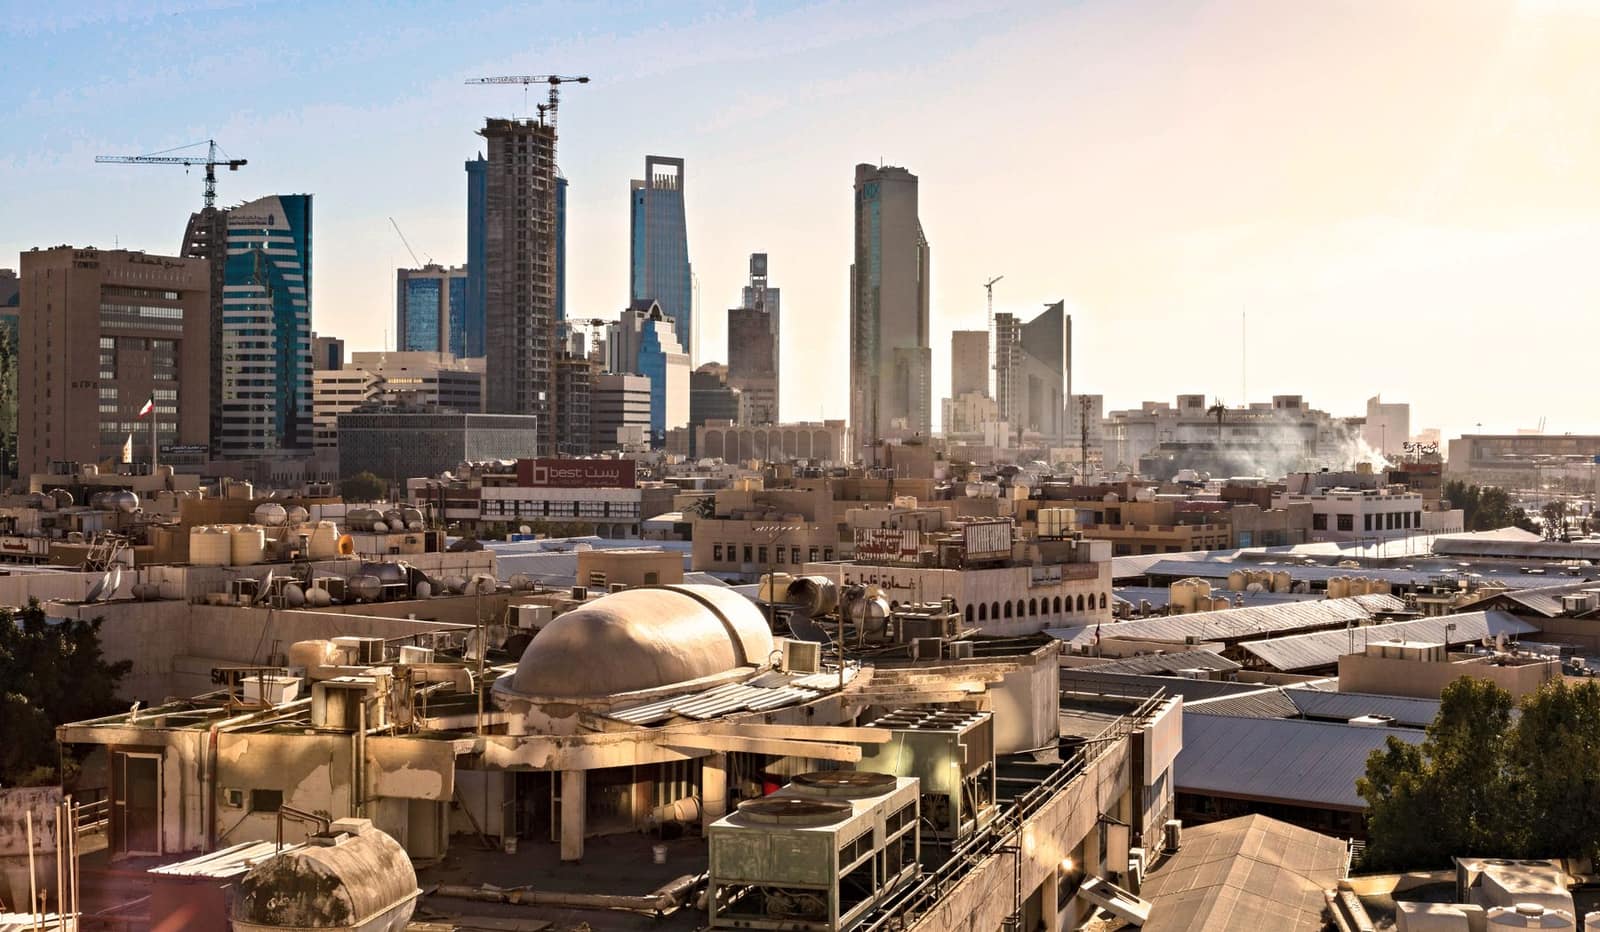 SARRiyadhSaudi ArabiaLarge Gulf market for rice, food and engineering goods. Strict SFDA food rules and SABER certification for regulated goods.From India 2025-26US$ 10.3 bn
 SAFTABDTDhakaBangladeshBig neighbour market for cotton, yarn, food and machinery. Mostly LC-based; land and sea routes.From India 2025-26US$ 10.6 bn
More in pharma & chemicals
All products → Free to exportPharma & chemicalsGeneric medicines (formulations)Tablets, capsules and injectables; every market needs product registration. The USA buys the most.HS3004Exports 2025-26US$ 21.9 bn ↓0.7%
 Free, with conditionsPharma & chemicalsAyurvedic and herbal productsAyurvedic medicines, supplements and herbal cosmetics; register with AYUSHEXCIL and the buyer's regulator.HS3004.90Exports 2025-26US$ 176 mn ↑7.1%
 Free, with conditionsPharma & chemicalsEssential oilsMint, lemongrass, vetiver and other oils for flavour, fragrance and aromatherapy buyers; the USA leads.HS3301Exports 2025-26US$ 899 mn ↓3.3%
 Free to exportPharma & chemicalsSpice oils and oleoresinsConcentrated flavour and colour extracts for food, nutraceutical and pharma makers. India is the world leader; the USA is the biggest buyer.HS3301.90Exports 2025-26US$ 543 mn ↓1.4%