

Africa
Export to Tanzania
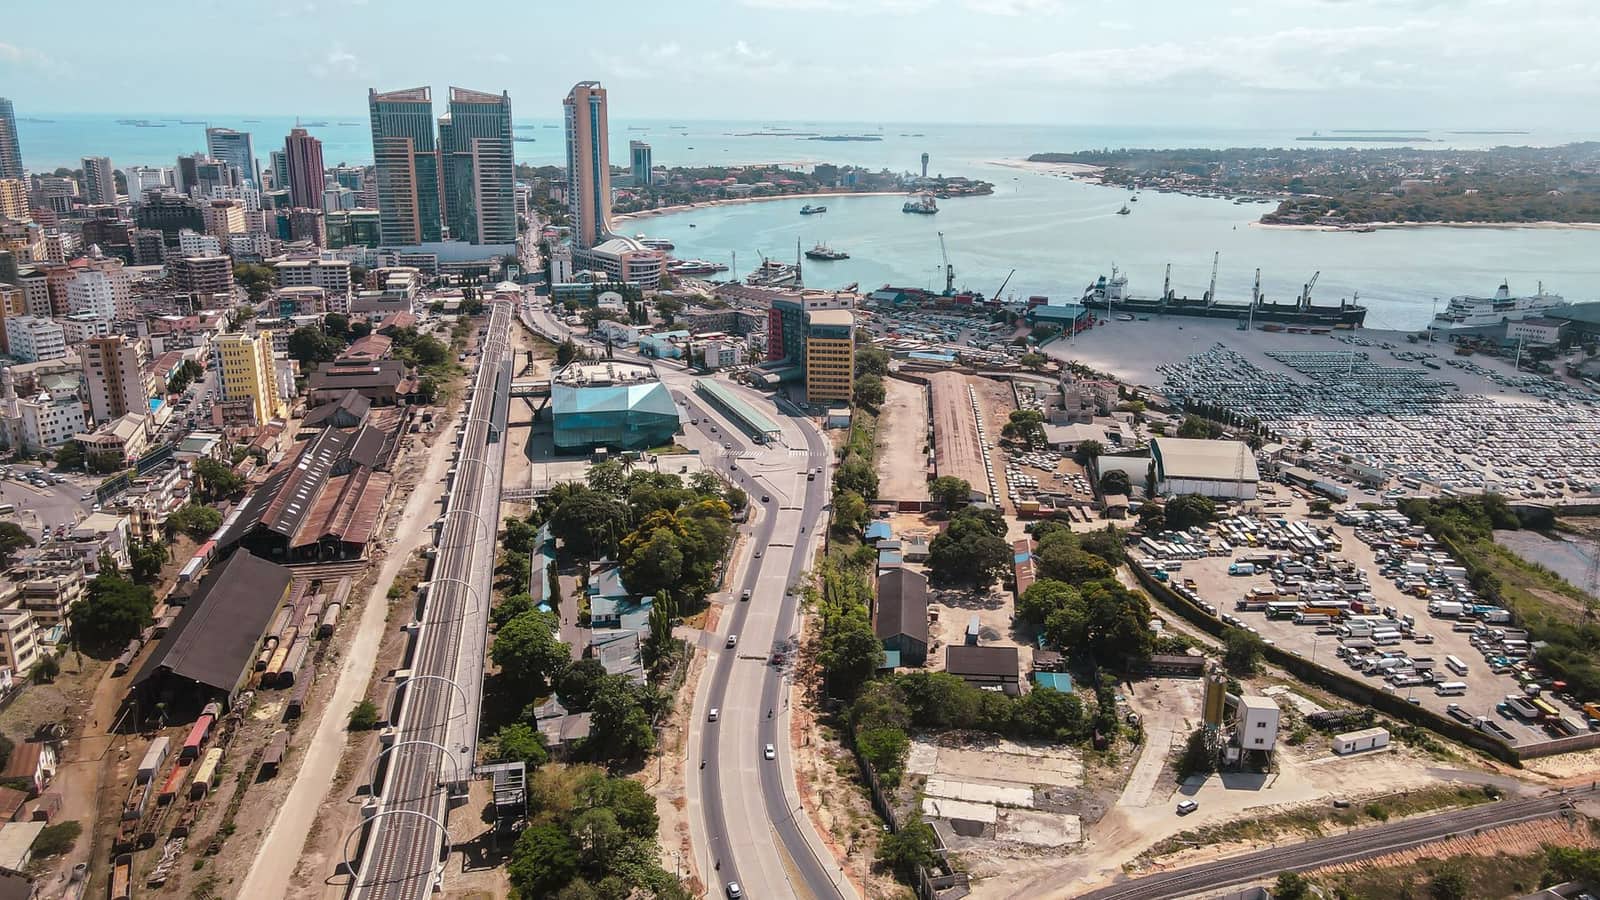
East African market and corridor to six landlocked neighbours. Buys Indian fuels, medicines, vehicles and machinery; TBS pre-shipment checks.
- Capital
- Dodoma (Dar es Salaam is the main commercial city)
- Currency
- TZS
- Trade agreement with India
- None
- Main ports
- Dar es Salaam, Tanga, Mtwara
Tanzania has no trade agreement with India, but it is a long-standing partner with a large Indian-origin business community. Dar es Salaam port serves Tanzania and landlocked Zambia, Malawi, Rwanda, Burundi, Uganda and eastern DR Congo. Regulated goods must pass the Tanzania Bureau of Standards (TBS) pre-shipment verification.
What it buys from India
- Petroleum products
- Medicines and pharmaceutical products
- Vehicles, motorcycles, machinery and steel products
- Plastics, textiles and food products
Import rules on their side
- Regulated goods need a Certificate of Conformity under TBS's Pre-shipment Verification of Conformity (PVoC) programme, issued by an appointed agent before loading in India.
- Medicines and medical devices need registration with the Tanzania Medicines and Medical Devices Authority (TMDA); food products fall under TBS.
- Tanzania applies the East African Community common external tariff; customs is run by the Tanzania Revenue Authority (TRA).
Practical tips
- Book the PVoC inspection early in production; it is done in India before the container is sealed.
- Ask for an advance or a confirmed LC; check ECGC cover before giving credit.
- For transit cargo to Zambia or Malawi, agree who handles the transit bond and road transport from Dar es Salaam.
Trade data
India’s exports to Tanzania in numbers
From the Department of Commerce’s TradeStat (Indian financial years, April–March), the country’s imports from the world from UN Comtrade, and its basics from the World Bank.
- India’s exports here, 2025-26
- US$ 5.42 bn No. 25 of our 80 countries
- Change from 2024-25
- ↑ +13.2% US$ 4.79 bn → US$ 5.42 bn
- Share of all Indian exports
- 1.23%
- Its imports from the world
- —
What India sells here most
By HS chapter, 2025-26. Change is against 2024-25.
What is rising and what is falling
Chapters where India sells at least US$ 5 million. Change from 2024-25 to 2025-26.
↑ High demand
- Cereals (rice, wheat, maize)US$ 21.6 mn → US$ 59.3 mn↑+174.7%
- Home textiles, made-upsUS$ 17.5 mn → US$ 35.2 mn↑+101.8%
- AluminiumUS$ 43.1 mn → US$ 70.6 mn↑+63.7%
- Inorganic chemicalsUS$ 33.5 mn → US$ 52.4 mn↑+56.5%
- Other chemical productsUS$ 58.7 mn → US$ 82.3 mn↑+40.1%
- PlasticsUS$ 88 mn → US$ 123 mn↑+39.8%
- Medicines and pharmaUS$ 210 mn → US$ 292 mn↑+39.3%
- RubberUS$ 29.8 mn → US$ 41.3 mn↑+38.5%
↓ Low demand
- Woven garmentsUS$ 66.6 mn → US$ 48.7 mn↓-26.9%
- Knitted garmentsUS$ 58 mn → US$ 46.7 mn↓-19.5%
Our product guides that sell here
India’s exports of each product to this country, 2025-26.
The 20 biggest export lines
4-digit HS lines, 2025-26, with their Harmonized System descriptions.
What India buys from Tanzania
India’s imports from this country in 2025-26 by HS chapter, from TradeStat — this country can be your supplier too.
- India’s imports, 2025-26
- US$ 3.6 bn US$ 3.85 bn → US$ 3.6 bn
- India’s exports, 2025-26
- US$ 5.42 bn
- Trade balance
- +US$ 1.82 bn exports minus imports
- Change in imports
- -6.4%
The country at a glance
- Population
- 70.5 mn 2025
- GDP
- US$ 90.1 bn 2025
- GDP per person
- US$ 1,319 2025
- Imports (goods and services)
- US$ 18 bn 2025
Sources: TradeStat — Export Import Data Bank, Department of Commerce · World Bank — World Development Indicators · Figures taken 29 October 2026.
What to send to Tanzania
All products →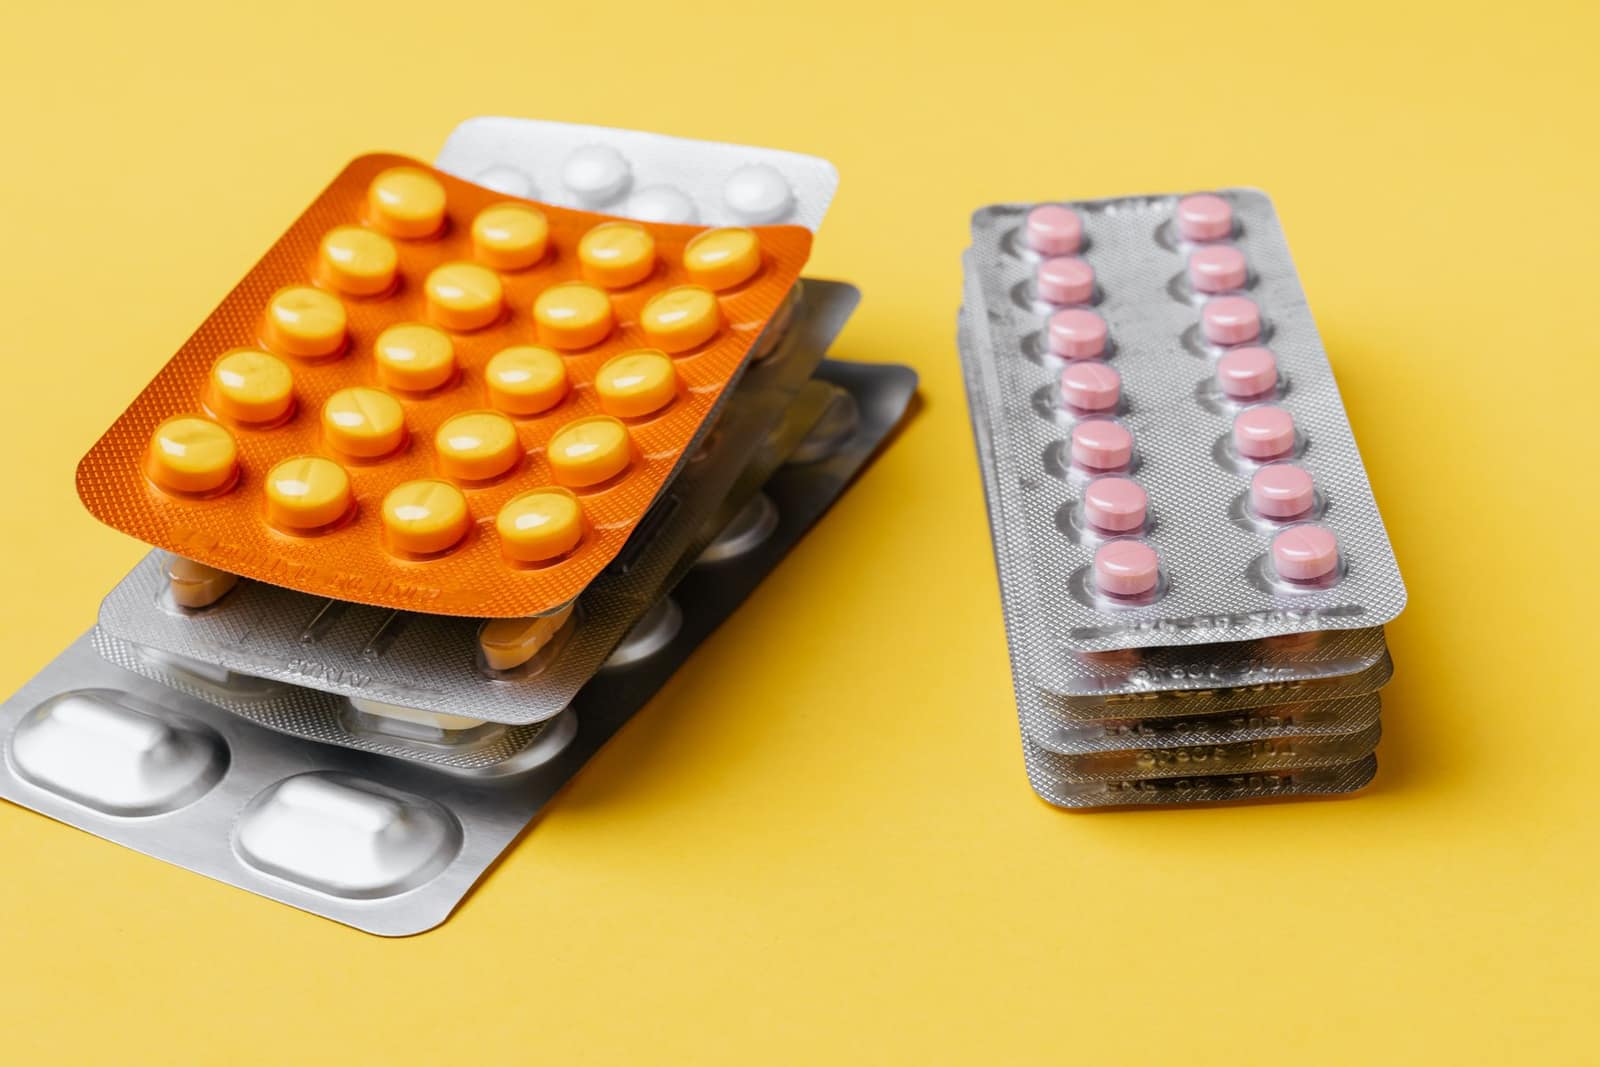 Free to exportPharma & chemicalsGeneric medicines (formulations)Tablets, capsules and injectables; every market needs product registration. The USA buys the most.HS3004Exports 2025-26US$ 21.9 bn ↓0.7%
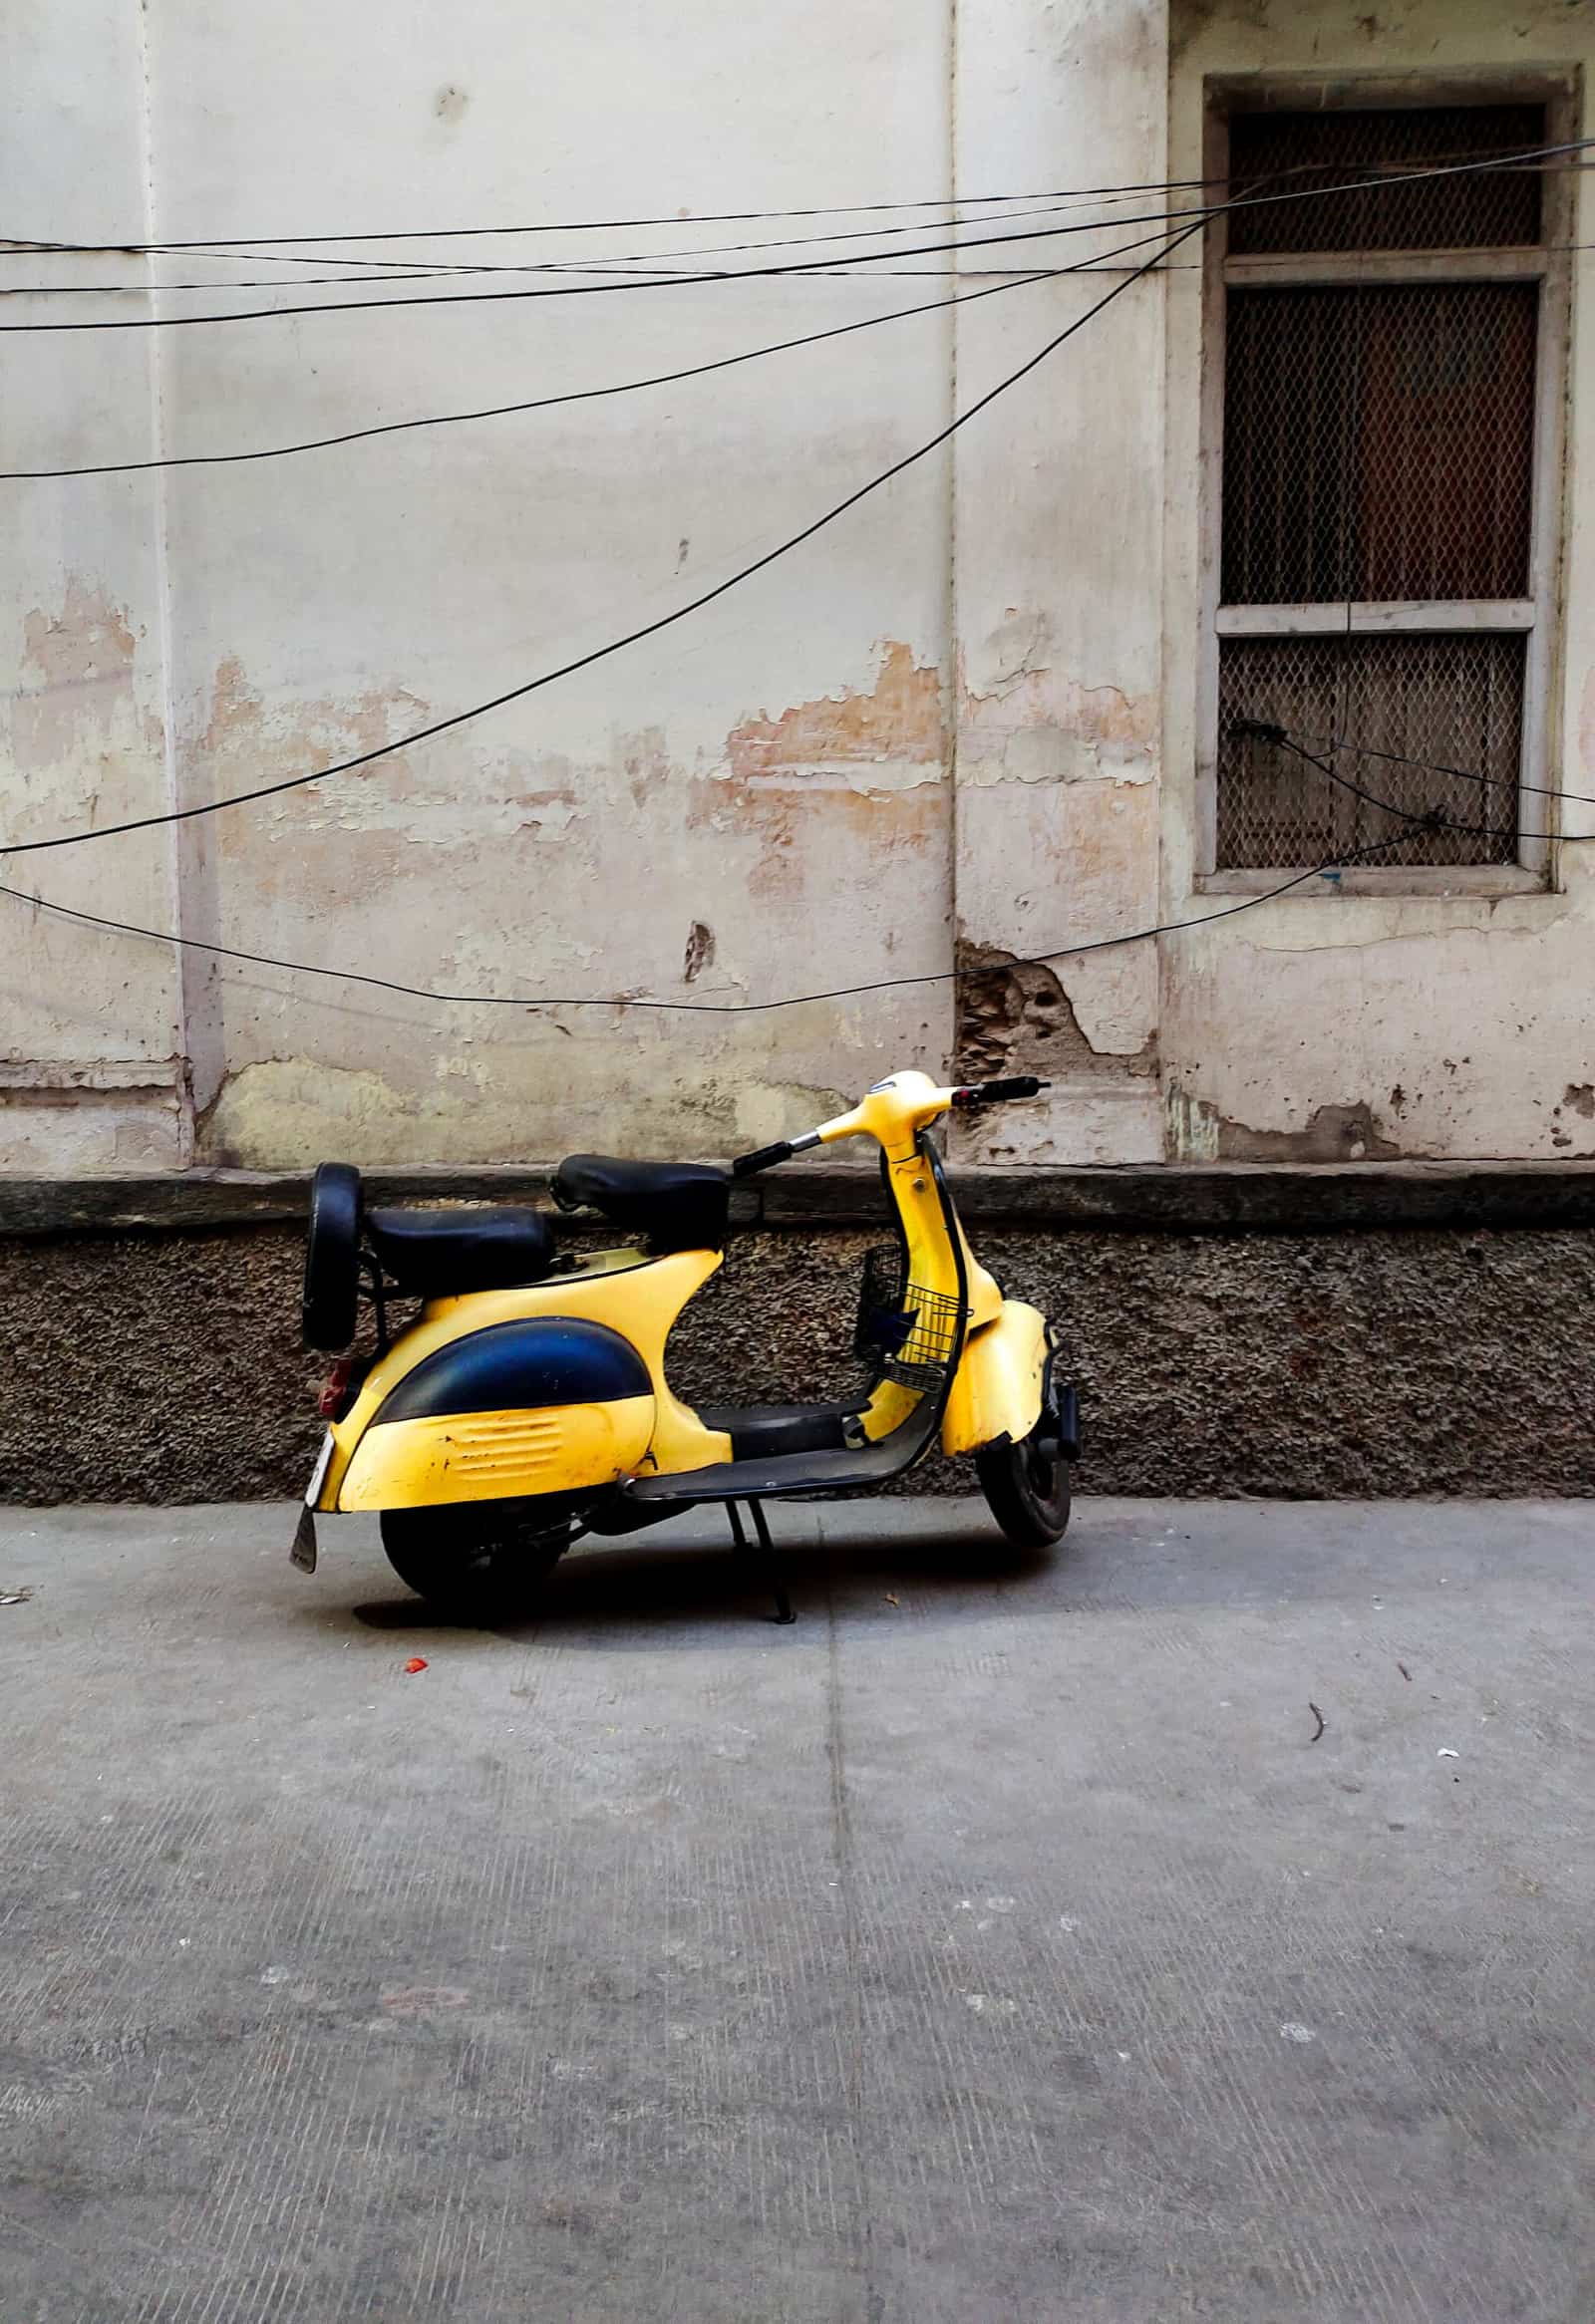 Free to exportEngineering goodsMotorcycles and scootersCommuter motorcycles and scooters for Latin America, Africa and South Asia; India is a top exporter.HS8711Exports 2025-26US$ 3.98 bn ↑24.2%
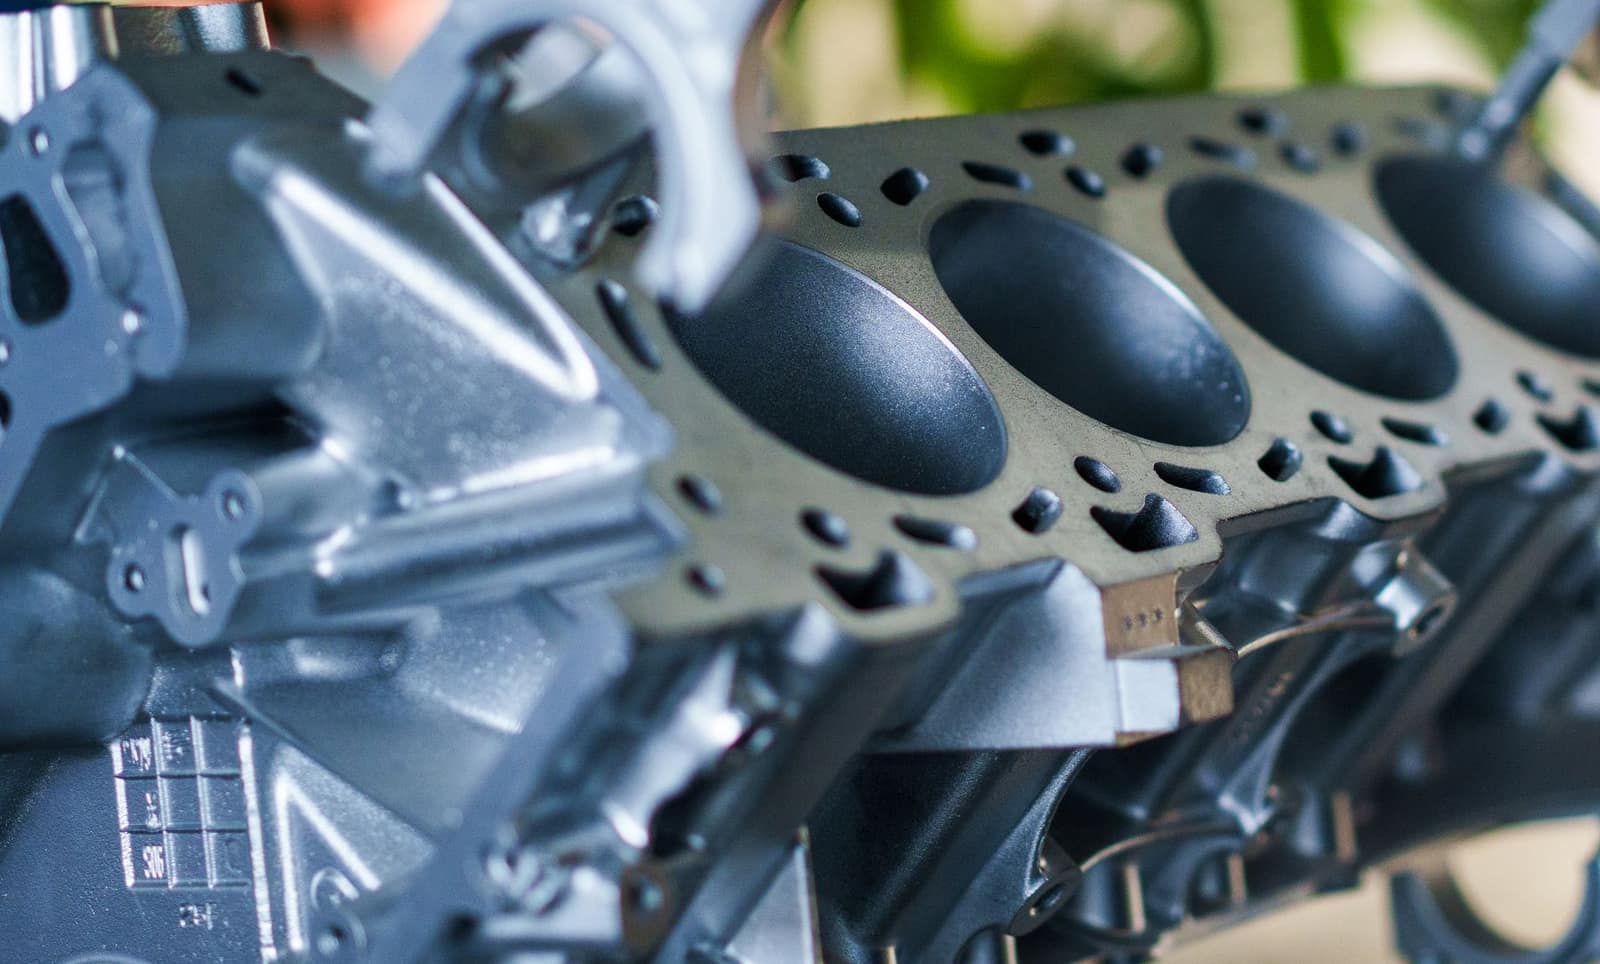 Free to exportEngineering goodsAuto parts and componentsOEM and aftermarket vehicle parts; the USA, Germany and Italy buy most, with strong demand in Latin America.HS8708Exports 2025-26US$ 7.64 bn ↑1.8%
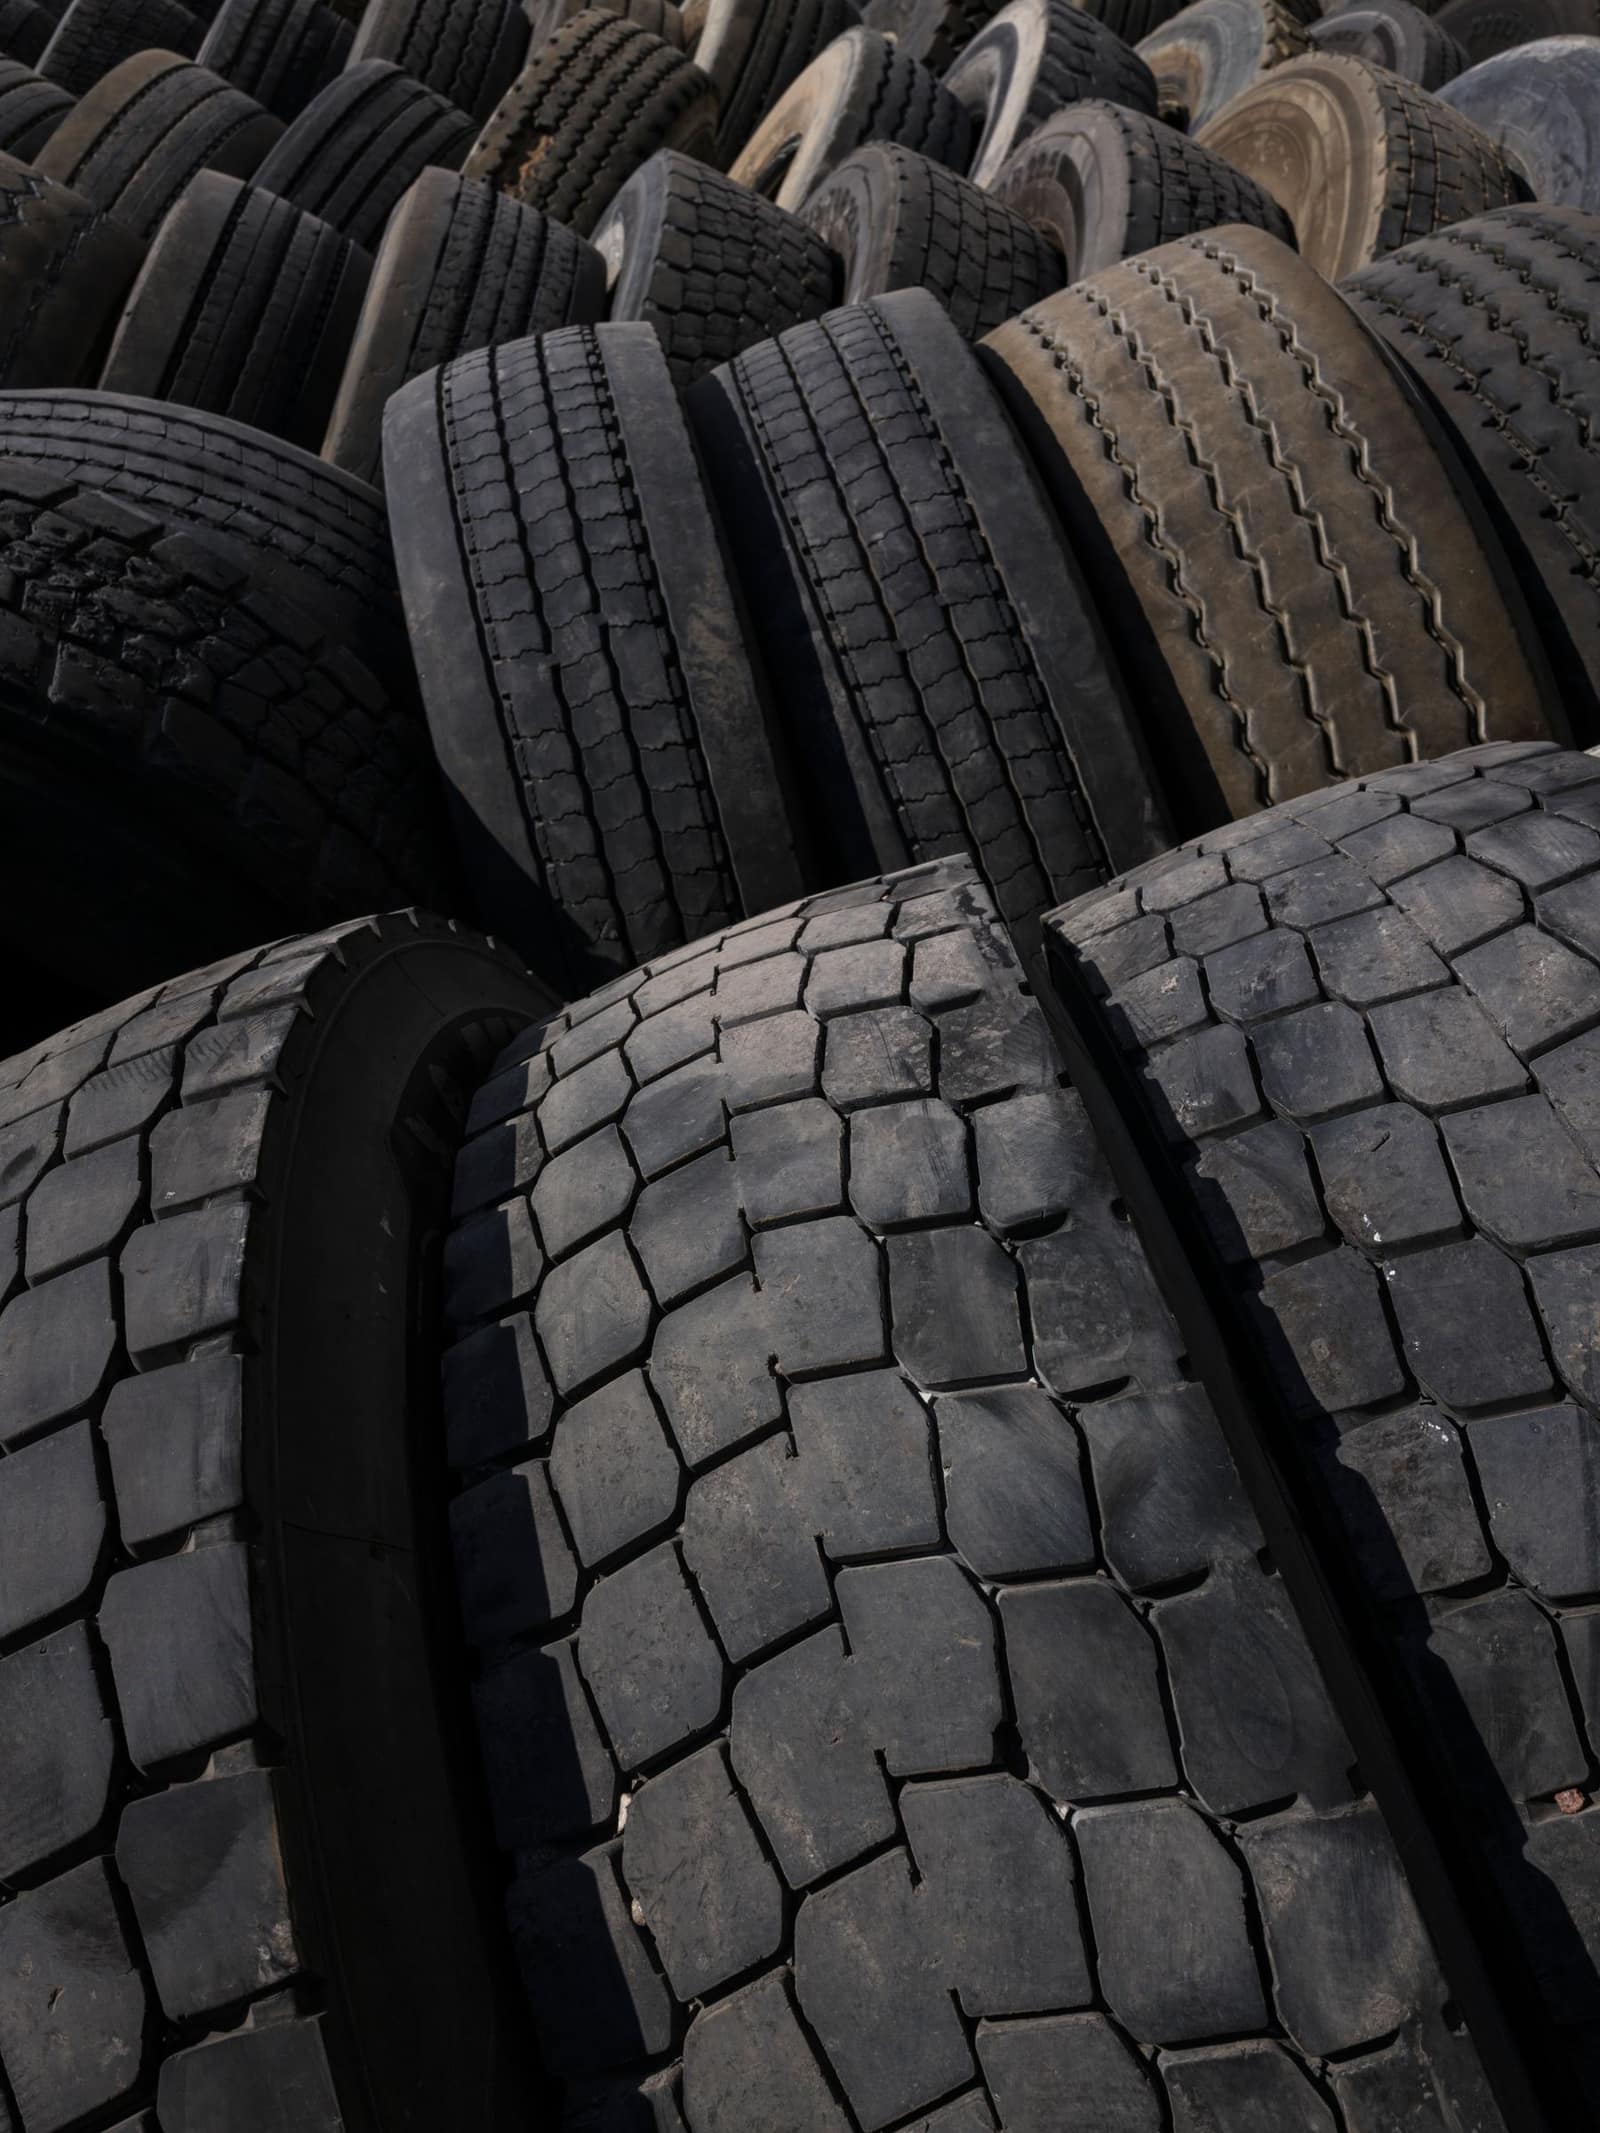 Free to exportEngineering goodsTyresTruck, off-highway, car and two-wheeler tyres; the USA, Germany, Italy and Brazil lead.HS4011Exports 2025-26US$ 3.09 bn ↑4.3%
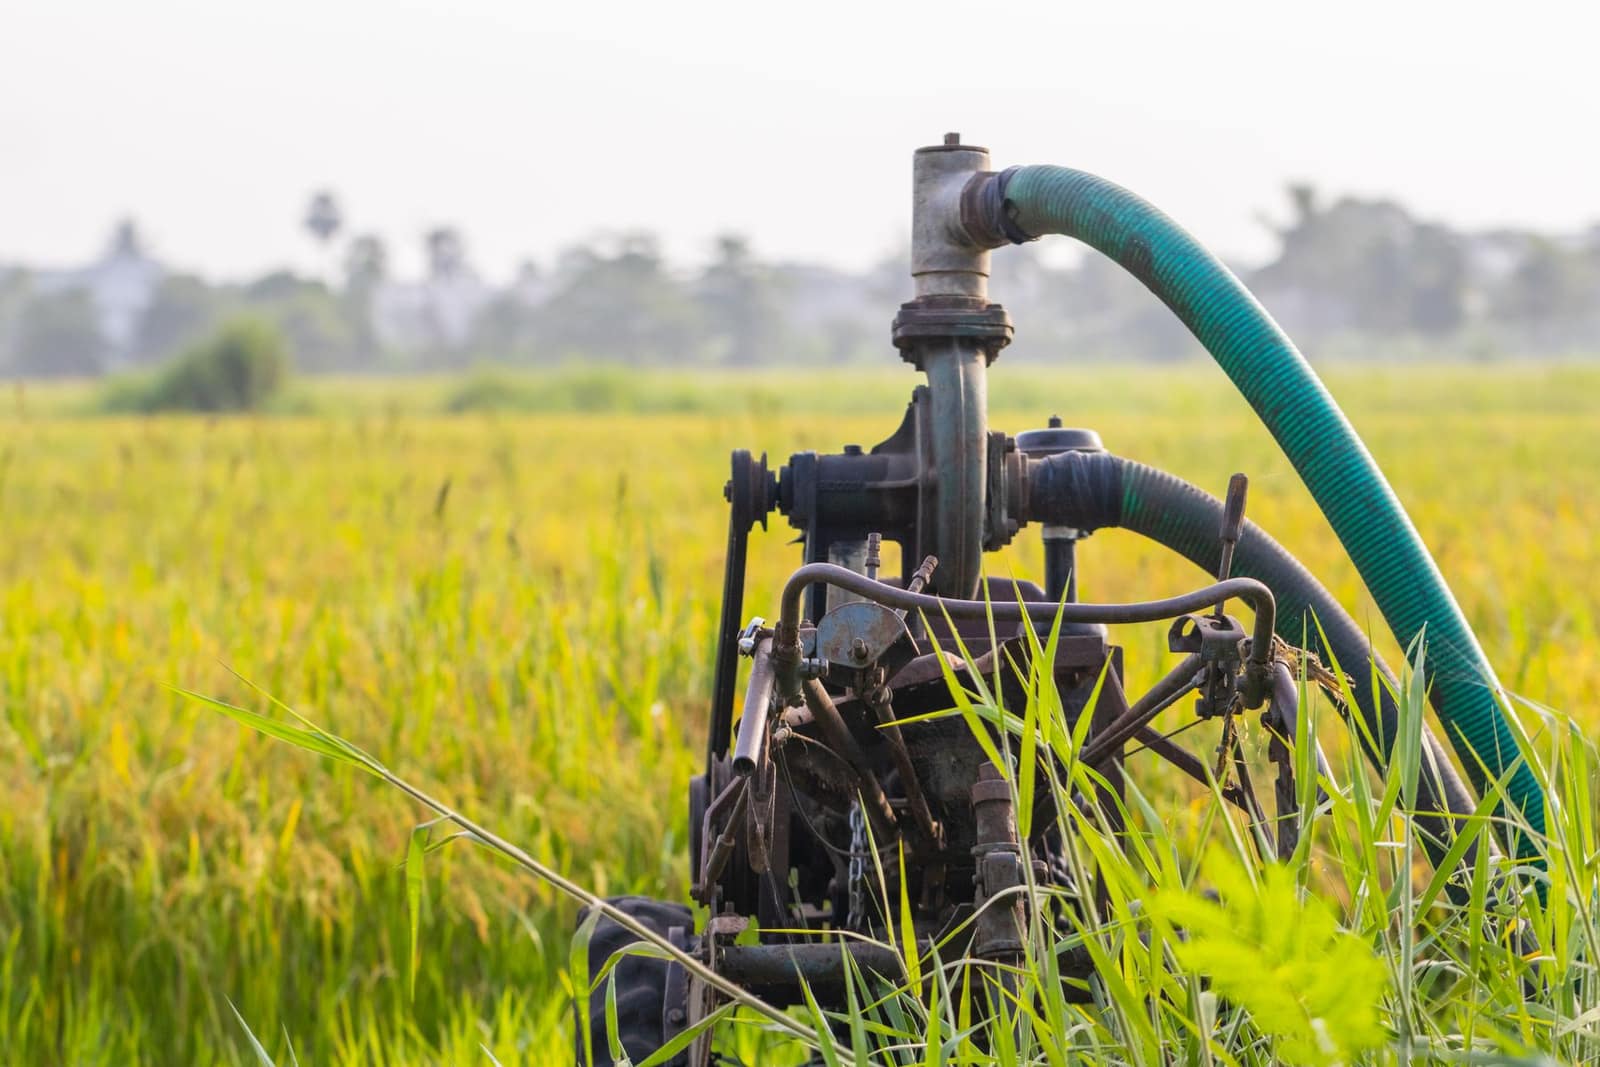 Free to exportEngineering goodsPumpsAgricultural, domestic and industrial pumps from Coimbatore, Rajkot and Ahmedabad; the USA leads.HS8413Exports 2025-26US$ 1.6 bn ↑5.2%
 Free to exportEngineering goodsFarm machineryRotavators, harrows, threshers and implements from Punjab, Gujarat and Maharashtra; the USA, Germany and Sri Lanka lead.HS8432Exports 2025-26US$ 390 mn ↑18.9%
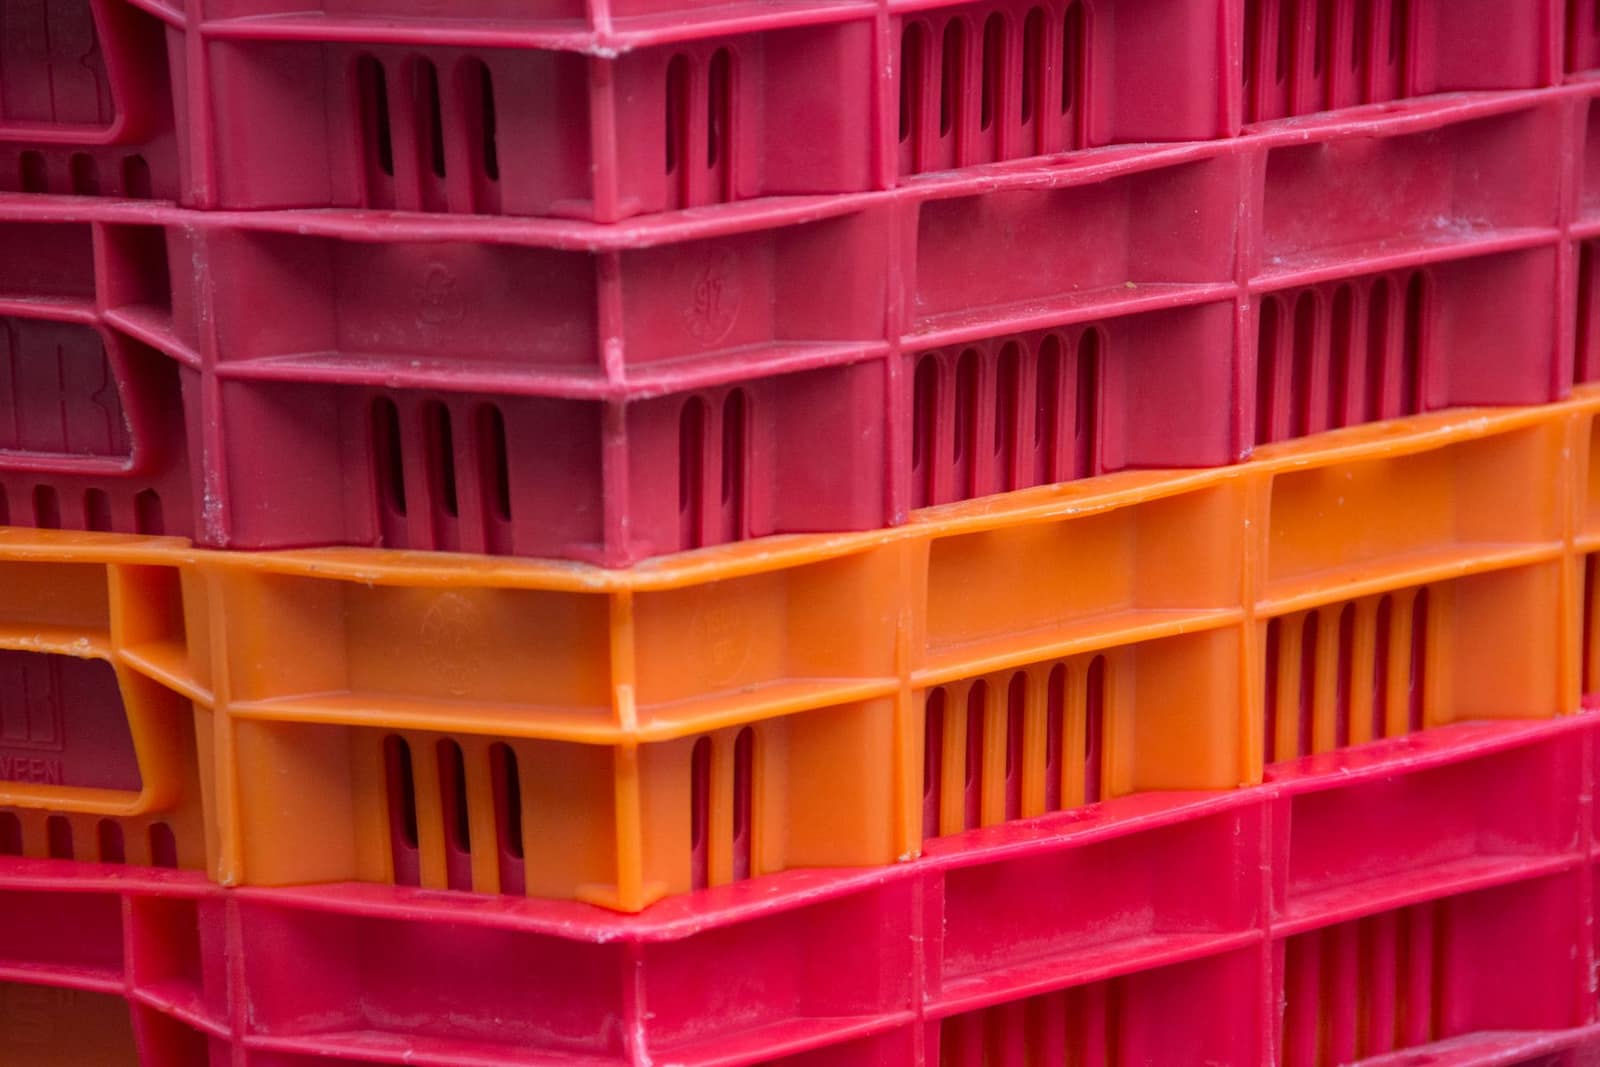 Free to exportOther goodsPlastic goods and packagingWoven sacks, FIBC bags, containers and household plastics; the USA leads, then the UAE and UK.HS3923Exports 2025-26US$ 1.21 bn ↑3.3%
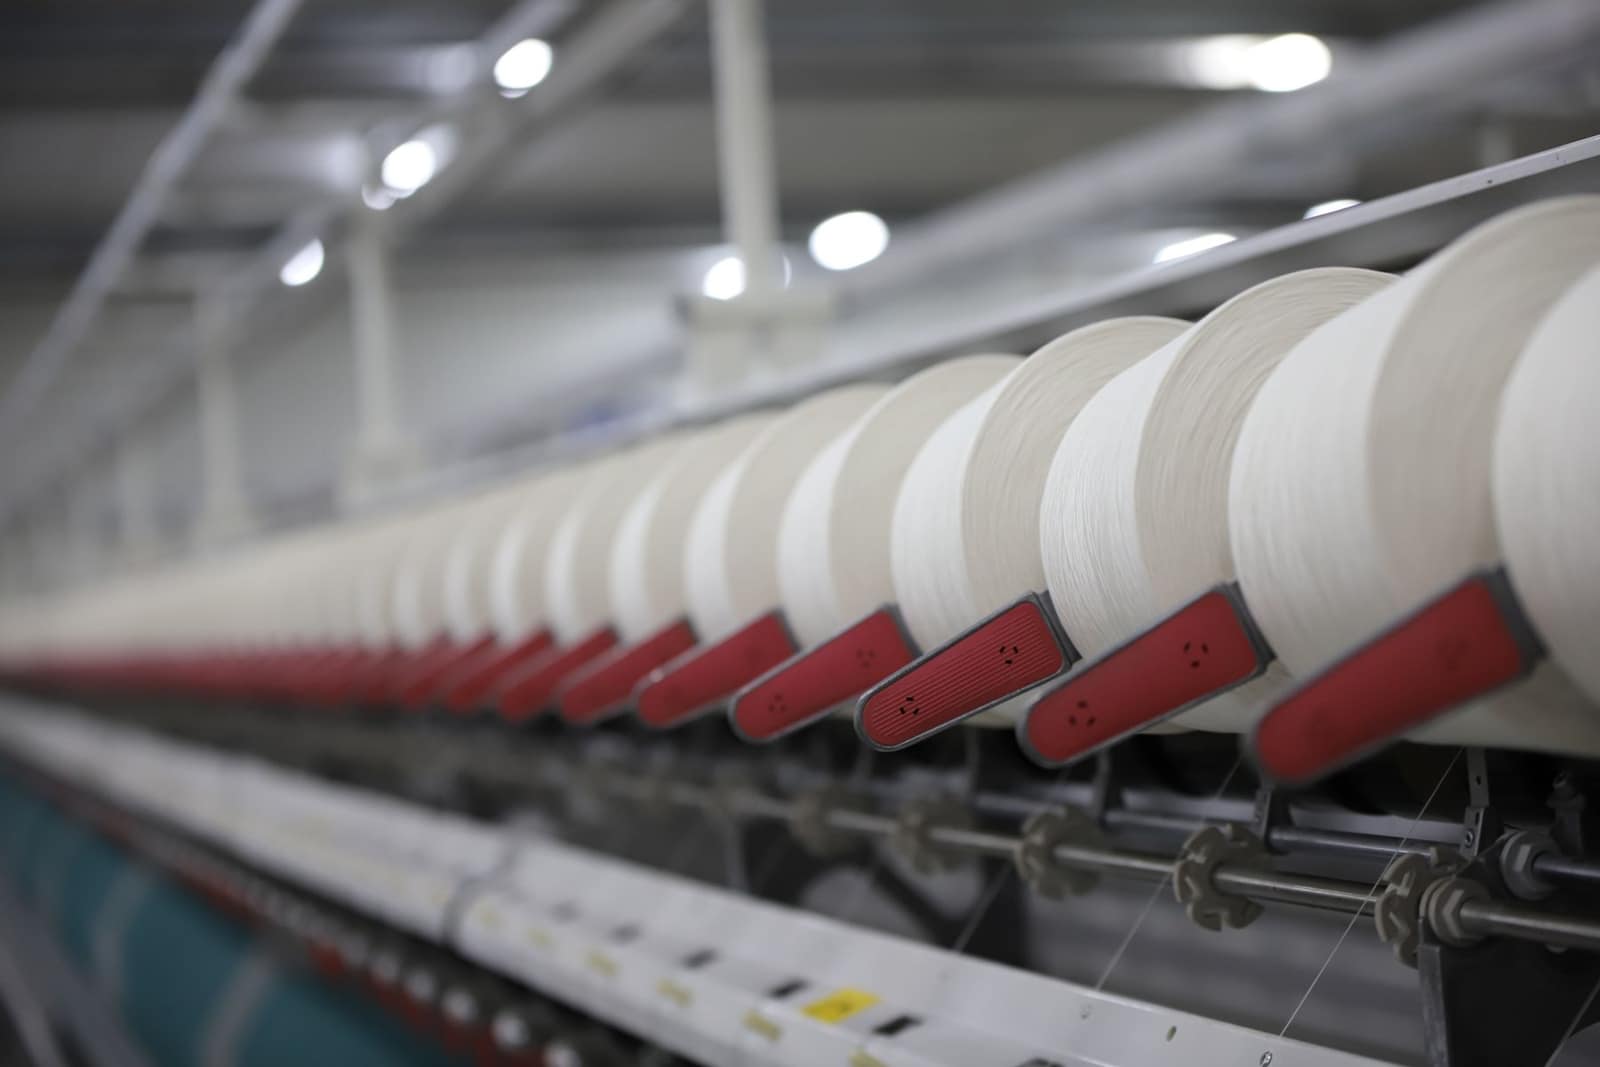 Free to exportTextiles & apparelCotton yarnBulk cotton yarn sold to weaving and knitting mills abroad; Bangladesh is by far the largest buyer.HS5205Exports 2025-26US$ 3.22 bn ↓4.1%
More in Africa
 KESNairobiKenyaEast Africa's trade gateway via Mombasa. Buys medicines, vehicles, steel and rice; KEBS pre-shipment checks apply.From India 2025-26US$ 4.02 bn
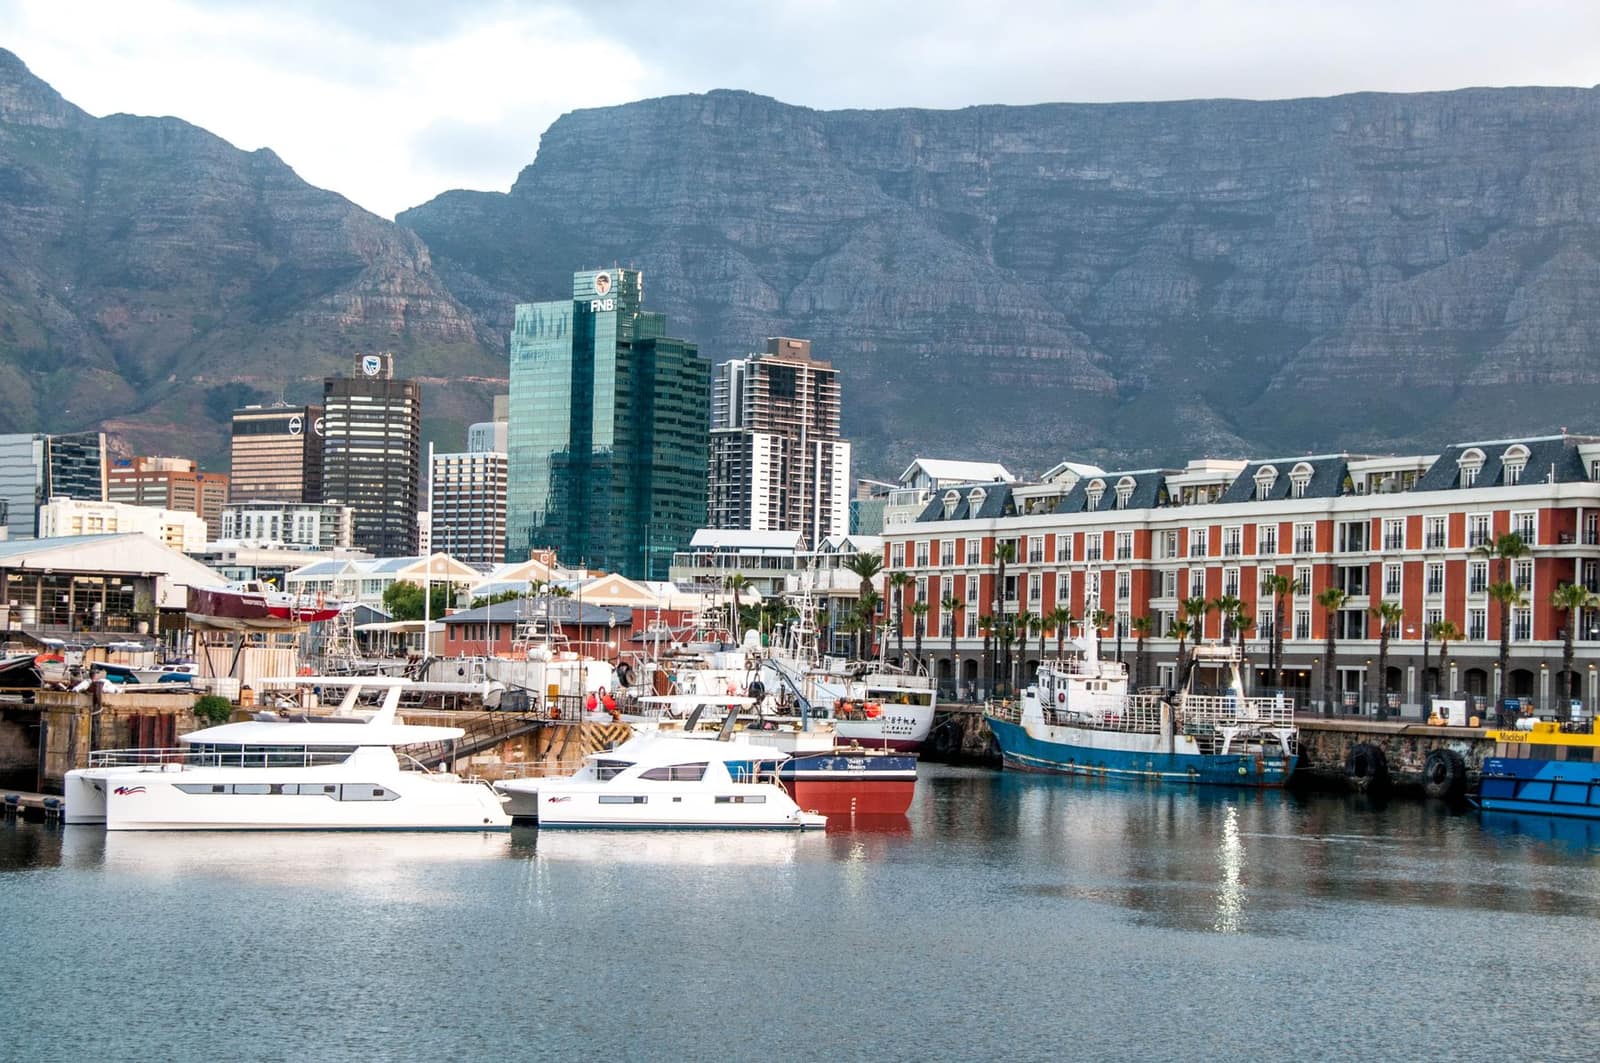 ZARPretoria (executive capital)South AfricaAfrica's most industrial economy. Buys vehicles, medicines, rice and chemicals; NRCS approval for regulated goods.From India 2025-26US$ 7.01 bn
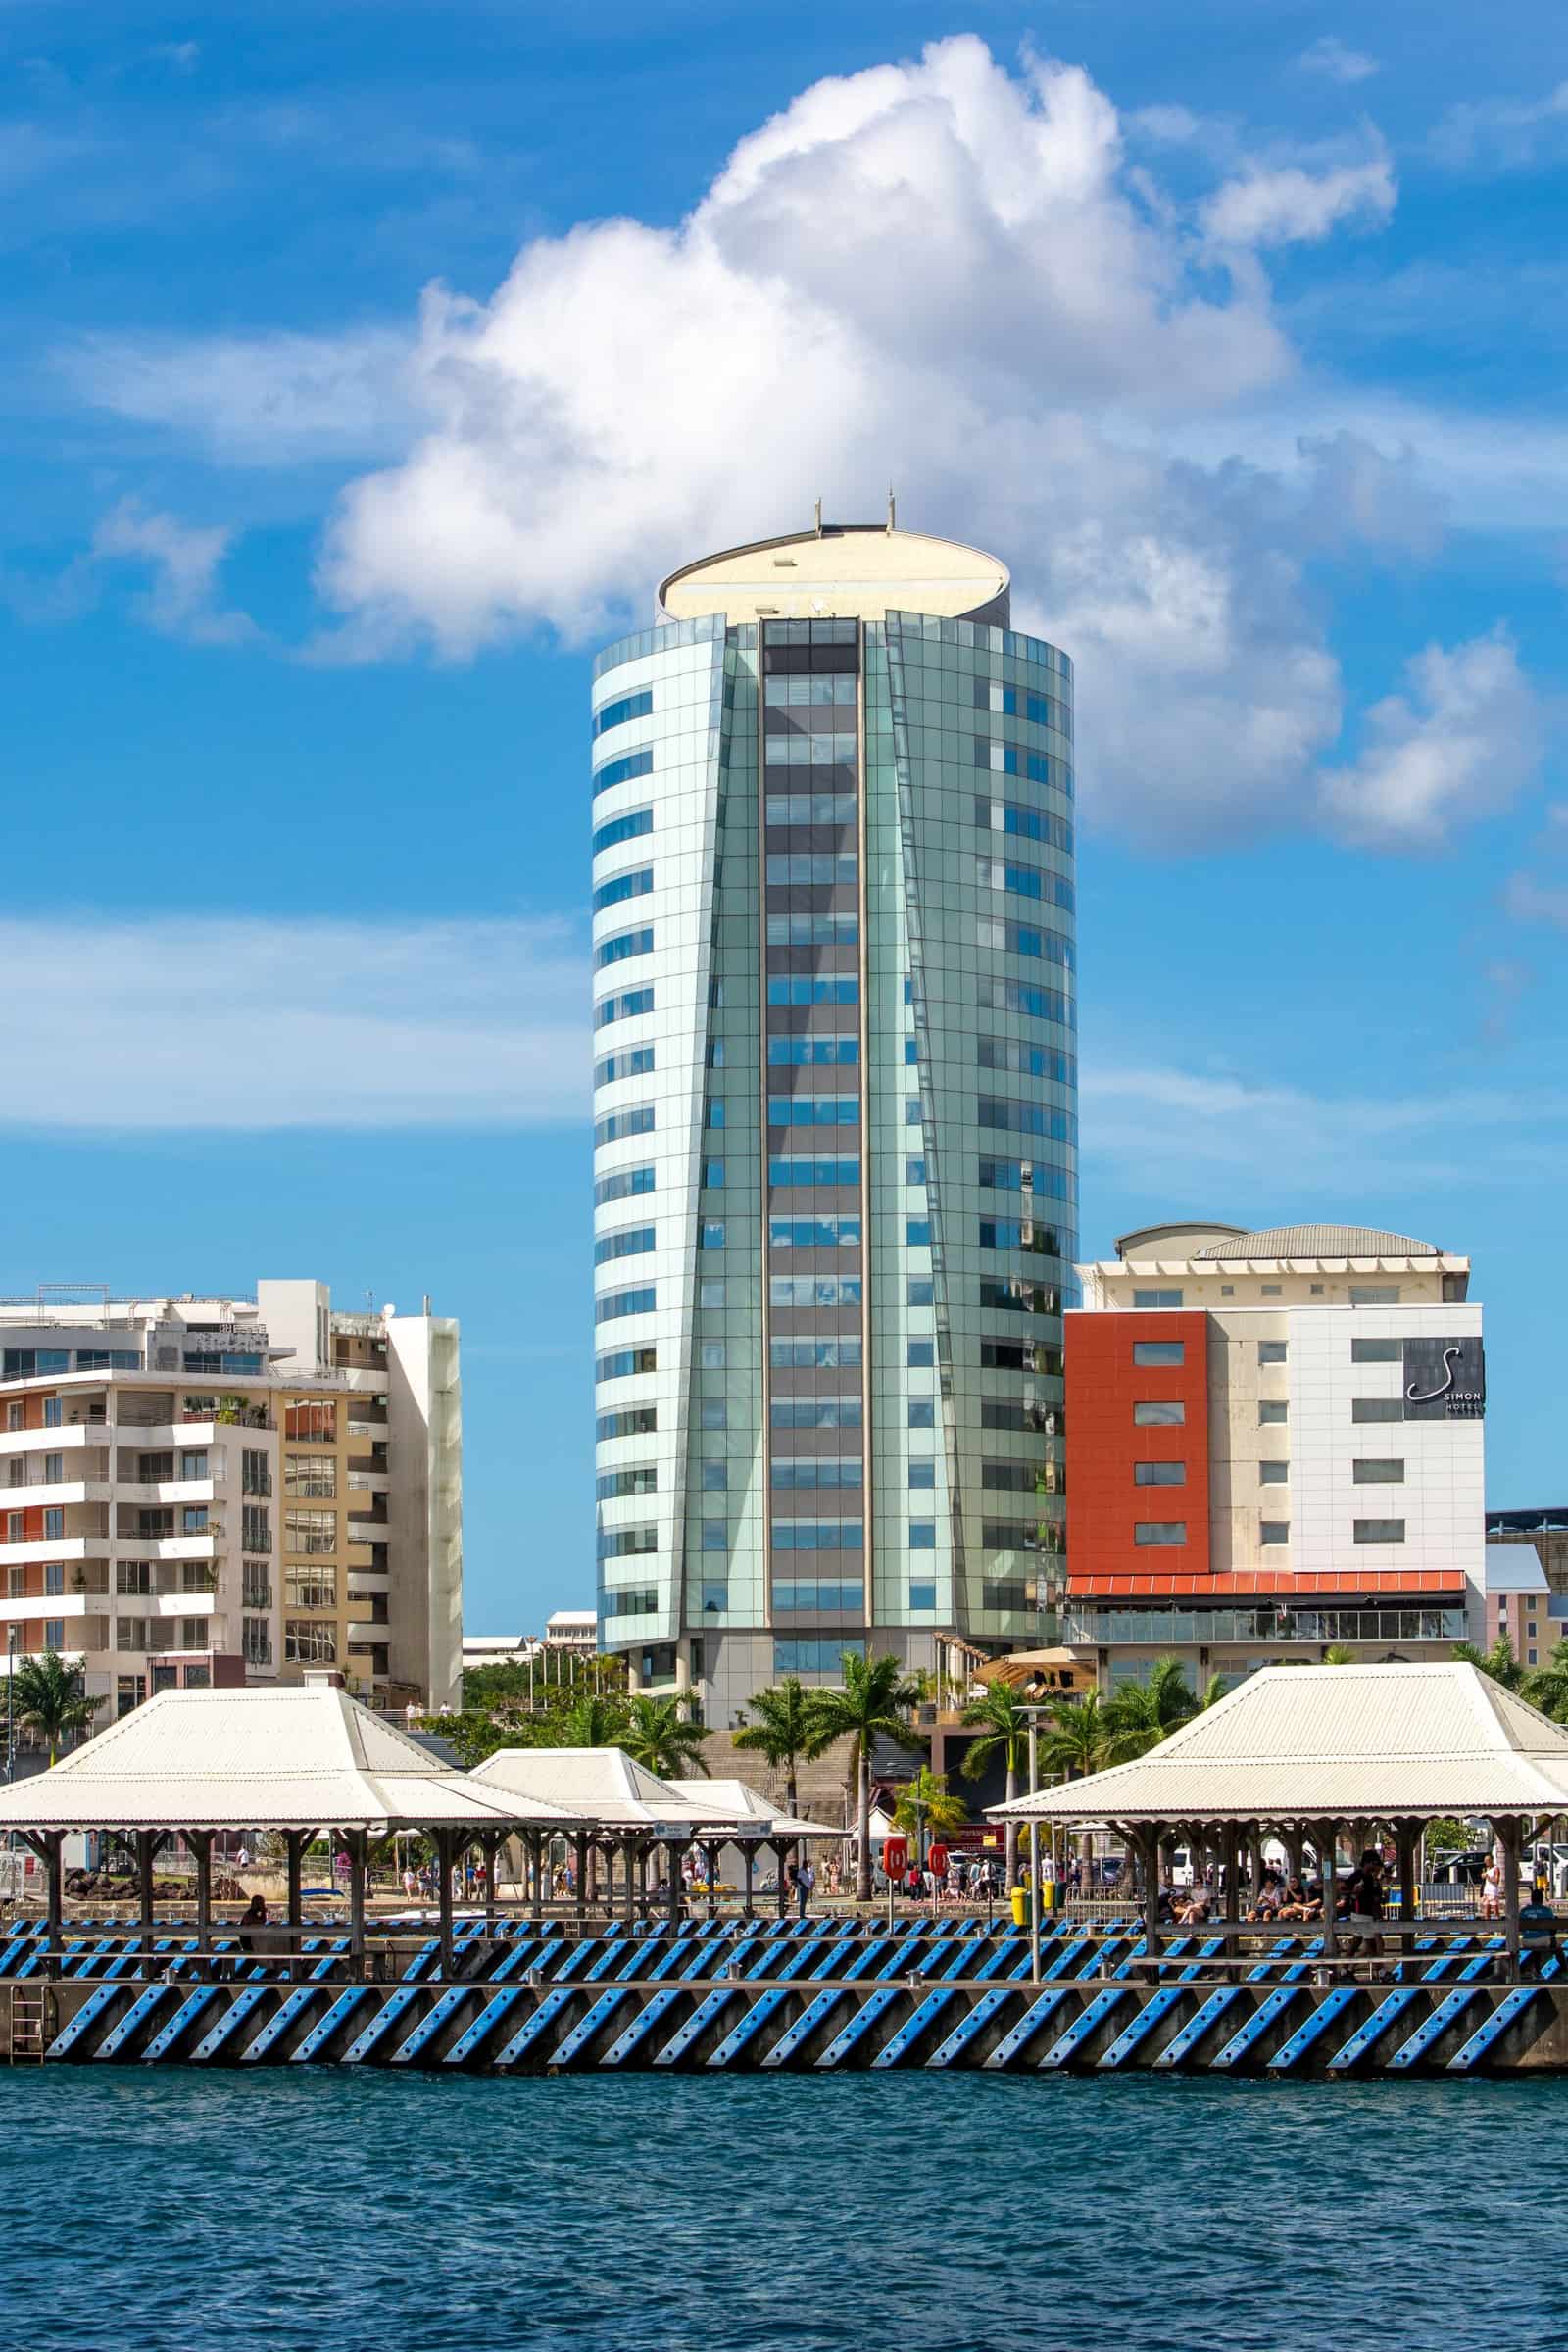 CECPAMURPort LouisMauritiusSmall island market with deep Indian roots and a CECPA covering 300+ products.From India 2025-26US$ 474 mn
 EGPCairoEgyptLarge North African market. Every shipment must be pre-registered on Egypt's ACI system before loading.From India 2025-26US$ 3.87 bn