

Africa
Export to South Africa
Africa's most industrial economy. Buys vehicles, medicines, rice and chemicals; NRCS approval for regulated goods.
- Capital
- Pretoria (executive capital)
- Currency
- ZAR
- Trade agreement with India
- None
- Main ports
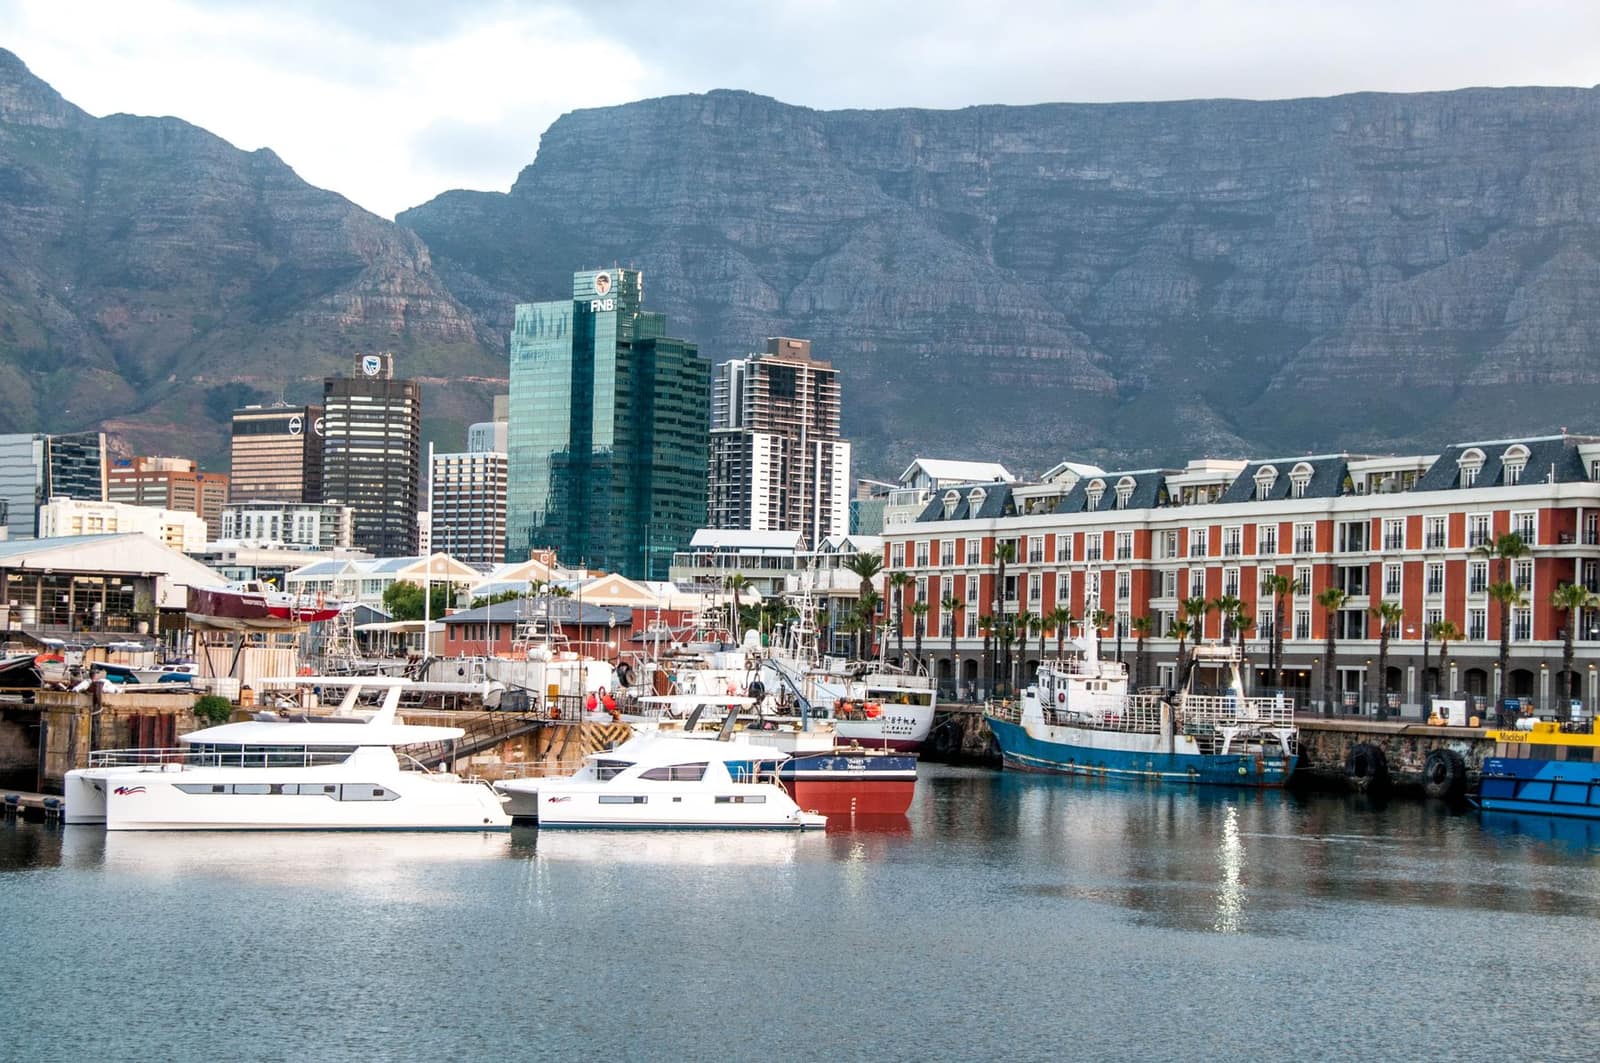
- Durban, Cape Town, Ngqura / Gqeberha (Port Elizabeth)
South Africa has no trade agreement with India; normal duties of the Southern African Customs Union apply. It is a large market for Indian vehicles, auto parts, medicines, rice, chemicals and footwear, and a base for reaching neighbouring countries. A large Indian-origin community lives around Durban and Johannesburg.
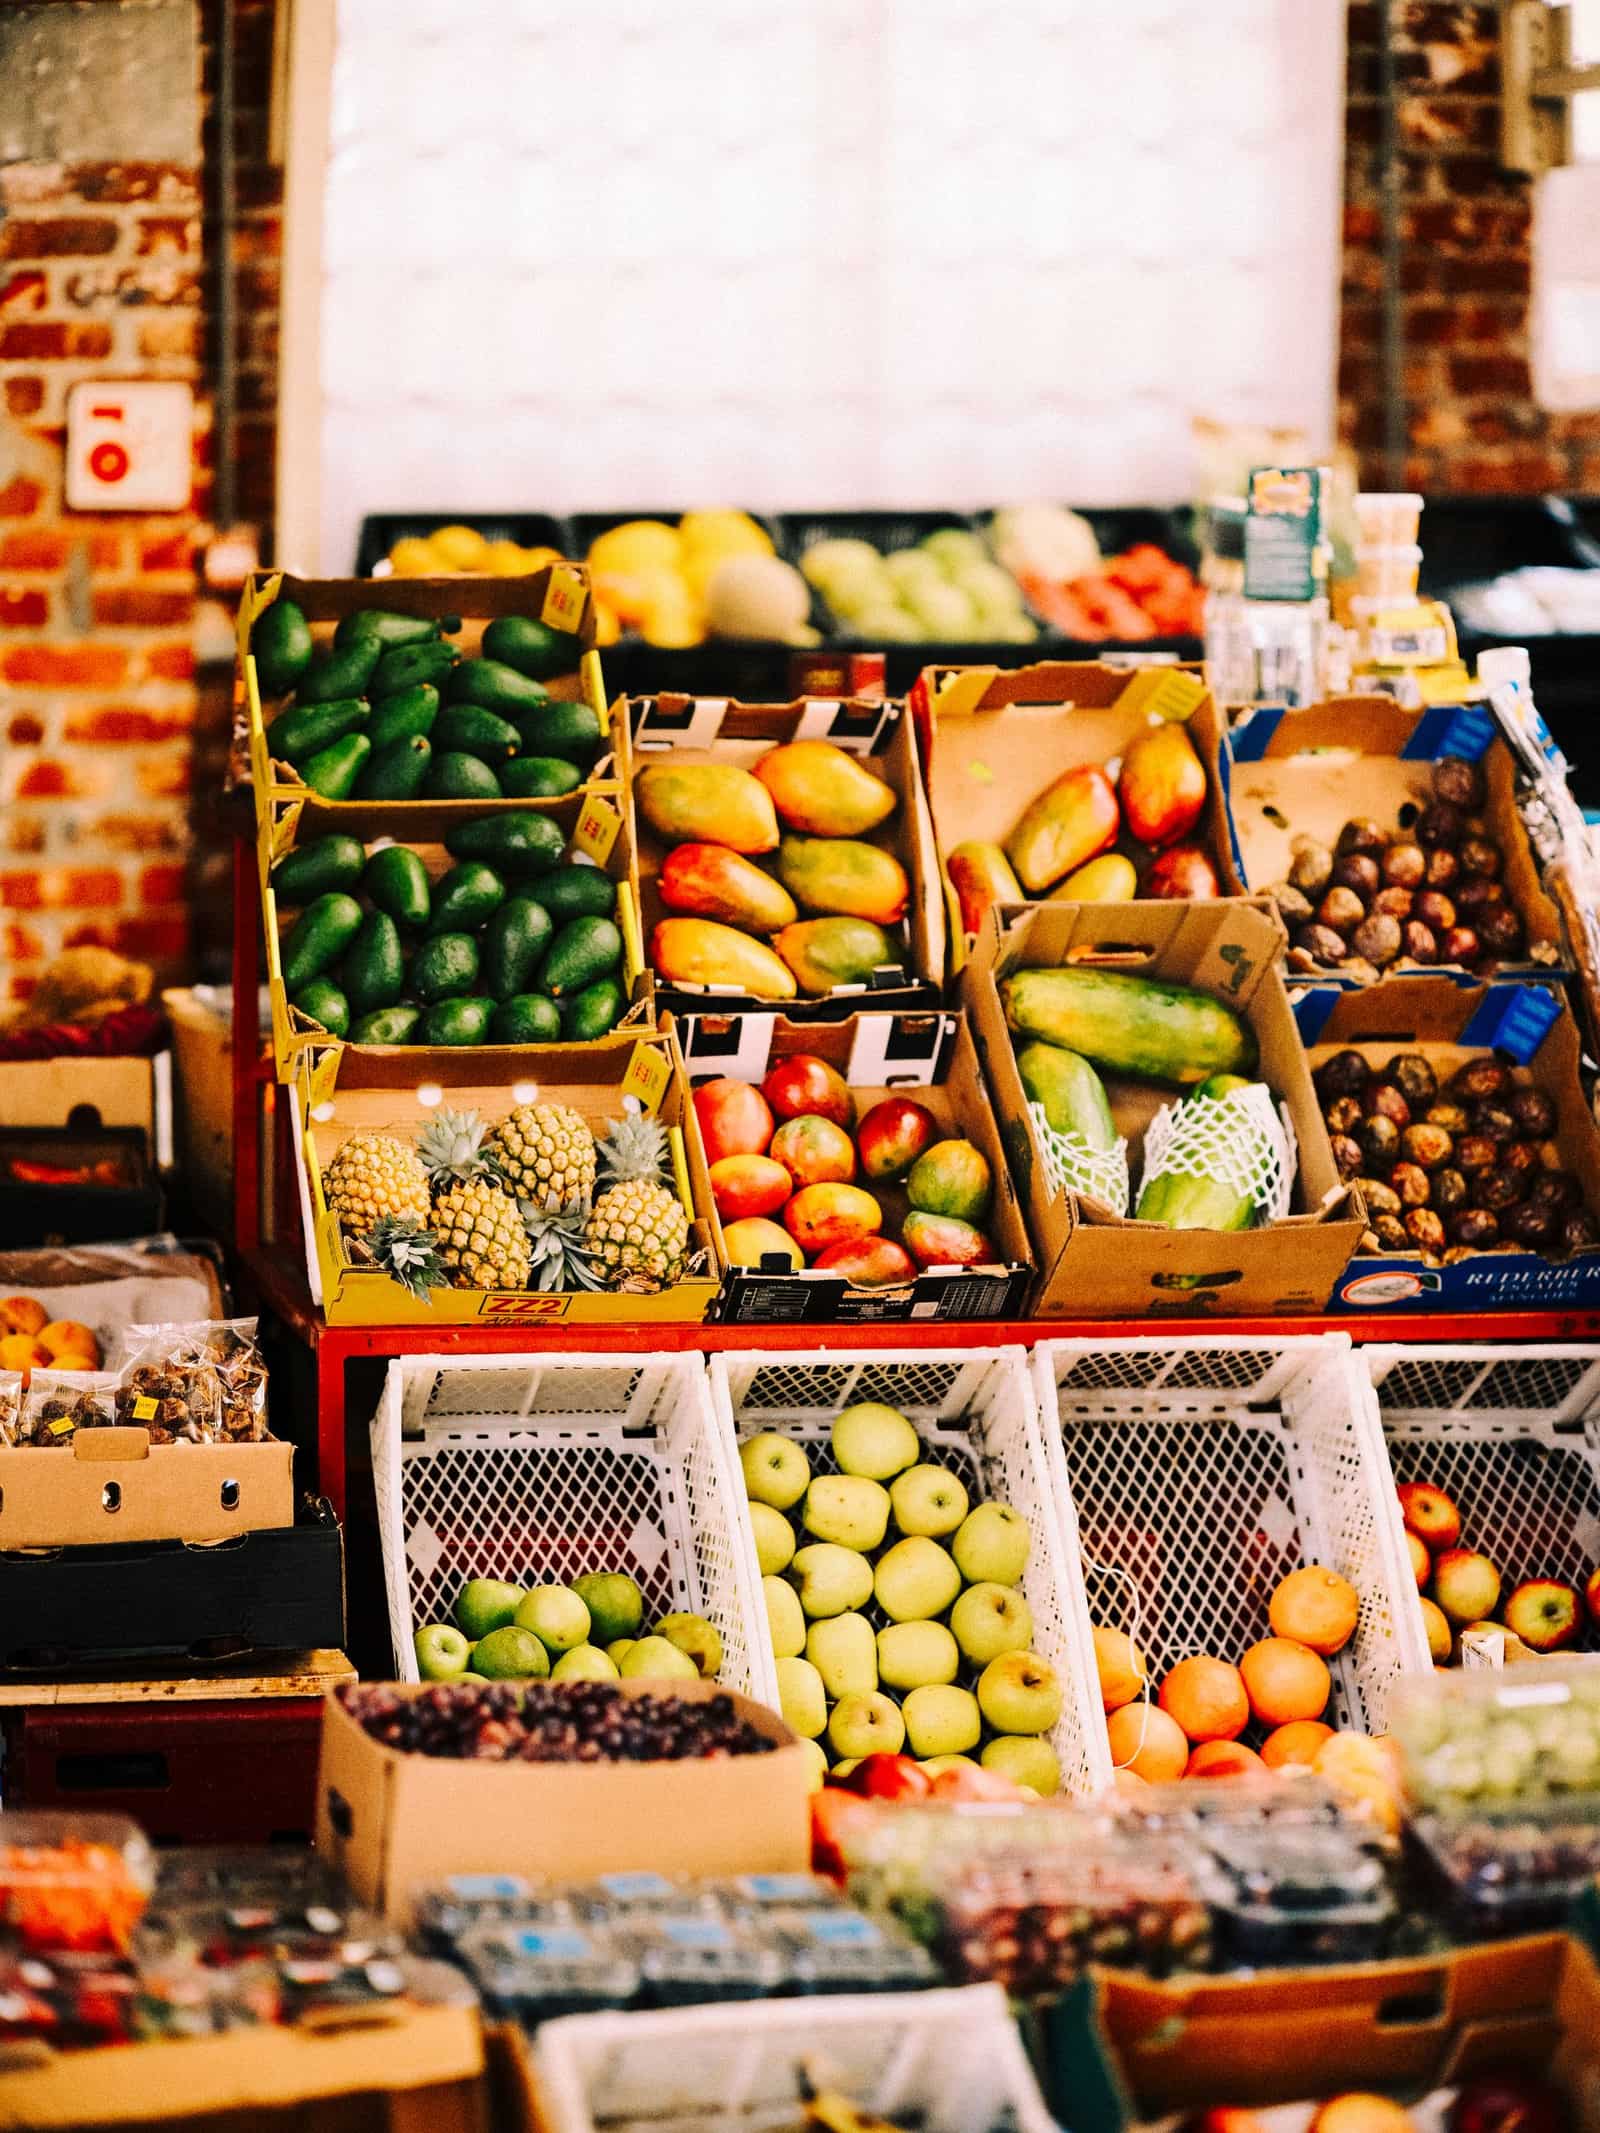
What it buys from India
- Vehicles, auto parts and machinery
- Petroleum products and chemicals
- Medicines
- Rice, footwear, textiles and garments
Import rules on their side
- Products under compulsory specifications (for example electrical goods, some auto parts and building products) need a Letter of Authority from the NRCS before sale.
- Plants and plant products need an import permit from South Africa's agriculture department and an Indian phytosanitary certificate.
- Medicines need registration with SAHPRA; food labels must follow South African labelling regulations.
Practical tips
- Durban is the main entry port and the hub of the Indian-origin trading community — a good place to start looking for buyers.
- Africa's Big 7 food show in Johannesburg is a useful fair for food exporters.
- Watch for anti-dumping duties on some Indian products; check the duty for your HS code with SARS.
Trade data
India’s exports to South Africa in numbers
From the Department of Commerce’s TradeStat (Indian financial years, April–March), the country’s imports from the world from UN Comtrade, and its basics from the World Bank.
- India’s exports here, 2025-26
- US$ 7.01 bn No. 16 of our 80 countries
- Change from 2024-25
- ↓ -6.1% US$ 7.46 bn → US$ 7.01 bn
- Share of all Indian exports
- 1.59%
- Its imports from the world
- US$ 101.2 bn 2024 · India’s share 7.76%
What India sells here most
By HS chapter, 2025-26. Change is against 2024-25.
What is rising and what is falling
Chapters where India sells at least US$ 5 million. Change from 2024-25 to 2025-26.
↑ High demand
- Explosives, matchesUS$ 27.7 mn → US$ 58.3 mn↑+110.3%
- Iron and steelUS$ 43.9 mn → US$ 79.6 mn↑+81.4%
- MachineryUS$ 368 mn → US$ 521 mn↑+41.6%
- Iron and steel articlesUS$ 42.1 mn → US$ 54.4 mn↑+29.4%
- AluminiumUS$ 58.7 mn → US$ 71.7 mn↑+22.2%
- Paper and paperboardUS$ 46.2 mn → US$ 54 mn↑+17.1%
- Vehicles and partsUS$ 1.63 bn → US$ 1.87 bn↑+15.1%
- Medicines and pharmaUS$ 637 mn → US$ 716 mn↑+12.3%
↓ Low demand
- Electrical and electronicsUS$ 357 mn → US$ 174 mn↓-51.2%
- Fuels and petroleum productsUS$ 2.82 bn → US$ 1.91 bn↓-32.1%
- Cereals (rice, wheat, maize)US$ 97.8 mn → US$ 87.8 mn↓-10.2%
Opportunity: what this country buys from the world, and from India
The country’s own recorded imports in UN Comtrade, 2024. Chapters with the biggest gap between what it buys from the world and what it buys from India.
Our product guides that sell here
India’s exports of each product to this country, 2025-26.
The 20 biggest export lines
4-digit HS lines, 2025-26, with their Harmonized System descriptions.
What India buys from South Africa
India’s imports from this country in 2025-26 by HS chapter, from TradeStat — this country can be your supplier too.
- India’s imports, 2025-26
- US$ 8.56 bn US$ 10.5 bn → US$ 8.56 bn
- India’s exports, 2025-26
- US$ 7.01 bn
- Trade balance
- −US$ 1.55 bn exports minus imports
- Change in imports
- -18.8%
The country at a glance
- Population
- 64.7 mn 2025
- GDP
- US$ 427.2 bn 2025
- GDP per person
- US$ 6,598 2025
- Imports (goods and services)
- US$ 126 bn 2025
Sources: TradeStat — Export Import Data Bank, Department of Commerce · UN Comtrade database (United Nations Statistics Division) · World Bank — World Development Indicators · Figures taken 29 October 2026.
What to send to South Africa
All products → Free, with conditionsFarm produceNon-basmati riceHigh-volume staple sold mainly to Africa and Bangladesh. Export reopened in 2024–25, but contracts must now be registered with APEDA.HS1006.30Exports 2025-26US$ 5.86 bn ↓10.2%
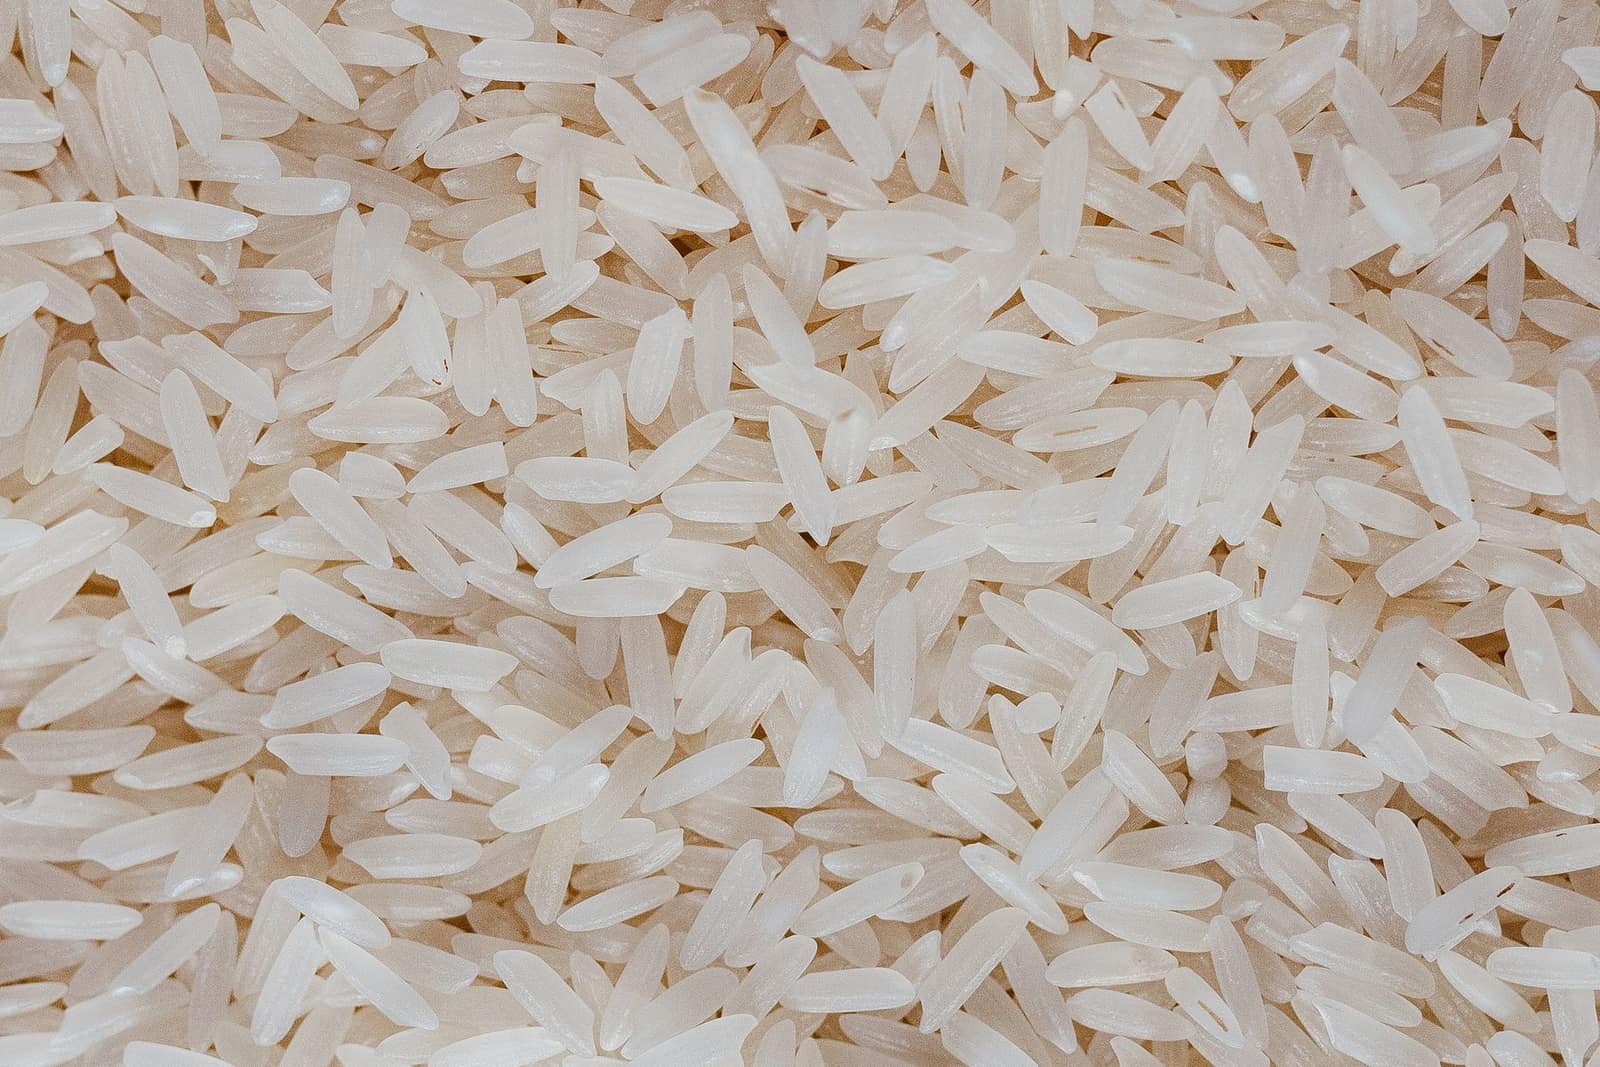 Free, with conditionsFarm produceBasmati riceIndia’s top agri export by value. Free to export, but every contract must be registered with APEDA first.HS1006.30Exports 2025-26US$ 5.67 bn ↓4.6%
 Free to exportFarm produceSpicesWhole, ground and blended spices. Spices Board registration (CRES) is compulsory; residue and ethylene oxide tests keep buyers.HS0904–0910Exports 2025-26US$ 3.12 bn ↓5.1%
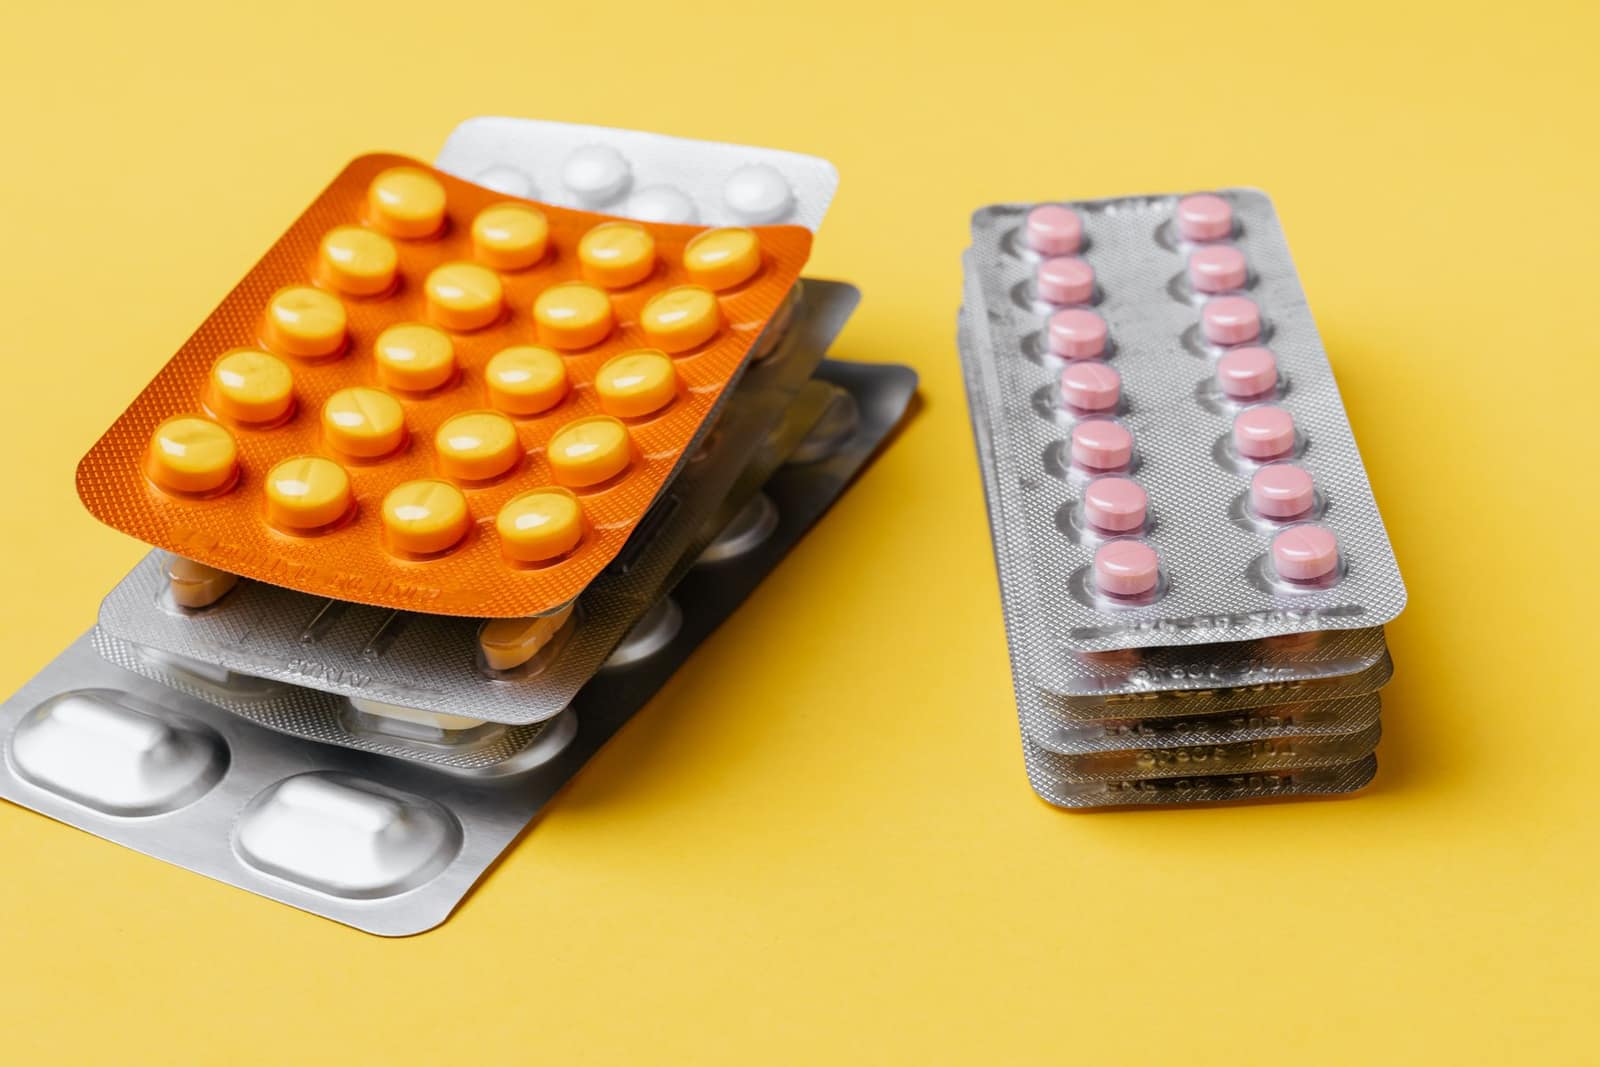 Free to exportPharma & chemicalsGeneric medicines (formulations)Tablets, capsules and injectables; every market needs product registration. The USA buys the most.HS3004Exports 2025-26US$ 21.9 bn ↓0.7%
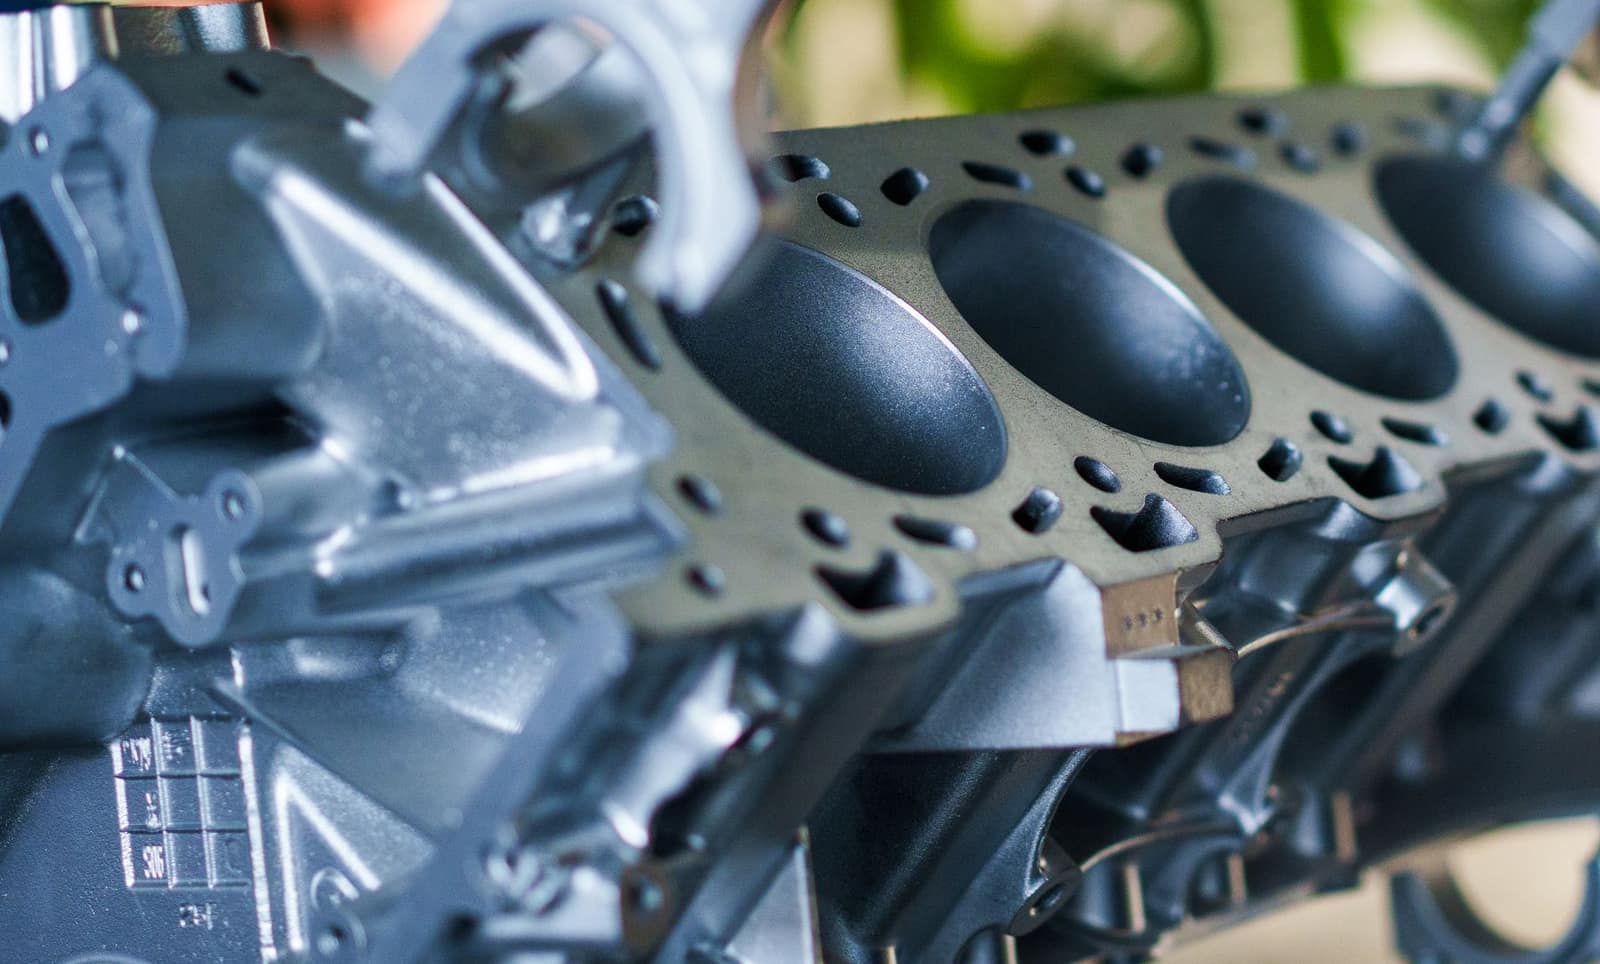 Free to exportEngineering goodsAuto parts and componentsOEM and aftermarket vehicle parts; the USA, Germany and Italy buy most, with strong demand in Latin America.HS8708Exports 2025-26US$ 7.64 bn ↑1.8%
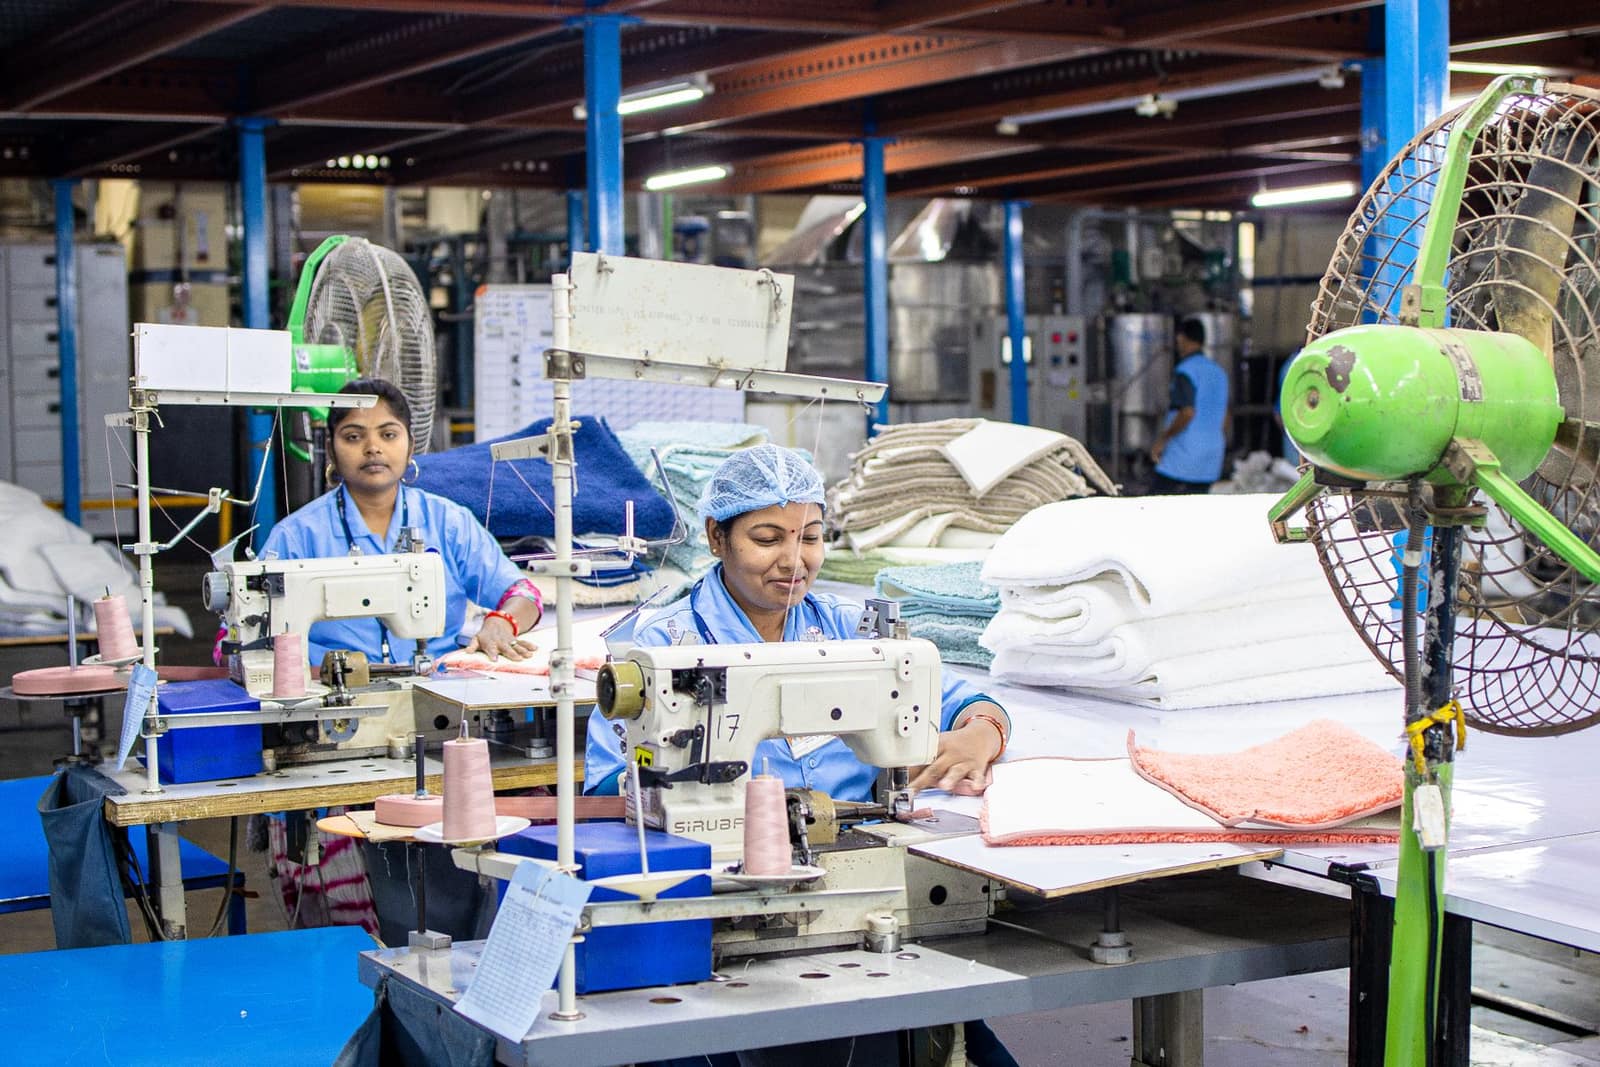 Free to exportTextiles & apparelReadymade garmentsKnitted and woven clothing for brands and retailers; the USA, UK, UAE and the EU are the big buyers.HS6109.10Exports 2025-26US$ 15.8 bn ↓1.2%
 Free to exportLeather & footwearFootwearLeather shoes, sandals and boots from Agra, Kanpur and Tamil Nadu; the USA, UK and Germany lead.HS6403Exports 2025-26US$ 1.69 bn ↓4.7%
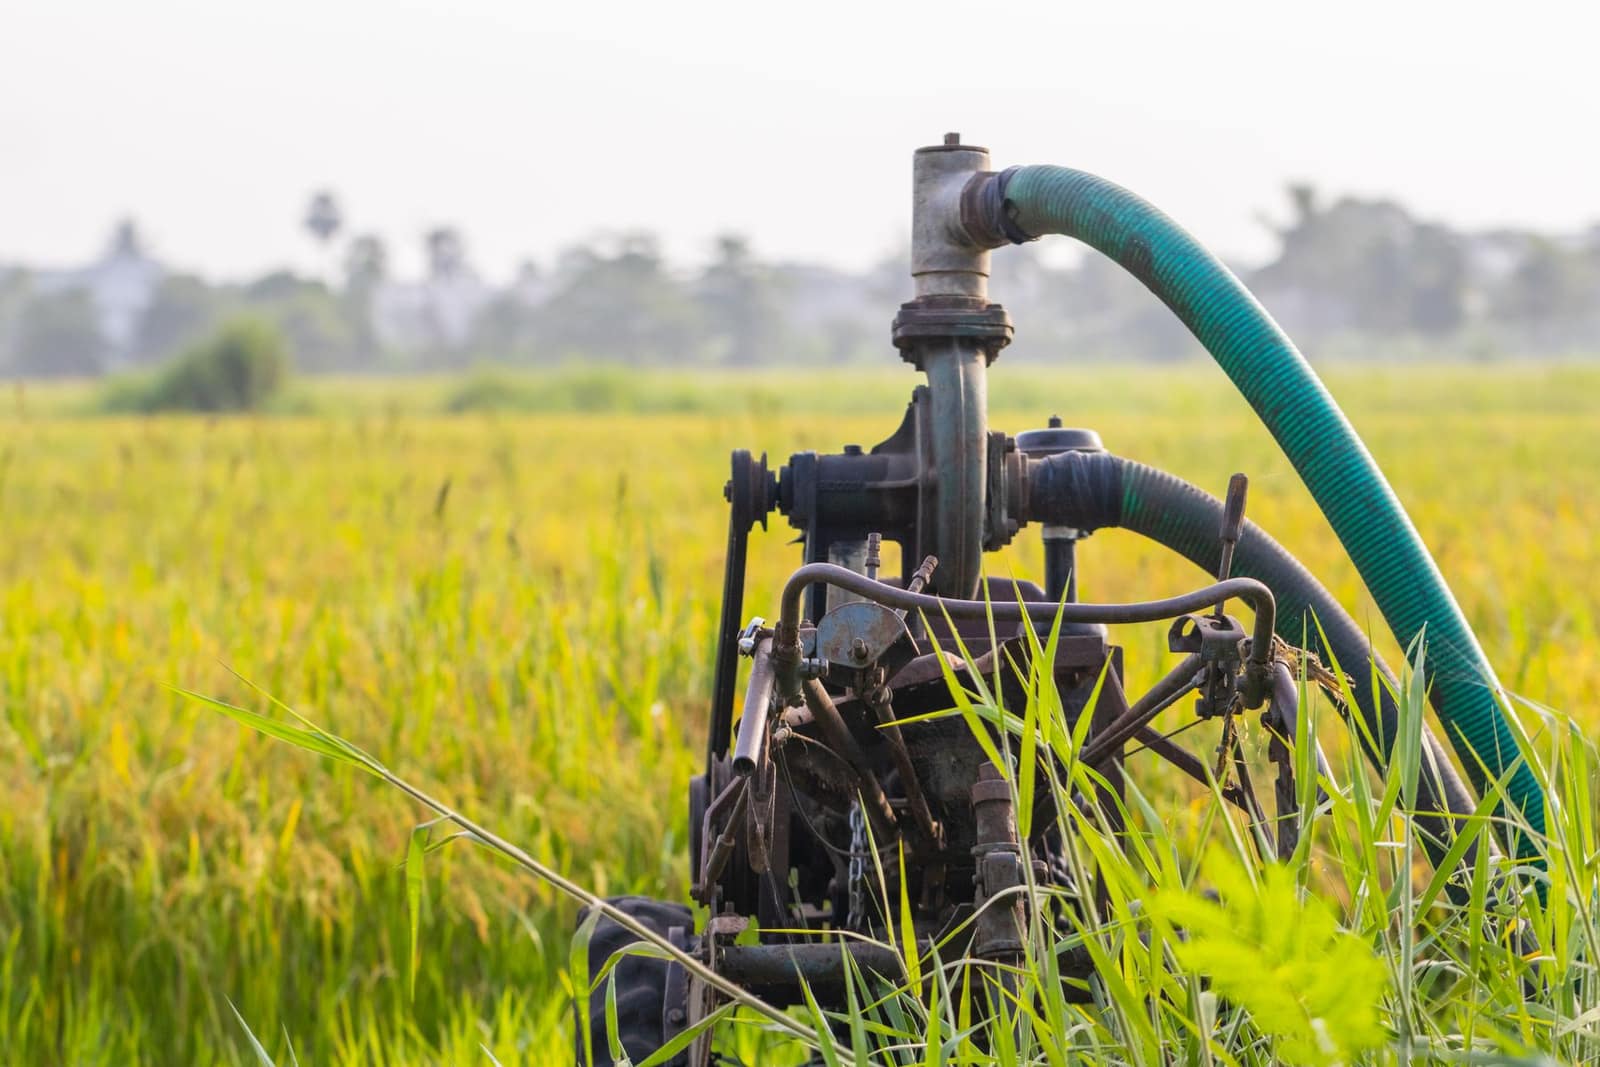 Free to exportEngineering goodsPumpsAgricultural, domestic and industrial pumps from Coimbatore, Rajkot and Ahmedabad; the USA leads.HS8413Exports 2025-26US$ 1.6 bn ↑5.2%
More in Africa
 KESNairobiKenyaEast Africa's trade gateway via Mombasa. Buys medicines, vehicles, steel and rice; KEBS pre-shipment checks apply.From India 2025-26US$ 4.02 bn
 CECPAMURPort LouisMauritiusSmall island market with deep Indian roots and a CECPA covering 300+ products.From India 2025-26US$ 474 mn
 EGPCairoEgyptLarge North African market. Every shipment must be pre-registered on Egypt's ACI system before loading.From India 2025-26US$ 3.87 bn
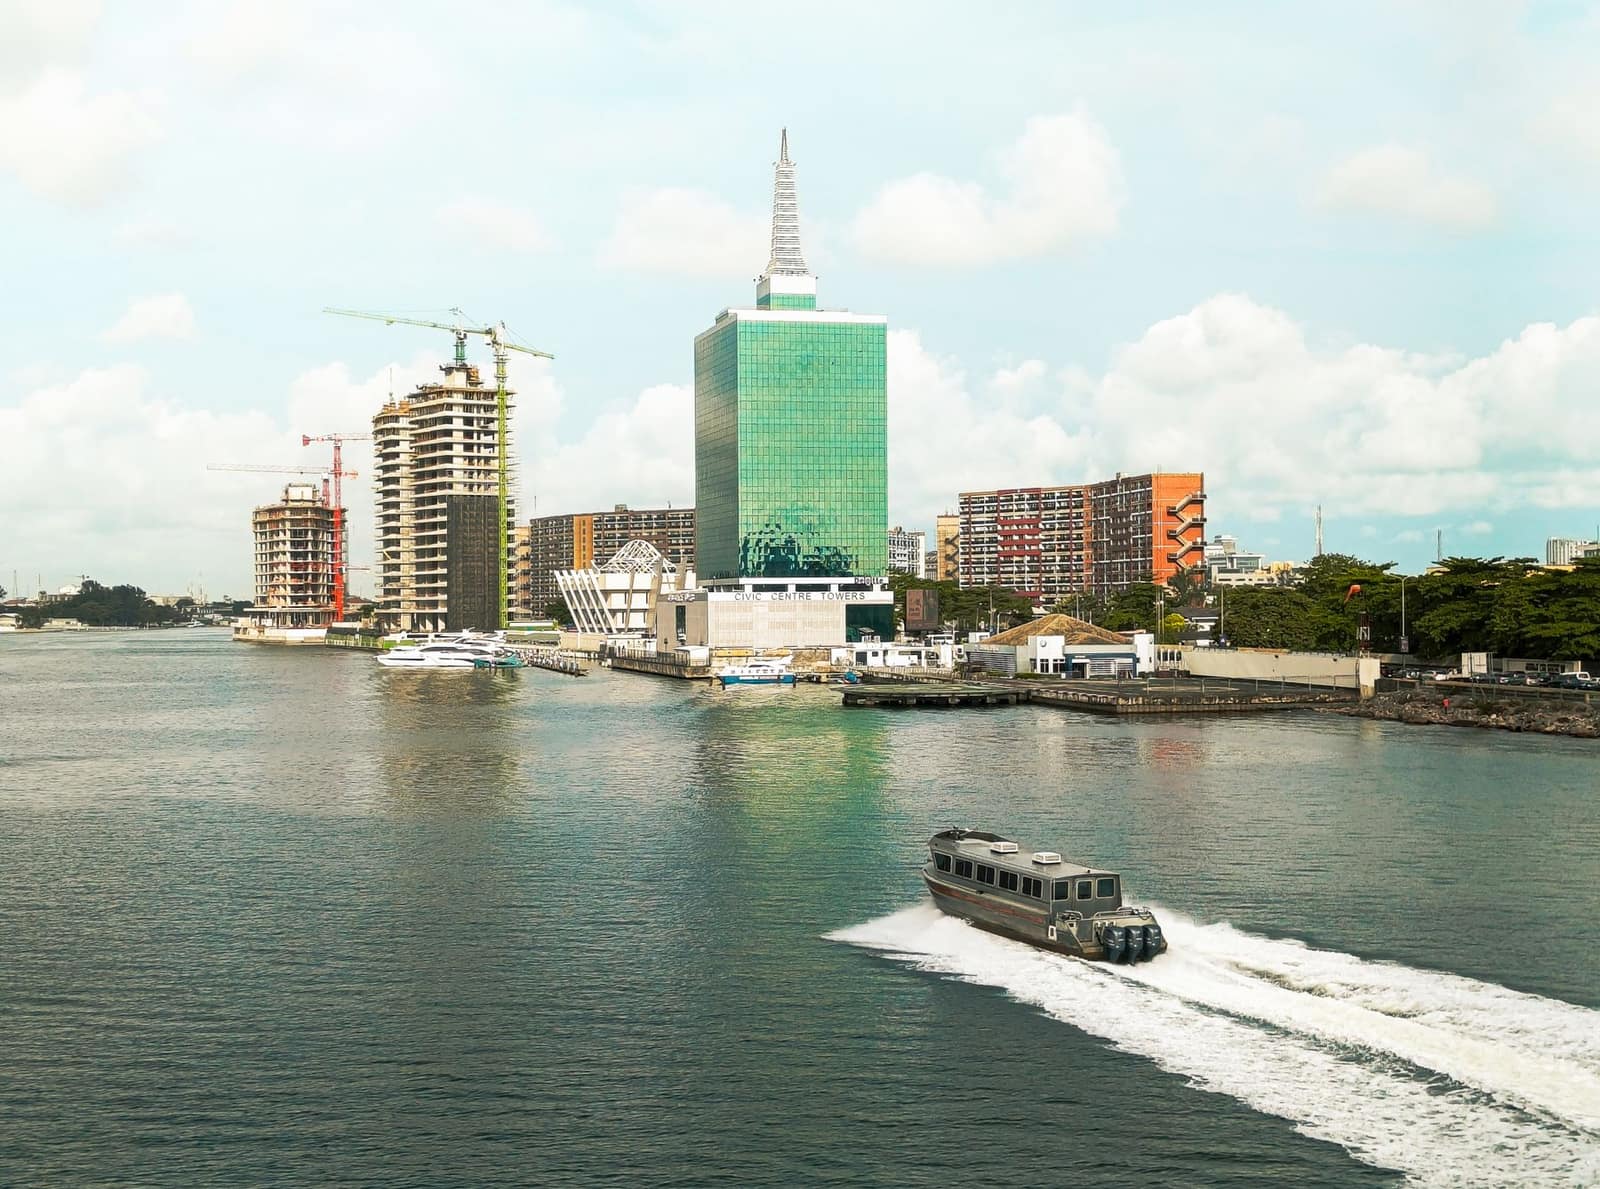 NGNAbujaNigeriaAfrica's most populous country and a big buyer of Indian medicines, vehicles and machinery. Form M, SONCAP and NAFDAC rules apply.From India 2025-26US$ 3.13 bn