

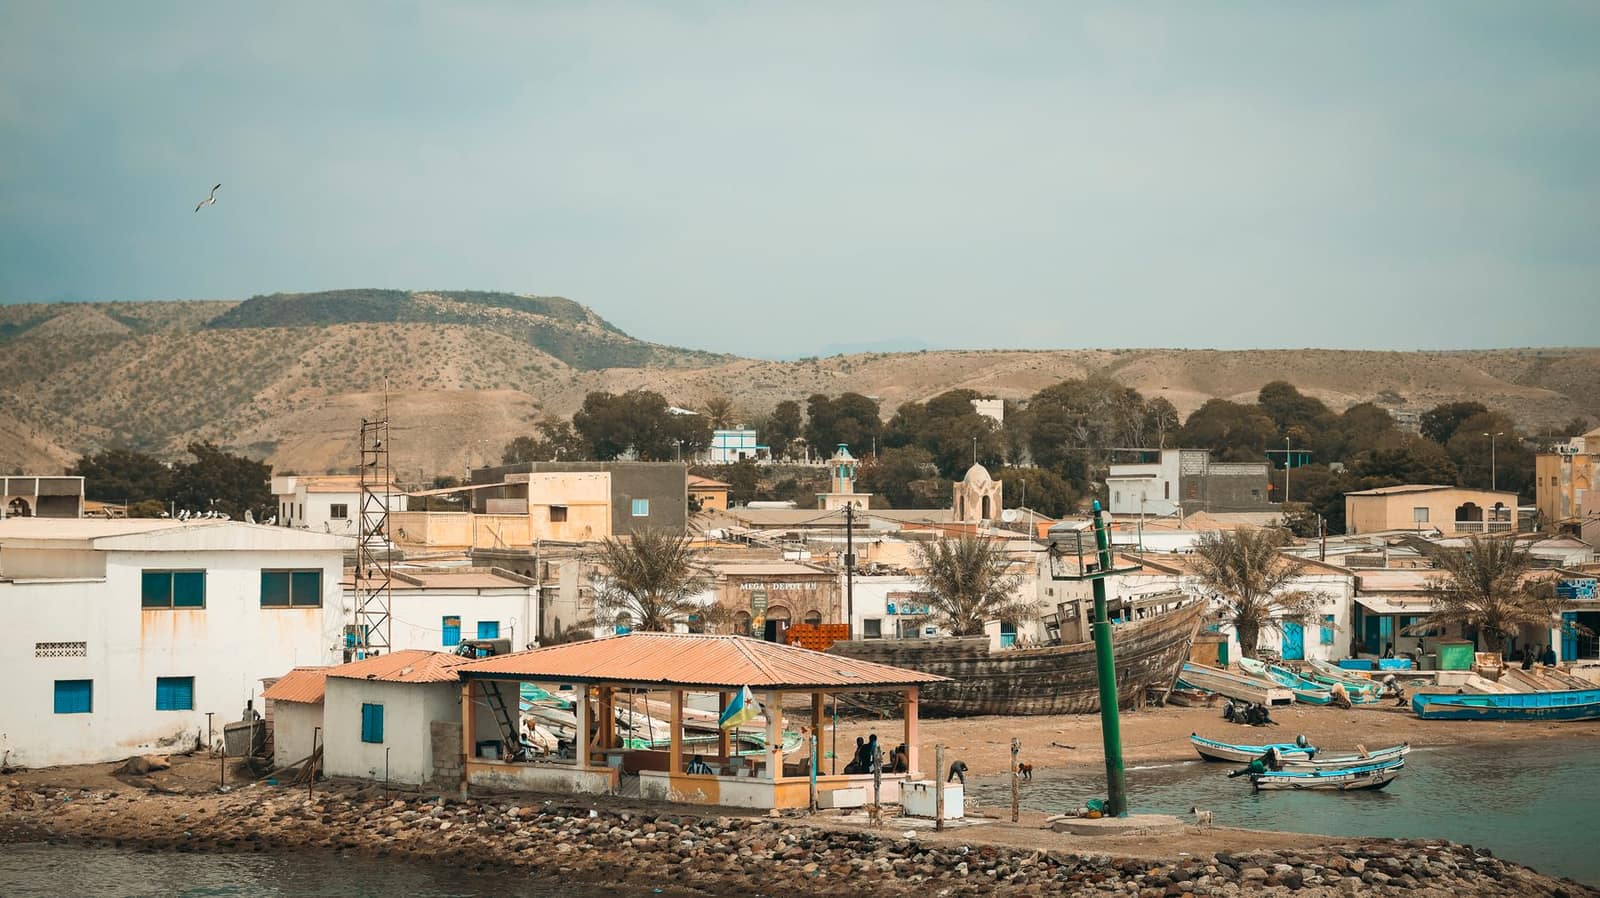
Africa
Export to Djibouti
Red Sea port state and Ethiopia's main gateway. Buys Indian rice, sugar products, food and building materials, much of it for transit.
- Capital
- Djibouti City
- Currency
- DJF
- Trade agreement with India
- None
- Main ports
- Doraleh Multipurpose Port, Port of Djibouti, Djibouti–Ambouli International Airport
Djibouti has no trade agreement with India. It is a small country, but its ports handle most of Ethiopia's foreign trade, and it has large free zones for storage and re-export. Its own market buys food, building materials and consumer goods. The Djibouti franc is pegged to the US dollar.
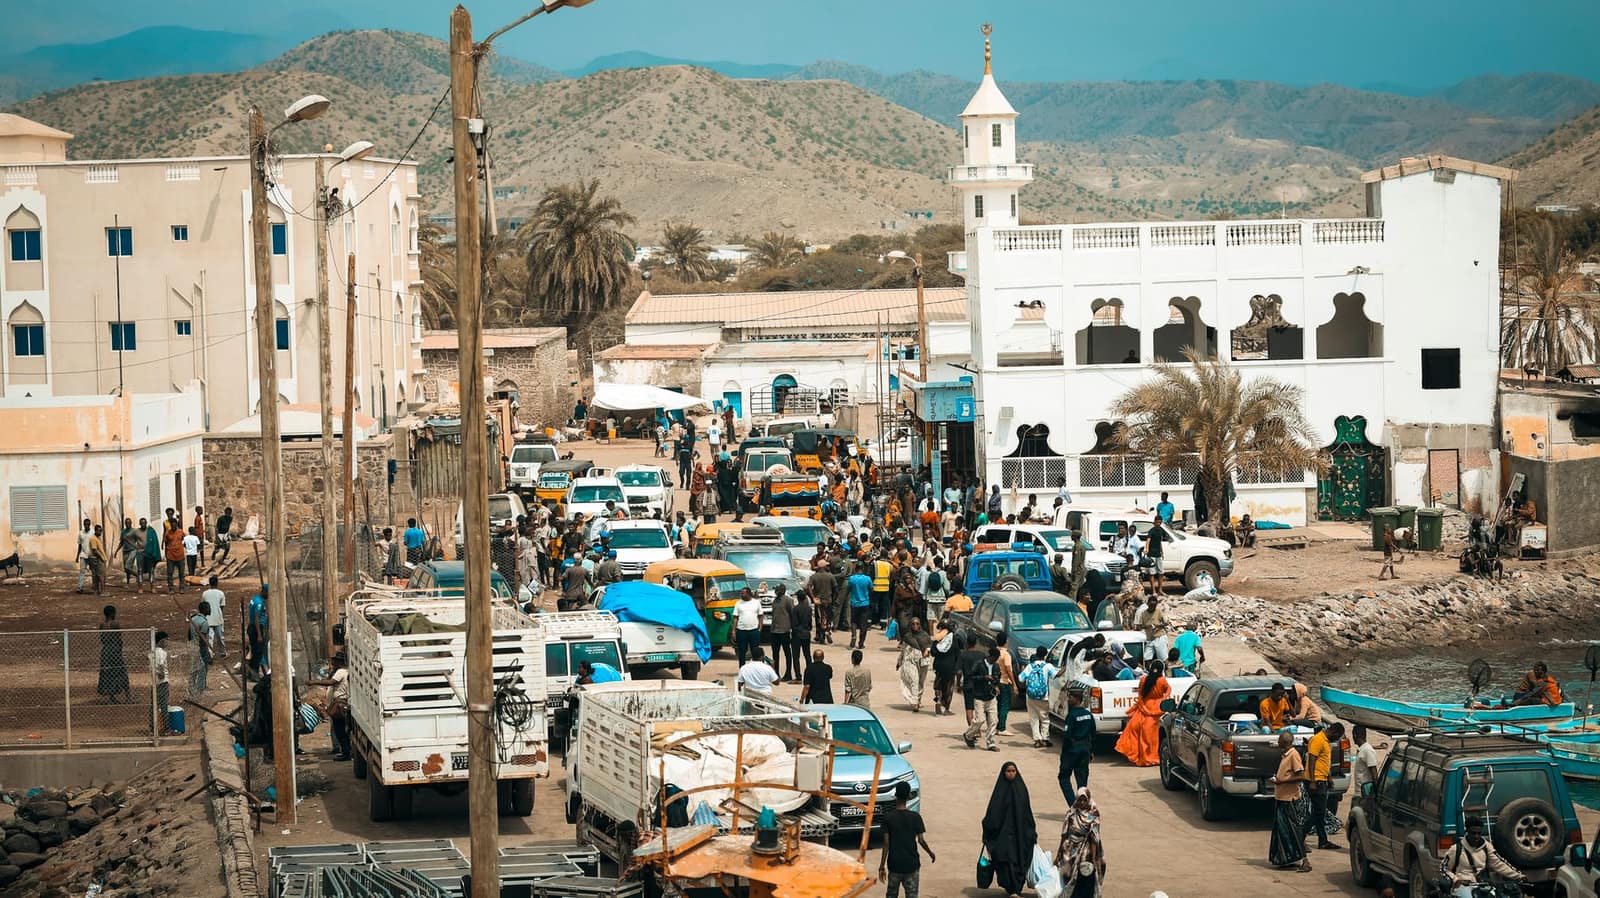
What it buys from India
- Rice, spices and other food
- Building materials, steel and ceramic products
- Medicines and consumer goods
- Goods in transit to Ethiopia
Import rules on their side
- Goods for Ethiopia move under transit documents and must also meet Ethiopia's import rules (EFDA registration, LC from an Ethiopian bank).
- Food and medicines for the local market need clearance from Djibouti's health ministry; labels should carry French or Arabic.
- Goods stored in Djibouti's free zones can be re-exported without local duty; ask the buyer whether the cargo is for the free zone, local use or transit.
Practical tips
- Make the consignee and notify party clear on the bill of lading — transit cargo for Ethiopia is often consigned to an Ethiopian bank under an LC.
- Quote in USD; the Djibouti franc's dollar peg makes USD pricing standard.
- Take advance payment or a confirmed LC; check ECGC cover before giving credit.
Trade data
India’s exports to Djibouti in numbers
From the Department of Commerce’s TradeStat (Indian financial years, April–March), the country’s imports from the world from UN Comtrade, and its basics from the World Bank.
- India’s exports here, 2025-26
- US$ 971 mn No. 60 of our 80 countries
- Change from 2024-25
- ↑ +43.3% US$ 677 mn → US$ 971 mn
- Share of all Indian exports
- 0.22%
- Its imports from the world
- —
What India sells here most
By HS chapter, 2025-26. Change is against 2024-25.
What is rising and what is falling
Chapters where India sells at least US$ 5 million. Change from 2024-25 to 2025-26.
↑ High demand
- MachineryUS$ 29.4 mn → US$ 72 mn↑+144.6%
- Medicines and pharmaUS$ 16.5 mn → US$ 37.8 mn↑+128.6%
- Fuels and petroleum productsUS$ 117 mn → US$ 223 mn↑+90.6%
- Inorganic chemicalsUS$ 3.6 mn → US$ 6 mn↑+66.9%
- Sugar and confectioneryUS$ 137 mn → US$ 221 mn↑+61.5%
- Man-made filamentsUS$ 7.6 mn → US$ 11.2 mn↑+46.9%
- PlasticsUS$ 33.8 mn → US$ 49.4 mn↑+46.4%
- Cereals (rice, wheat, maize)US$ 93.3 mn → US$ 131 mn↑+40.7%
↓ Low demand
- Electrical and electronicsUS$ 22.9 mn → US$ 16.4 mn↓-28.3%
- Other chemical productsUS$ 12.6 mn → US$ 9.9 mn↓-21.6%
- Vehicles and partsUS$ 71.5 mn → US$ 63.7 mn↓-10.9%
Our product guides that sell here
India’s exports of each product to this country, 2025-26.
The 20 biggest export lines
4-digit HS lines, 2025-26, with their Harmonized System descriptions.
What India buys from Djibouti
India’s imports from this country in 2025-26 by HS chapter, from TradeStat — this country can be your supplier too.
- India’s imports, 2025-26
- US$ 21.4 mn US$ 18.6 mn → US$ 21.4 mn
- India’s exports, 2025-26
- US$ 971 mn
- Trade balance
- +US$ 949 mn exports minus imports
- Change in imports
- +15.4%
The country at a glance
- Population
- 1.2 mn 2025
- GDP
- US$ 4.62 bn 2025
- GDP per person
- US$ 3,906 2025
- Imports (goods and services)
- US$ 4.43 bn 2025
Sources: TradeStat — Export Import Data Bank, Department of Commerce · World Bank — World Development Indicators · Figures taken 29 October 2026.
What to send to Djibouti
All products → Free, with conditionsFarm produceNon-basmati riceHigh-volume staple sold mainly to Africa and Bangladesh. Export reopened in 2024–25, but contracts must now be registered with APEDA.HS1006.30Exports 2025-26US$ 5.86 bn ↓10.2%
 Free, with conditionsFarm produceBasmati riceIndia’s top agri export by value. Free to export, but every contract must be registered with APEDA first.HS1006.30Exports 2025-26US$ 5.67 bn ↓4.6%
 Free to exportFarm produceSpicesWhole, ground and blended spices. Spices Board registration (CRES) is compulsory; residue and ethylene oxide tests keep buyers.HS0904–0910Exports 2025-26US$ 3.12 bn ↓5.1%
 Free to exportProcessed foodProcessed foodSnacks, pickles, ready-to-eat meals, sauces, biscuits and mixes. FSSAI licence plus the buyer country’s labelling and registration rules.HS19–21Exports 2025-26US$ 4.19 bn ↑8.9%
 Free to exportOther goodsCeramic and vitrified tilesMorbi-made wall, floor and vitrified tiles shipped by container; the UAE, Russia, USA and UK lead.HS6907Exports 2025-26US$ 2.12 bn ↓0.5%
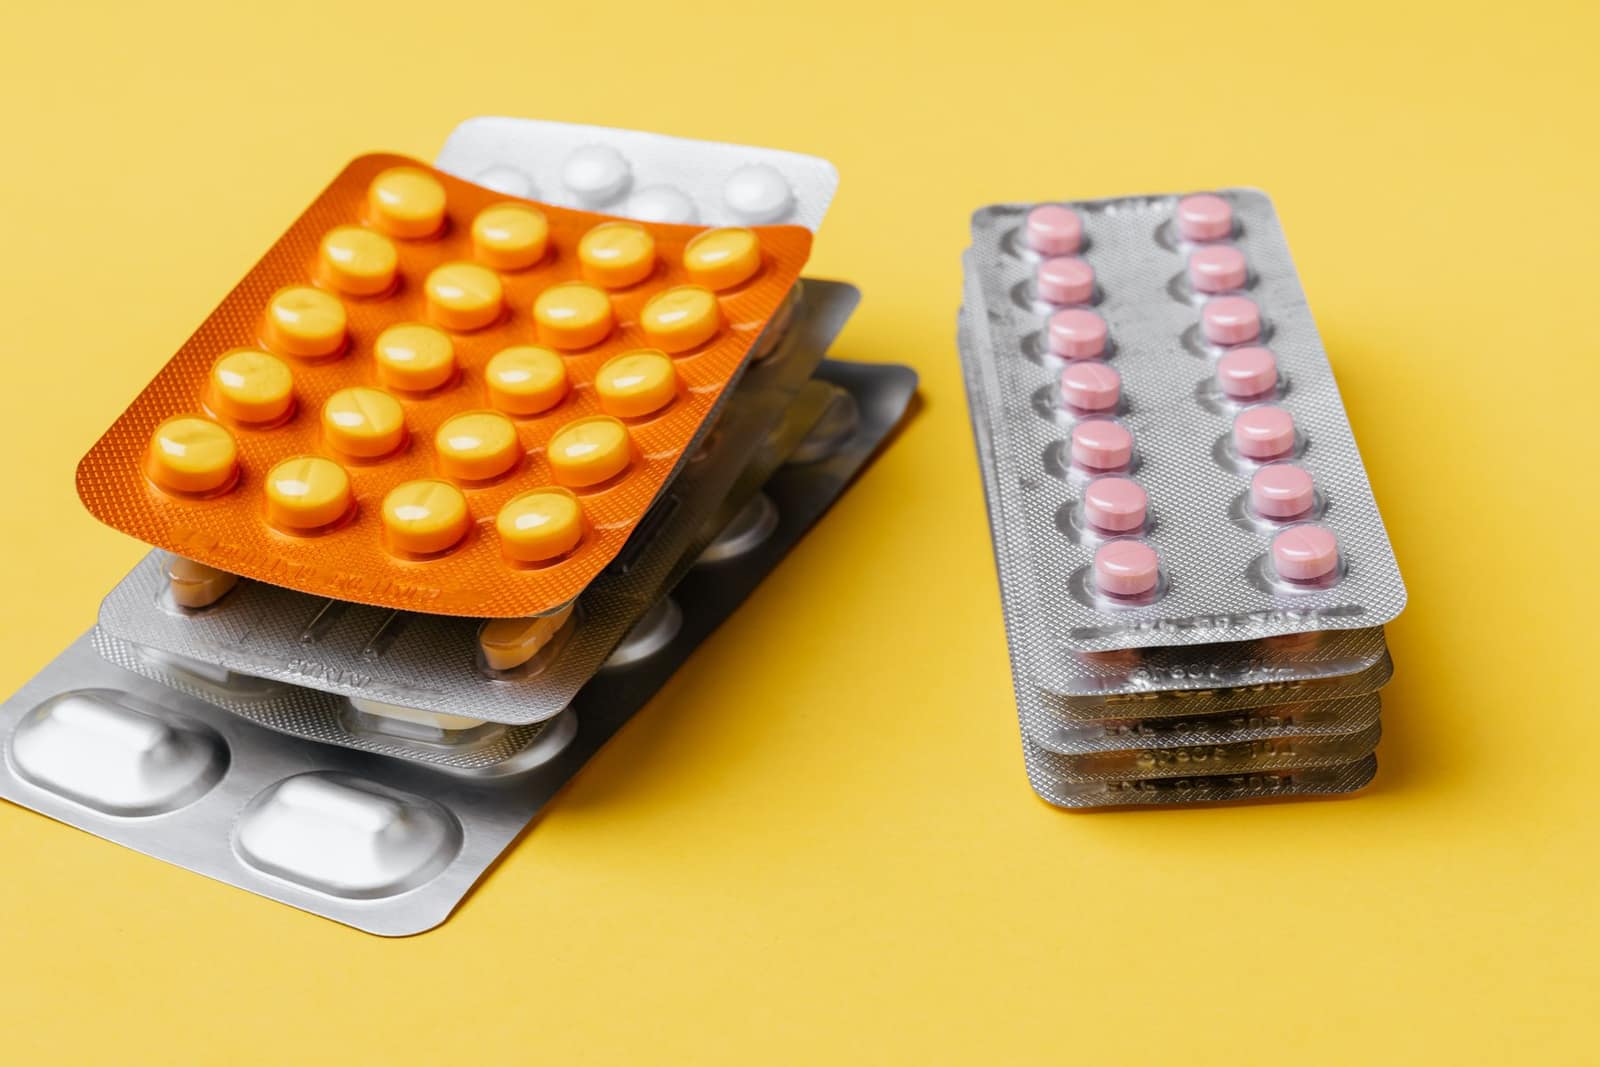 Free to exportPharma & chemicalsGeneric medicines (formulations)Tablets, capsules and injectables; every market needs product registration. The USA buys the most.HS3004Exports 2025-26US$ 21.9 bn ↓0.7%
 Free to exportOther goodsPlastic goods and packagingWoven sacks, FIBC bags, containers and household plastics; the USA leads, then the UAE and UK.HS3923Exports 2025-26US$ 1.21 bn ↑3.3%
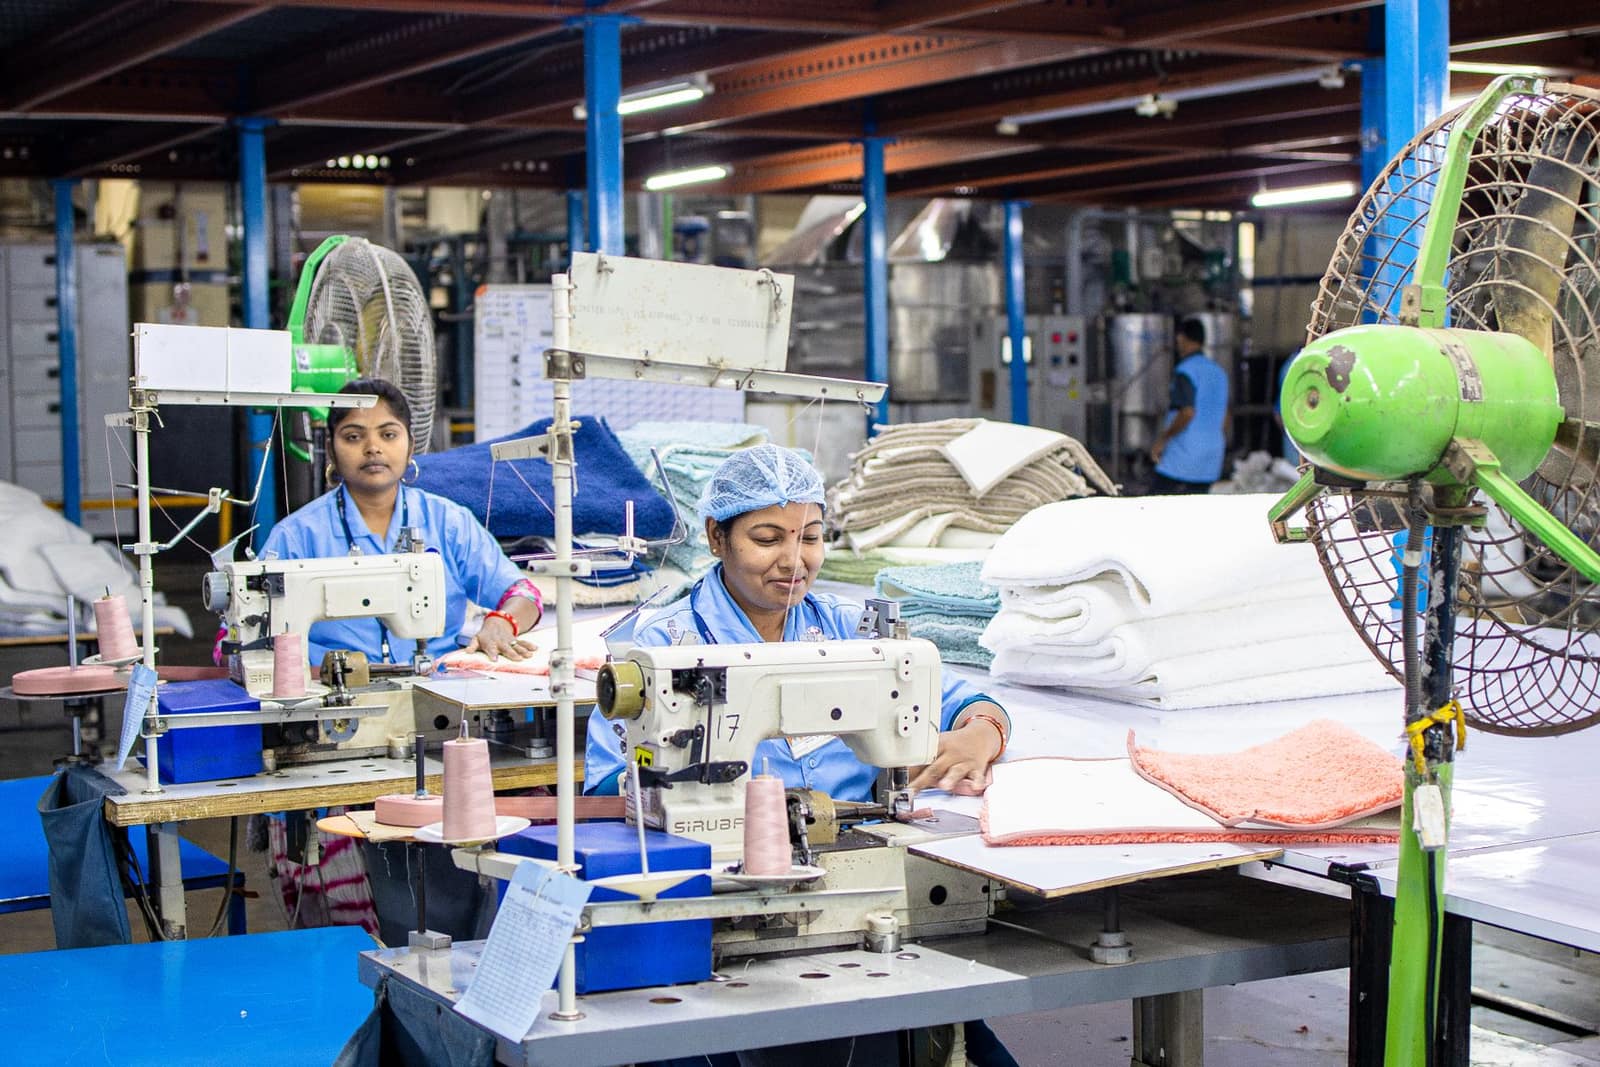 Free to exportTextiles & apparelReadymade garmentsKnitted and woven clothing for brands and retailers; the USA, UK, UAE and the EU are the big buyers.HS6109.10Exports 2025-26US$ 15.8 bn ↓1.2%
More in Africa
 KESNairobiKenyaEast Africa's trade gateway via Mombasa. Buys medicines, vehicles, steel and rice; KEBS pre-shipment checks apply.From India 2025-26US$ 4.02 bn
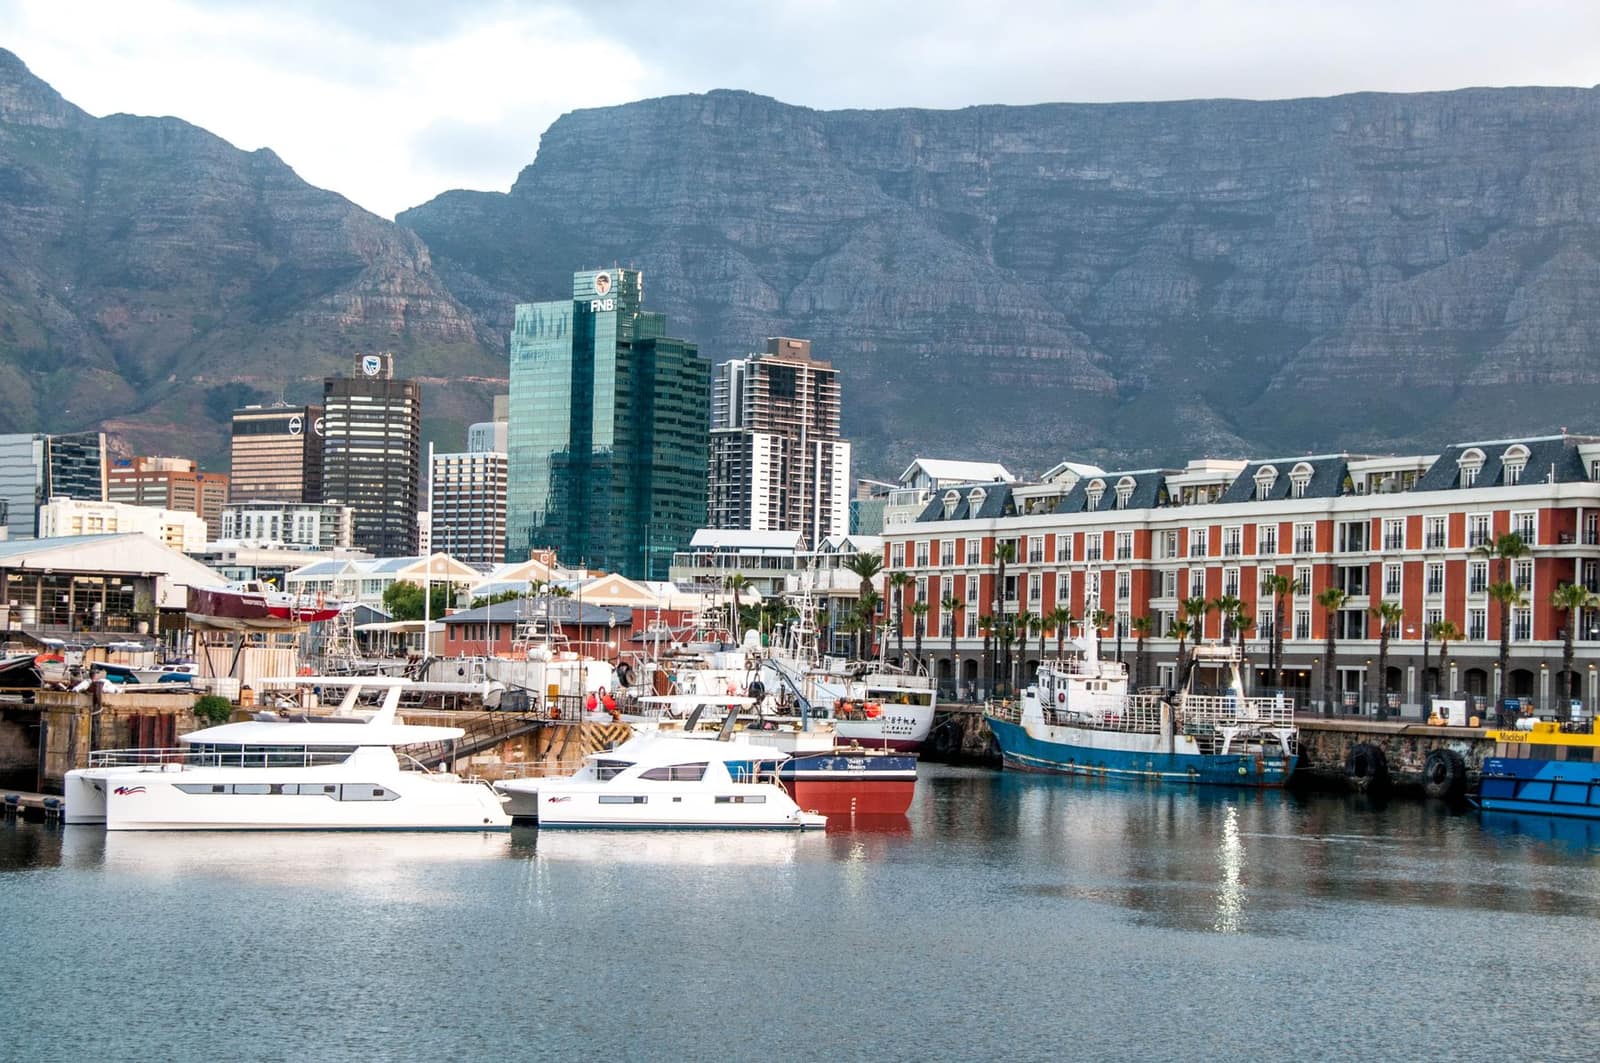 ZARPretoria (executive capital)South AfricaAfrica's most industrial economy. Buys vehicles, medicines, rice and chemicals; NRCS approval for regulated goods.From India 2025-26US$ 7.01 bn
 CECPAMURPort LouisMauritiusSmall island market with deep Indian roots and a CECPA covering 300+ products.From India 2025-26US$ 474 mn
 EGPCairoEgyptLarge North African market. Every shipment must be pre-registered on Egypt's ACI system before loading.From India 2025-26US$ 3.87 bn