

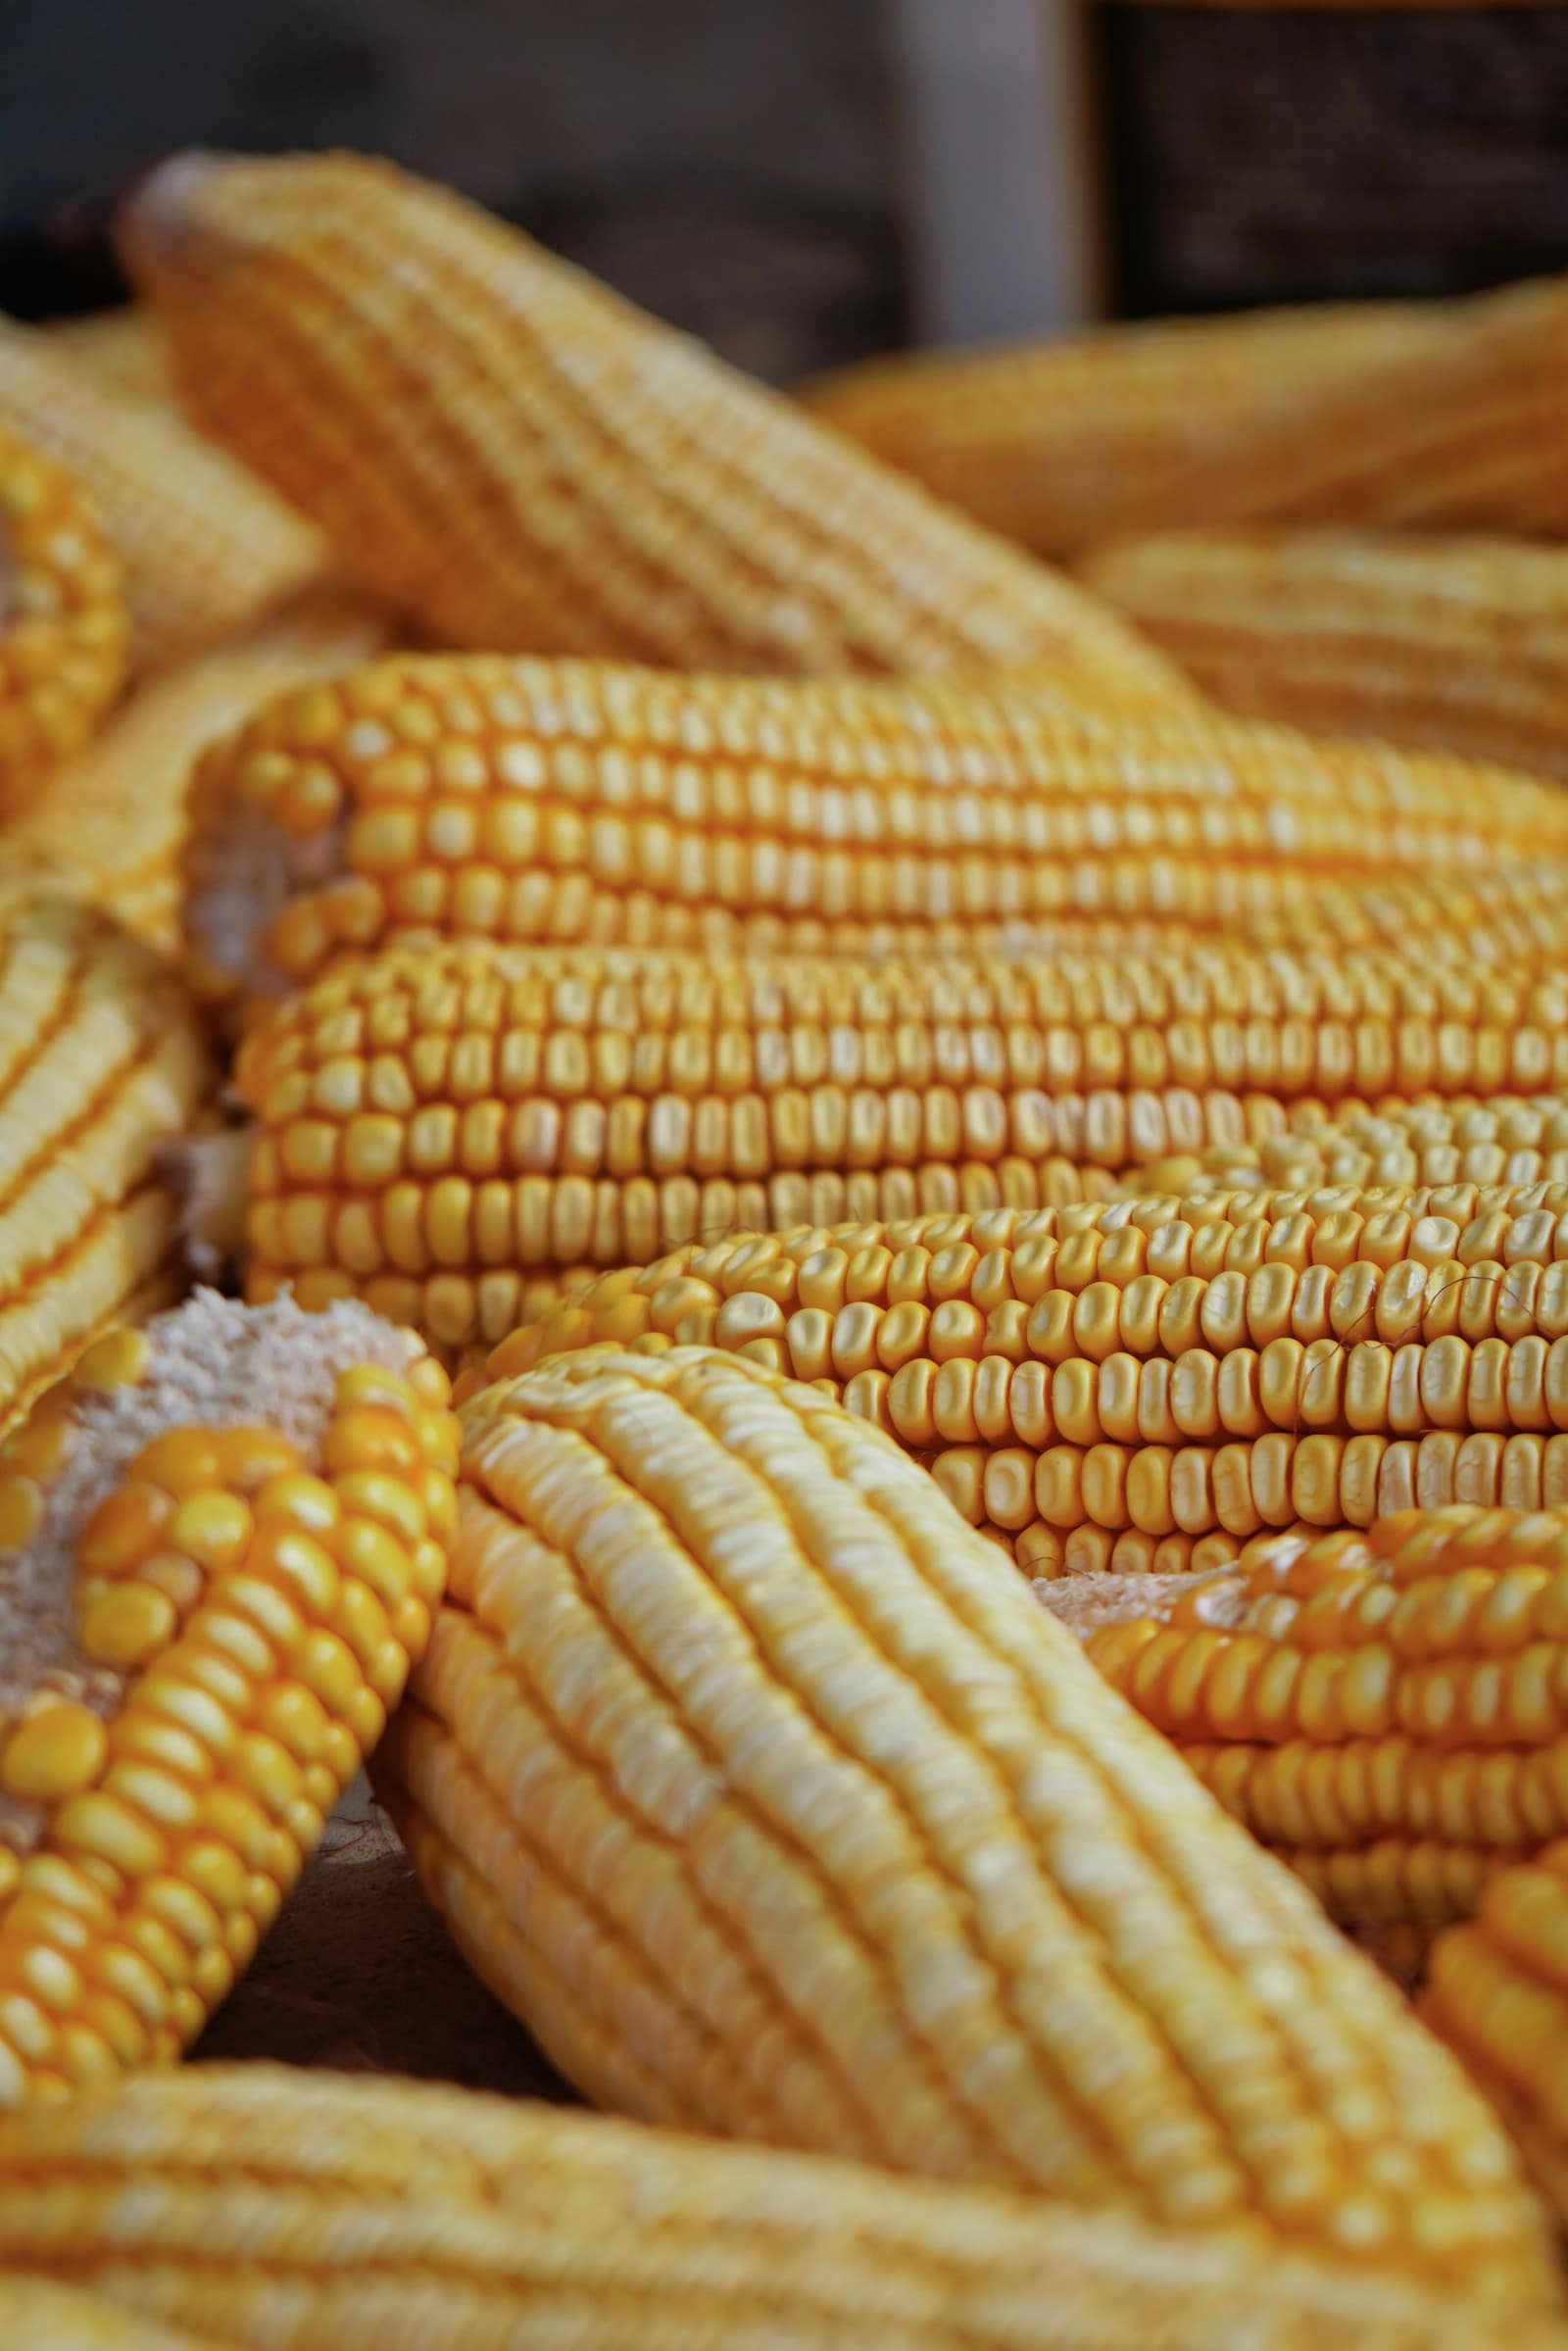
Farm produce
Export maize (corn)
Feed-grade yellow maize for poultry and starch makers in Bangladesh, Nepal, Vietnam and Sri Lanka.
- HS code
- 1005 Maize seed (1005 10) and other maize (1005 90 — yellow, white, flint, popcorn). Sweet corn on the cob is a vegetable (0709 99).
- Export policy
- Free to export Export is Free under ITC(HS) Schedule 2; we found no recent restriction. Confirm current status on dgft.gov.in.
- Registrations
- 4 IEC, GST and those below
- India’s exports, 2025-26
- US$ 375 mn to 52 countries
What is exported
APEDA reports maize exports of 1.25 million tonnes worth US$ 374.7 million in 2025-26, with Bangladesh (28.2%), Nepal (24.5%), Vietnam (22.0%), Sri Lanka (6.6%) and Thailand (3.3%) as the main destinations. India is the world’s fifth-largest maize producer (FAO, 2024). Domestic demand for ethanol now competes for the same grain, which affects export prices.

Varieties, grades and forms
- Yellow maize (1005 90 11)Feed grade; almost all export volume.
- White maize and flint cornFood uses; small specialised trade.
- Popcorn and seed maizeNiche lines with their own buyer specifications.
Where it is grown or made
- Karnataka and TelanganaDavangere, Haveri; Karimnagar, Warangal — supply to Chennai and Kakinada ports.
- BiharPurnia, Katihar, Begusarai — rabi maize for Nepal and Bangladesh.
- Madhya Pradesh, Maharashtra and RajasthanChhindwara, Jalgaon, Bhilwara.
The quality buyers ask for
- Moisture
- Contract maximum, commonly about 14%
- Aflatoxin
- Buyer or destination limit (often 20 ppb for feed)
- Defects
- Broken, damaged and discoloured kernels, foreign matter — maxima in contract
Certificates
- APEDA RCMCRequiredRegistration with APEDA, issued as an RCMC on the DGFT portal; not needed for consignments up to ₹3 lakh FOB since 15 Sep 2026.
- Phytosanitary certificateRequiredIssued by Plant Quarantine (DPPQS) for each consignment after inspection; apply on PQMS.
- Non-GMO test reportOften askedOnly if the buyer asks; from an NABL-accredited lab.
Shipping, storage and shelf life
A 20-ft container typically carries about 25–26 tonnes in bags.
Rail rakes and trucks to Bangladesh and Nepal; containers or bulk from Kakinada, Chennai, Visakhapatnam and Mundra.
Dry before storage; aerated, fumigated warehouses.
What goes on the pack and carton
- Bulk bags and cartons: product and grade, crop year, lot number, net and gross weight, "Product of India", exporter name and the buyer’s shipping marks, matching the invoice and packing list exactly.
Use a laboratory on APEDA’s list of recognised laboratories (apeda.gov.in → Recognised Organisations), an FSSAI-notified lab, or a lab accredited by NABL for the test (nabl-india.org). Ask the buyer which reports they accept before sending samples.
Benefits of exporting this product
- RoDTEP refund on this line
Maize lines under 1005 (seed, yellow, flint, popcorn, other) carry 0.9% of FOB with no cap. Rate as listed in Appendix 4R (w.e.f. 10 Oct 2024); DGFT Notification 41/2026-27 keeps the rates in force on 30 Sep 2026 unchanged until 31 Dec 2026. Check your exact 8-digit line on dgft.gov.in before you price.
DGFT — Appendix 4R, RoDTEP schedule for DTA exports w.e.f. 10 Oct 2024 (Notification No. 32, 30 Sep 2024) ↗ - APEDA support (Bharat Krishi Niryat Yojana)
APEDA’s financial assistance scheme for 2026-27 to 2030-31 helps registered exporters, FPOs and processors with packhouses, cold chain, testing, quality systems and market development. Read the component conditions before you spend.
APEDA — Bharat Krishi Niryat Yojana 2026-27 to 2030-31, operational guidelines (6 Oct 2026) ↗
Where to register
- APEDARegistration-cum-Membership Certificate (RCMC) for APEDA-scheduled products. Apply on the DGFT portal after you have your IEC.dgft.gov.in ↗
- Plant Quarantine (DPPQS)Phytosanitary certificate for each consignment of plant produce, applied for online on PQMS. Some markets also want the packhouse or processing unit registered.pqms.cgg.gov.in ↗
Quality and checks
- A phytosanitary certificate from Plant Quarantine for every consignment; some markets add treatment or pest-free-area conditions — check the importing country’s rules first.
- Moisture, broken and damaged kernels, foreign matter and aflatoxin are the contract specifications feed mills care about most.
- Some buyers ask for a non-GMO test report; arrange it from an NABL laboratory if the contract requires it.
Begin with rail or truck loads to a feed mill in Bangladesh or Nepal through a land port, or containers from Kakinada, Chennai or Mundra to Vietnam. Insist on moisture under the contract limit before loading. Since 15 September 2026, a consignment worth up to ₹3 lakh FOB does not need an RCMC (DGFT Notification 36/2026-27); registrations required by a law still apply.
Where new exporters go wrong
- Aflatoxin from grain dried poorly after the kharif harvest — the most common reason for claims.
- Prices that move with ethanol demand at home; keep validity of offers short.
Documents this product needs
Schemes that apply
Sources (4)
- APEDA — Maize product profile (2025-26 exports and destinations)
- Department of Commerce — TradeStat, India’s exports by commodity and country (2025-26)
- Plant Quarantine (DPPQS) — PQMS portal for phytosanitary certificates
- DGFT Notification 36/2026-27 (15 Sep 2026) — no RCMC needed for consignments up to ₹3 lakh FOB
Trade data
Indian maize (corn) exports in numbers
From the Department of Commerce’s TradeStat, country by country. US$, Indian financial years (April–March).
- Exports in 2025-26
- US$ 375 mn -10.3% a year on average, 2020-21 to 2025-26
- Change from 2024-25
- ↑ +85.4% US$ 202 mn → US$ 375 mn
- Buyer countries
- 52
- Average export price
- US$ 0.29 per kg · 1.28 mn tonnes shipped · US$ 0.36 the year before
The price cycle
India’s average export price per kg each year (total value ÷ total quantity). Highest in 2024-25, lowest in 2020-21 — a 64% swing between them. Keep this swing in mind when you quote.
What next: a projection from the trend
The past trend carried forward — not a forecast by any authority. Sudden changes in policy, prices or demand are not in it.
Likely range US$ 82.1 mn to US$ 398 mn.
- Trend
- -21.6% a year
- Fit (R²)
- 0.49 — weak, read with care
- Based on
- 6 years of official figures
Method: a straight line through the logarithm of yearly exports (log-linear regression); range = ±1 standard error.
Biggest buyer countries
By value in 2025-26. Change is against 2024-25.
Where demand is rising and falling
Only countries that buy at least US$ 1 million or 1% of India’s exports of this product. Change from 2024-25 to 2025-26.
↑ High demand
- VietnamUS$ 2.8 mn → US$ 82.5 mn↑+2,866.5%
- BangladeshUS$ 15.3 mn → US$ 106 mn↑+593.3%
- MalaysiaUS$ 1.2 mn → US$ 7.4 mn↑+529.9%
- United Arab EmiratesUS$ 1.4 mn → US$ 5.3 mn↑+289.8%
- Côte d’IvoireUS$ 2.8 mn → US$ 7.1 mn↑+154.1%
- ThailandUS$ 5.5 mn → US$ 12.5 mn↑+126.4%
- OmanUS$ 4.9 mn → US$ 5.9 mn↑+18.8%
↓ Low demand
New buyers: Countries that bought nothing from India in 2024-25 and did in 2025-26.
- Afghanistan · US$ 1.5 mn
Which forms sell, and at what price
India’s exports by 8-digit tariff line, 2025-26. Average price = total value ÷ total quantity (TradeStat): the average of every shipment on that line, not the price of any one deal.
| Tariff line | Value 2025-26 | Change | Quantity | Average price |
|---|---|---|---|---|
Others-of-other maize (corn)1005 90 90 · Cereals, maize, other than seed | US$ 151 mn | ↑+18.4% | 6,07,317 tonnes | US$ 0.25 per kgwas US$ 0.30 |
Cereals, maize, other than seed — yellow1005 90 11 | US$ 93.5 mn | ↑+230.6% | 3,85,745 tonnes | US$ 0.24 per kgwas US$ 0.31 |
Cereals, maize, seed — maize seed1005 10 00 | US$ 72.2 mn | ↑+84.7% | 32,233 tonnes | US$ 2.24 per kgwas US$ 2.05 |
Others-of-other maize (corn)1005 90 19 · Cereals, maize, other than seed | US$ 58.5 mn | ↑+675.6% | 2,55,336 tonnes | US$ 0.23 per kgwas US$ 0.32 |
Popcorn (zea mays var. everta)1005 90 30 · Cereals, maize, other than seed | US$ 40k | ↓-20% | 32 tonnes | US$ 1.24 per kgwas US$ 1.42 |
Flint corn (zea mays var. indurata)1005 90 20 · Cereals, maize, other than seed | US$ 30k | ↑+200% | 98 tonnes | US$ 0.31 per kgwas US$ 0.29 |
The world market
Each country’s own recorded exports and imports in UN Comtrade, 2023 (the latest year nearly every country has reported).
- World imports
- US$ 61.7 bn 2023
- India among exporters
- #12 of 127 countries
- India’s share of world exports
- 1.3% US$ 701 mn
- Left for others to win
- US$ 52 bn exported by other countries
Top exporters — your competitors
- 1USAUS$ 13.7 bn 26%
- 2BrazilUS$ 13.6 bn 25.9%
- 3ArgentinaUS$ 6.16 bn 11.7%
- 4UkraineUS$ 4.97 bn 9.4%
- 5FranceUS$ 2.03 bn 3.9%
- 6RomaniaUS$ 1.68 bn 3.2%
- 7PolandUS$ 1.3 bn 2.5%
- 8South AfricaUS$ 1.21 bn 2.3%
- 9TürkiyeUS$ 796 mn 1.5%
- 10CanadaUS$ 766 mn 1.5%
Biggest buyers in the world
- 1ChinaUS$ 9.02 bn 14.6%
- 2MexicoUS$ 5.82 bn 9.4%
- 3JapanUS$ 4.92 bn 8%
- 4IranUS$ 3.65 bn 5.9%
- 5Rep. of KoreaUS$ 3.54 bn 5.7%
- 6Viet NamUS$ 2.87 bn 4.6%
- 7SpainUS$ 2.67 bn 4.3%
- 8EgyptUS$ 2.47 bn 4%
- 9ItalyUS$ 1.98 bn 3.2%
- 10ColombiaUS$ 1.86 bn 3%
Opportunity: what these countries buy from the world, and from India
Each country’s own recorded imports in UN Comtrade, latest year it has reported. The long light part of each bar is demand other countries are filling today.
TradeStat’s 2023-24 quantities are double-counted, so that year is left out of the price. Sources: TradeStat — Export Import Data Bank, Department of Commerce · UN Comtrade database (United Nations Statistics Division) · Figures taken 29 October 2026.
Step by step
How to export maize (corn)
India is the world’s fifth-largest maize producer (FAO, 2024, quoted by APEDA) and an important regional supplier of feed maize to Bangladesh, Nepal, Vietnam and Sri Lanka. The USA, Brazil, Argentina and Ukraine dominate the world market. Rising domestic use for ethanol has tightened supply and raised prices at home. India’s edge is short freight to South and South-East Asia and round-the-year availability from two seasons.
- 01Register
Get your IEC and APEDA RCMC.
- 02Buy dried grain
Buy after harvest in Karnataka, Telangana or Bihar; check moisture and aflatoxin before paying.
- 03Clean and bag
Clean, dry if needed and bag; sample for the buyer’s specification.
- 04Inspection and phytosanitary certificate
Apply on PQMS; Plant Quarantine inspects the lot (and fumigation or treatment if the importing country requires it) before issuing the certificate.
- 05Agree specification, price and payment
Put grade, tests, packing, Incoterm (FOB or CIF), shipment period and payment (advance, LC or documents against payment) in a written contract. Cover the buyer with ECGC if you give credit.
- 06File the shipping bill and ship
Your customs broker files the shipping bill on ICEGATE with the invoice and packing list. After customs clearance the line issues the bill of lading; get the certificate of origin from the right agency if the buyer needs a trade-agreement rate.
- 07Get paid and close the file
Send original documents through your bank (or to the buyer if paid in advance). When the money arrives, get the e-BRC and claim RoDTEP and drawback where they apply.
Meet buyers
Trade fairs
Questions
Questions about exporting maize (corn)
Who buys Indian maize?
Is maize export restricted?
What causes most claims?
Do I need an RCMC for a small trial shipment?
What RoDTEP does maize get?
Sources (4)
- APEDA — Maize product profile (2025-26 exports and destinations)
- Department of Commerce — TradeStat, India’s exports by commodity and country (2025-26)
- DGFT — Appendix 4R, RoDTEP schedule for DTA exports w.e.f. 10 Oct 2024 (Notification No. 32, 30 Sep 2024)
- Plant Quarantine (DPPQS) — PQMS portal for phytosanitary certificates
Who buys Indian maize (corn)
All countries → SAFTABDTDhakaBangladeshBig neighbour market for cotton, yarn, food and machinery. Mostly LC-based; land and sea routes.From India 2025-26US$ 10.6 bn
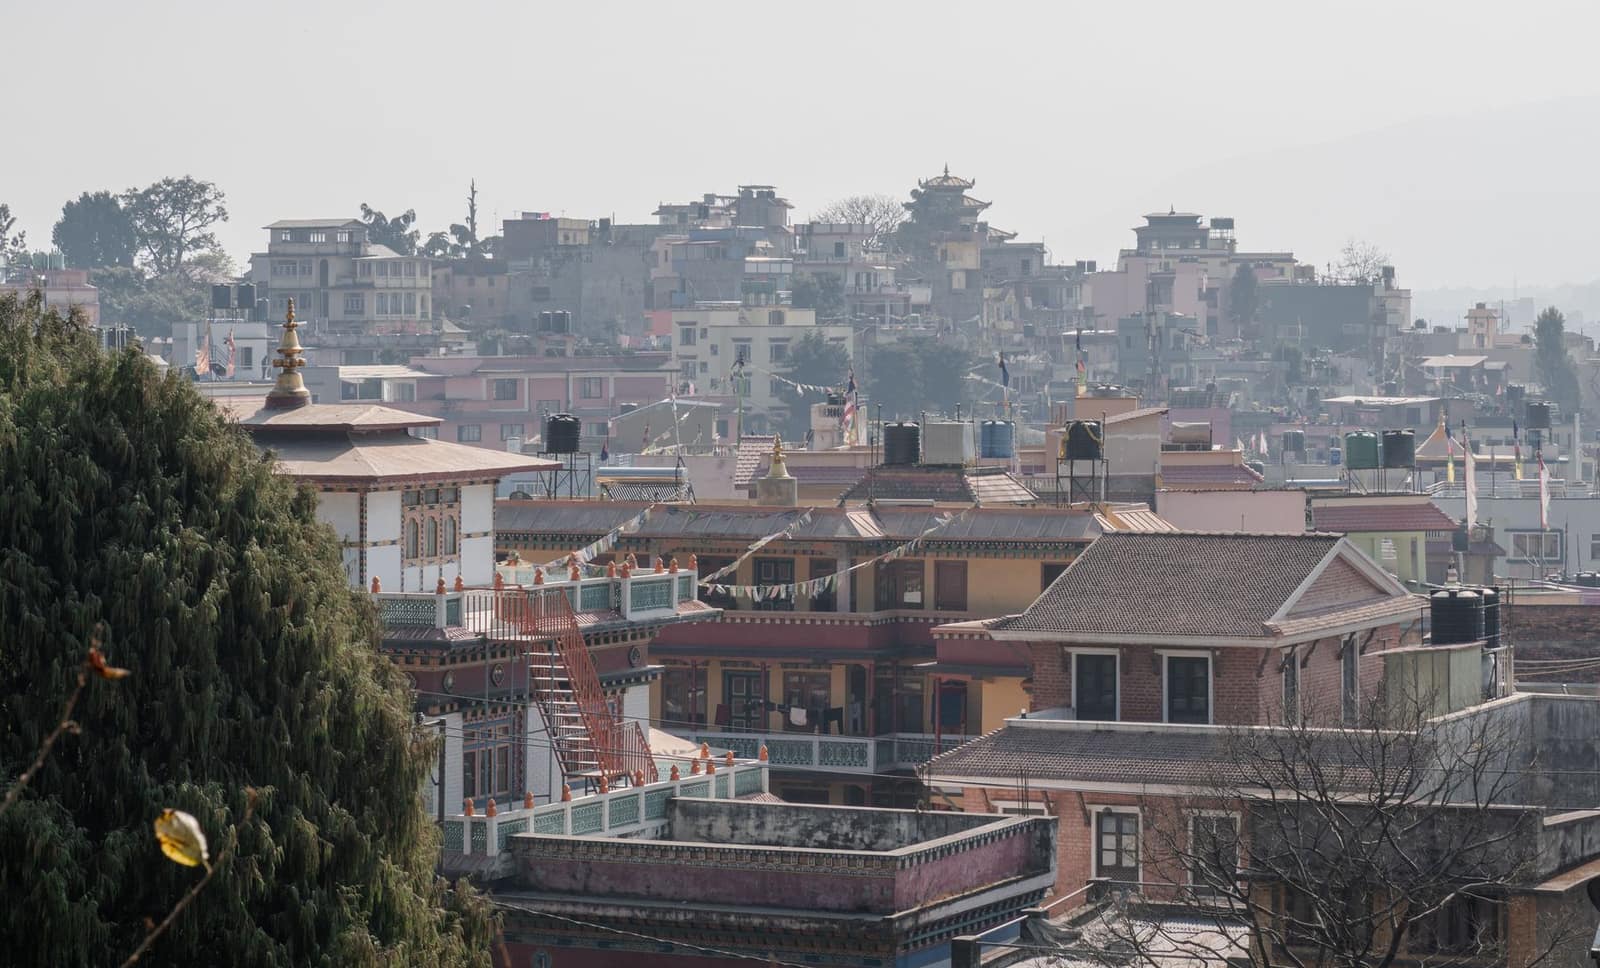 SAFTANPRKathmanduNepalOpen land border, rupee payments and a market that relies on Indian goods — an easy first market by road.From India 2025-26US$ 7.45 bn
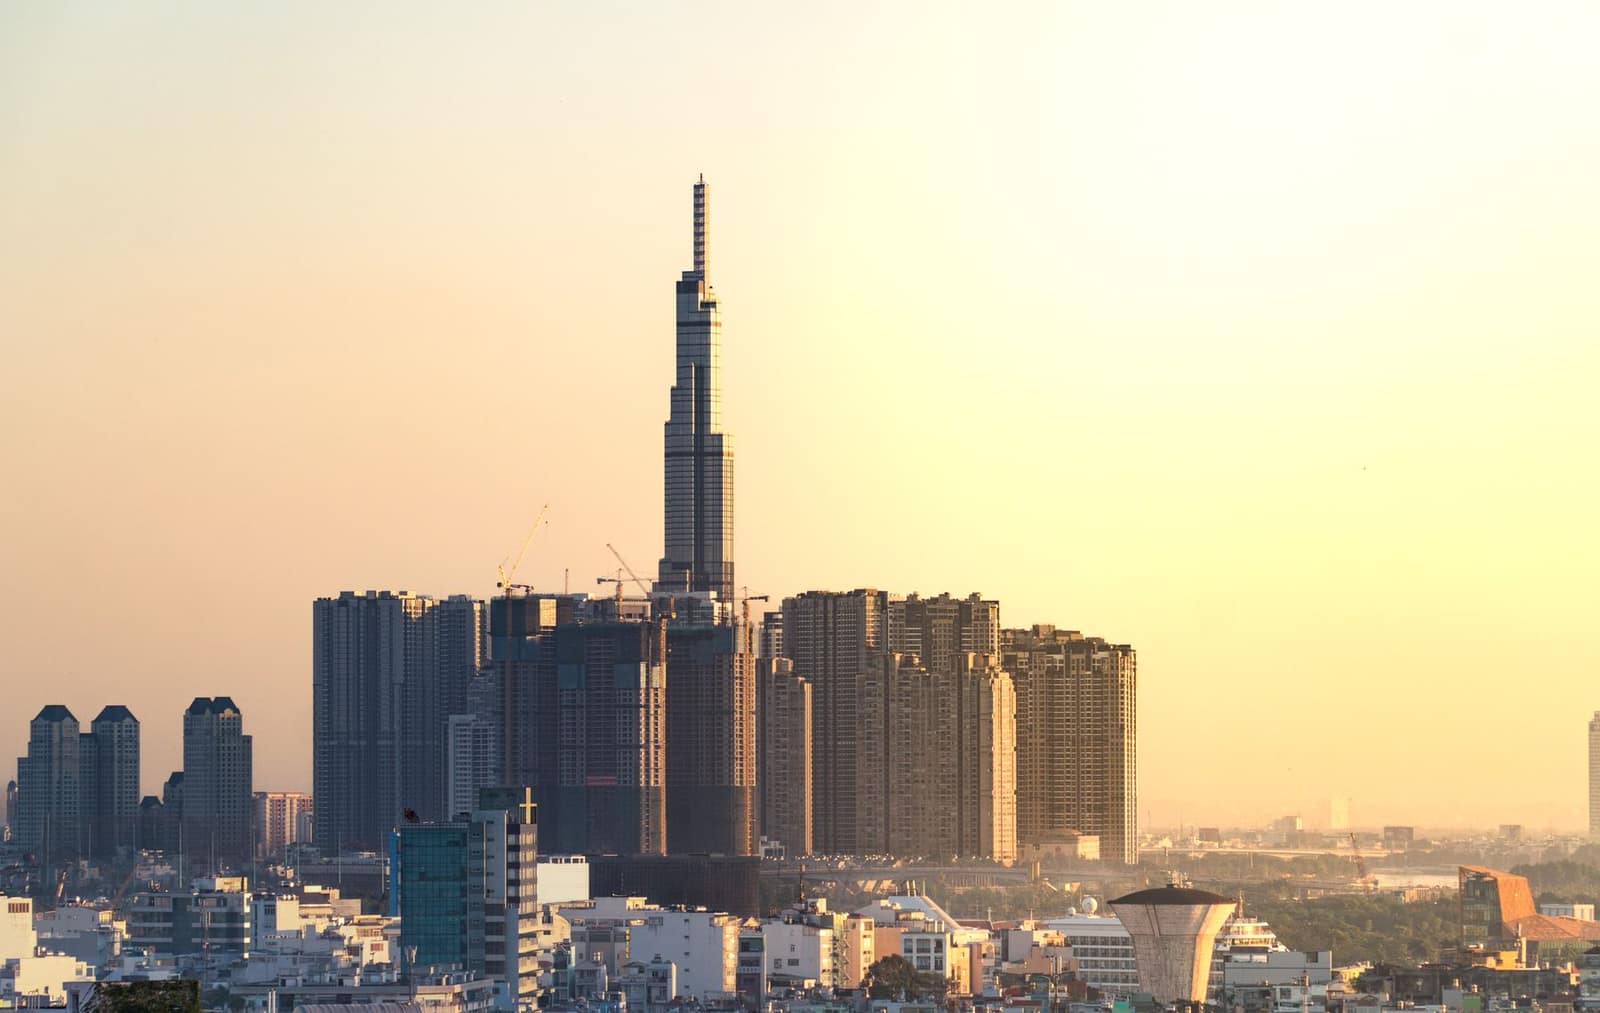 AITIGAVNDHanoiVietnamFast-growing manufacturing economy buying raw materials, yarn, steel, chemicals and feed ingredients from India.From India 2025-26US$ 6.67 bn
 ISFTALKRSri Jayawardenepura Kotte (Colombo is the commercial capital)Sri LankaClose island market with India's oldest FTA. Buys food, medicines, vehicles, yarn and building materials.From India 2025-26US$ 5.52 bn
 SAFTABTNThimphuBhutanDuty-free, rupee-based neighbour market reached by road from West Bengal and Assam.From India 2025-26US$ 1.25 bn
 CECAMYRKuala LumpurMalaysiaMulti-ethnic market with a large Indian-origin community. Halal expectations for food; CECA and AITIGA both apply.From India 2025-26US$ 6.83 bn
 CEPAOMRMuscatOmanNew CEPA in force since June 2026 — almost all Indian goods now enter duty-free. Short sea route from Gujarat.From India 2025-26US$ 4.02 bn
 CEPAAEDAbu DhabiUnited Arab EmiratesIndia's biggest Gulf buyer and a re-export hub for the Middle East and Africa. CEPA in force since 2022.From India 2025-26US$ 37.4 bn
More in farm produce
All products →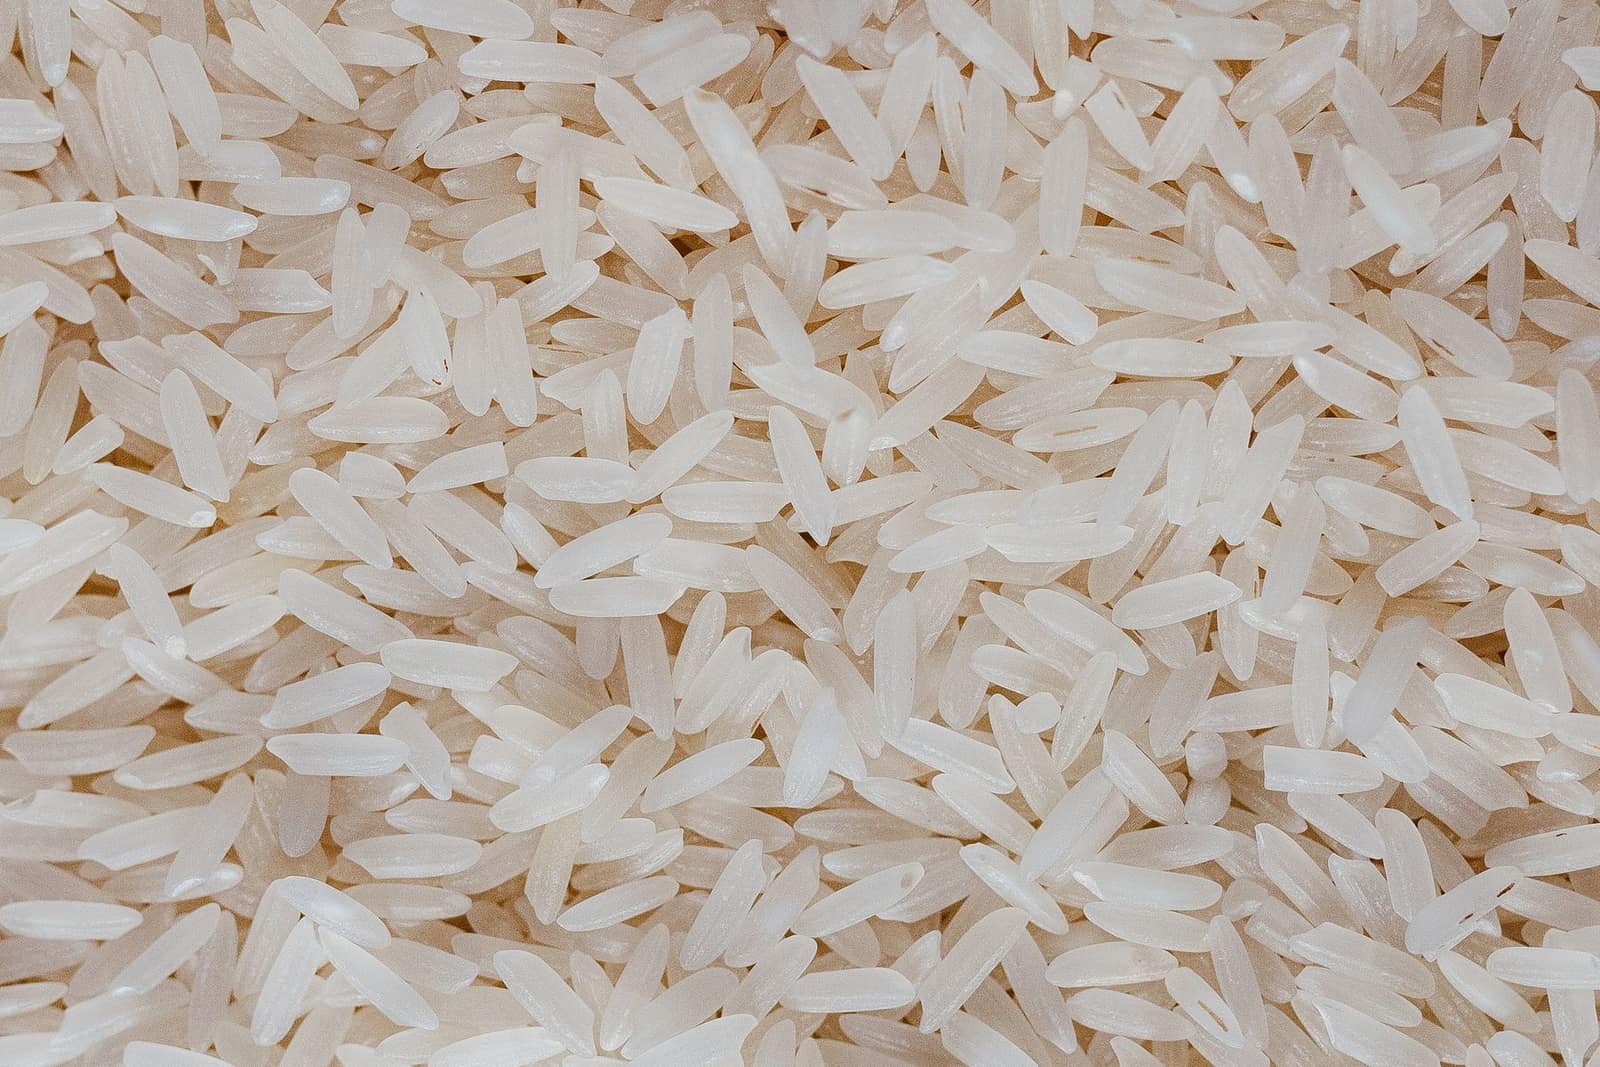 Free, with conditionsFarm produceBasmati riceIndia’s top agri export by value. Free to export, but every contract must be registered with APEDA first.HS1006.30Exports 2025-26US$ 5.67 bn ↓4.6%
 Free, with conditionsFarm produceNon-basmati riceHigh-volume staple sold mainly to Africa and Bangladesh. Export reopened in 2024–25, but contracts must now be registered with APEDA.HS1006.30Exports 2025-26US$ 5.86 bn ↓10.2%
 Free to exportFarm produceSpicesWhole, ground and blended spices. Spices Board registration (CRES) is compulsory; residue and ethylene oxide tests keep buyers.HS0904–0910Exports 2025-26US$ 3.12 bn ↓5.1%
 Free to exportFarm produceChilliIndia’s largest spice export by volume. Dried red chilli goes to China, Thailand and Bangladesh; aflatoxin is the key test.HS0904.21Exports 2025-26US$ 1.1 bn ↓12.9%