


Gulf & Middle East
Export to Yemen
Conflict-affected market that imports most of its food. Sanctions, Red Sea shipping risk and payment checks come first.
- Capital
- Sana’a (government based in Aden)
- Currency
- YER
- Trade agreement with India
- None
- Main ports
- Aden, Hodeidah, Mukalla
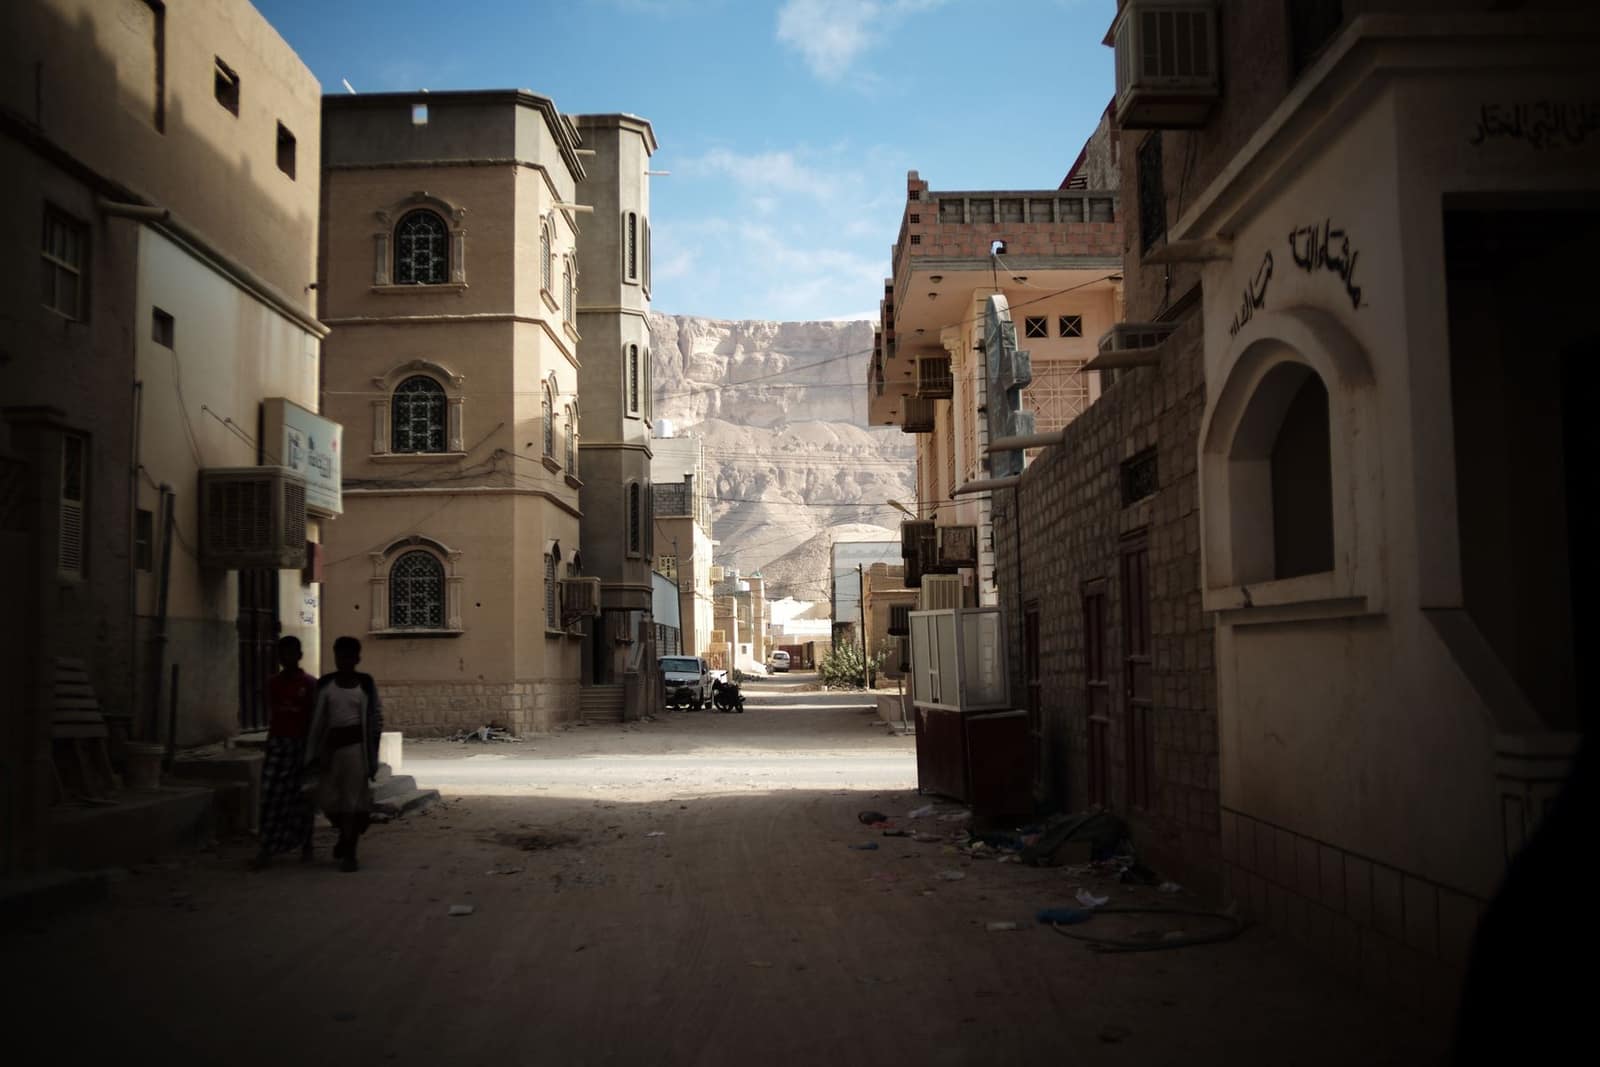
Yemen depends on imports for most of its food and medicines, and Indian rice, sugar and medicines have long been part of that supply. The country has been in conflict for years, control is split between authorities, and shipping in the Red Sea has faced attacks. This is not a market for a first shipment unless the buyer, bank and shipping line are all experienced with Yemen.
What it buys from India
- Rice, sugar, wheat flour and other staple foods
- Medicines
- Garments and household goods
Import rules on their side
- Commercial cargo going to ports controlled by the Sana’a-based authorities (such as Hodeidah) has been cleared through the UN Verification and Inspection Mechanism (UNVIM); your buyer or shipping line handles the application.
- Food labels need Arabic, with production and expiry dates; medicines need registration through the local importer.
- Expect certificates of origin, health or phytosanitary certificates and a full set of documents legalised as the buyer asks.
Practical tips
- UN Security Council sanctions (resolution 2140) and US sanctions apply to named persons and groups in Yemen, including the Houthis (Ansarallah). Screen every party, and get your bank to approve the deal before shipping.
- Insist on full advance payment or an LC confirmed by a bank outside Yemen. Check ECGC’s country cover before giving any credit.
- Red Sea shipping has faced attacks; war-risk insurance and freight can change quickly. Confirm the route and insurance with your shipping line for each shipment.
Sources (6)
- UN Security Council — Sanctions Committee established pursuant to resolution 2140 (Yemen)
- US Treasury OFAC — Yemen-related sanctions
- UN Verification and Inspection Mechanism for Yemen (UNVIM)
- ECGC Ltd — export credit insurance and country risk
- Ministry of External Affairs — travel and country advisories
- Department of Commerce — TradeStat export-import data bank
Trade data
India’s exports to Yemen in numbers
From the Department of Commerce’s TradeStat (Indian financial years, April–March), the country’s imports from the world from UN Comtrade, and its basics from the World Bank.
- India’s exports here, 2025-26
- US$ 806 mn No. 68 of our 80 countries
- Change from 2024-25
- ↓ -5.8% US$ 856 mn → US$ 806 mn
- Share of all Indian exports
- 0.18%
- Its imports from the world
- US$ 3.13 bn 2024 · India’s share 10.52%
What India sells here most
By HS chapter, 2025-26. Change is against 2024-25.
What is rising and what is falling
Chapters where India sells at least US$ 5 million. Change from 2024-25 to 2025-26.
↑ High demand
- RubberUS$ 2.9 mn → US$ 6.8 mn↑+136%
- FootwearUS$ 7.5 mn → US$ 9.6 mn↑+28%
- Instruments, medical devicesUS$ 4.9 mn → US$ 6.1 mn↑+23.8%
- Knitted garmentsUS$ 16.4 mn → US$ 19.6 mn↑+19.2%
- Coffee, tea, spicesUS$ 14.6 mn → US$ 16.4 mn↑+12.9%
- Bakery and cereal foodsUS$ 14.9 mn → US$ 16.7 mn↑+12.5%
↓ Low demand
- Paper and paperboardUS$ 12.6 mn → US$ 8 mn↓-36.4%
- MachineryUS$ 18.2 mn → US$ 14 mn↓-22.8%
- Medicines and pharmaUS$ 83.7 mn → US$ 67.4 mn↓-19.5%
- Organic chemicalsUS$ 8.7 mn → US$ 7.4 mn↓-15.1%
Opportunity: what this country buys from the world, and from India
The country’s own recorded imports in UN Comtrade, 2024. Chapters with the biggest gap between what it buys from the world and what it buys from India.
Our product guides that sell here
India’s exports of each product to this country, 2025-26.
The 20 biggest export lines
4-digit HS lines, 2025-26, with their Harmonized System descriptions.
What India buys from Yemen
India’s imports from this country in 2025-26 by HS chapter, from TradeStat — this country can be your supplier too.
- India’s imports, 2025-26
- US$ 106 mn US$ 155 mn → US$ 106 mn
- India’s exports, 2025-26
- US$ 806 mn
- Trade balance
- +US$ 700 mn exports minus imports
- Change in imports
- -31.8%
The country at a glance
- Population
- 41.8 mn 2025
- GDP
- US$ 21.6 bn 2018
- GDP per person
- US$ 634 2018
- Imports (goods and services)
- US$ 10.2 bn 2018
Sources: TradeStat — Export Import Data Bank, Department of Commerce · UN Comtrade database (United Nations Statistics Division) · World Bank — World Development Indicators · Figures taken 29 October 2026.
What to send to Yemen
All products → Free, with conditionsFarm produceNon-basmati riceHigh-volume staple sold mainly to Africa and Bangladesh. Export reopened in 2024–25, but contracts must now be registered with APEDA.HS1006.30Exports 2025-26US$ 5.86 bn ↓10.2%
 Free, with conditionsFarm produceBasmati riceIndia’s top agri export by value. Free to export, but every contract must be registered with APEDA first.HS1006.30Exports 2025-26US$ 5.67 bn ↓4.6%
 Restricted — licence neededProcessed foodSugarRestricted: exported only under quotas the Food Ministry gives to sugar mills each season. Organic sugar has a separate 50,000 MT yearly ceiling.HS1701Exports 2025-26US$ 2.04 bn ↓3.5%
 Free to exportFarm produceSpicesWhole, ground and blended spices. Spices Board registration (CRES) is compulsory; residue and ethylene oxide tests keep buyers.HS0904–0910Exports 2025-26US$ 3.12 bn ↓5.1%
 Free to exportPharma & chemicalsGeneric medicines (formulations)Tablets, capsules and injectables; every market needs product registration. The USA buys the most.HS3004Exports 2025-26US$ 21.9 bn ↓0.7%
More in Gulf & Middle East
 CEPAAEDAbu DhabiUnited Arab EmiratesIndia's biggest Gulf buyer and a re-export hub for the Middle East and Africa. CEPA in force since 2022.From India 2025-26US$ 37.4 bn
 SARRiyadhSaudi ArabiaLarge Gulf market for rice, food and engineering goods. Strict SFDA food rules and SABER certification for regulated goods.From India 2025-26US$ 10.3 bn
 CEPAOMRMuscatOmanNew CEPA in force since June 2026 — almost all Indian goods now enter duty-free. Short sea route from Gujarat.From India 2025-26US$ 4.02 bn
 QARDohaQatarSmall, wealthy Gulf market with a huge Indian workforce. Imports nearly all its food.From India 2025-26US$ 1.62 bn