


South Asia
Export to Bhutan
Duty-free, rupee-based neighbour market reached by road from West Bengal and Assam.
- Capital
- Thimphu
- Currency
- BTN
- Trade agreement with India
- India–Bhutan Agreement on Trade, Commerce and Transit; also SAFTA In force (free trade regime)
- Main ports
- Phuentsholing (opposite Jaigaon, West Bengal), Gelephu, Samdrup Jongkhar (opposite Darranga, Assam)
Bhutan buys most of its imports from India — fuel, rice, food, vehicles, machinery, building materials and consumer goods. There is no customs duty and payment is in rupees, so it is a simple market for small exporters in the North-East and North Bengal. Goods mostly cross by road at Jaigaon–Phuentsholing.
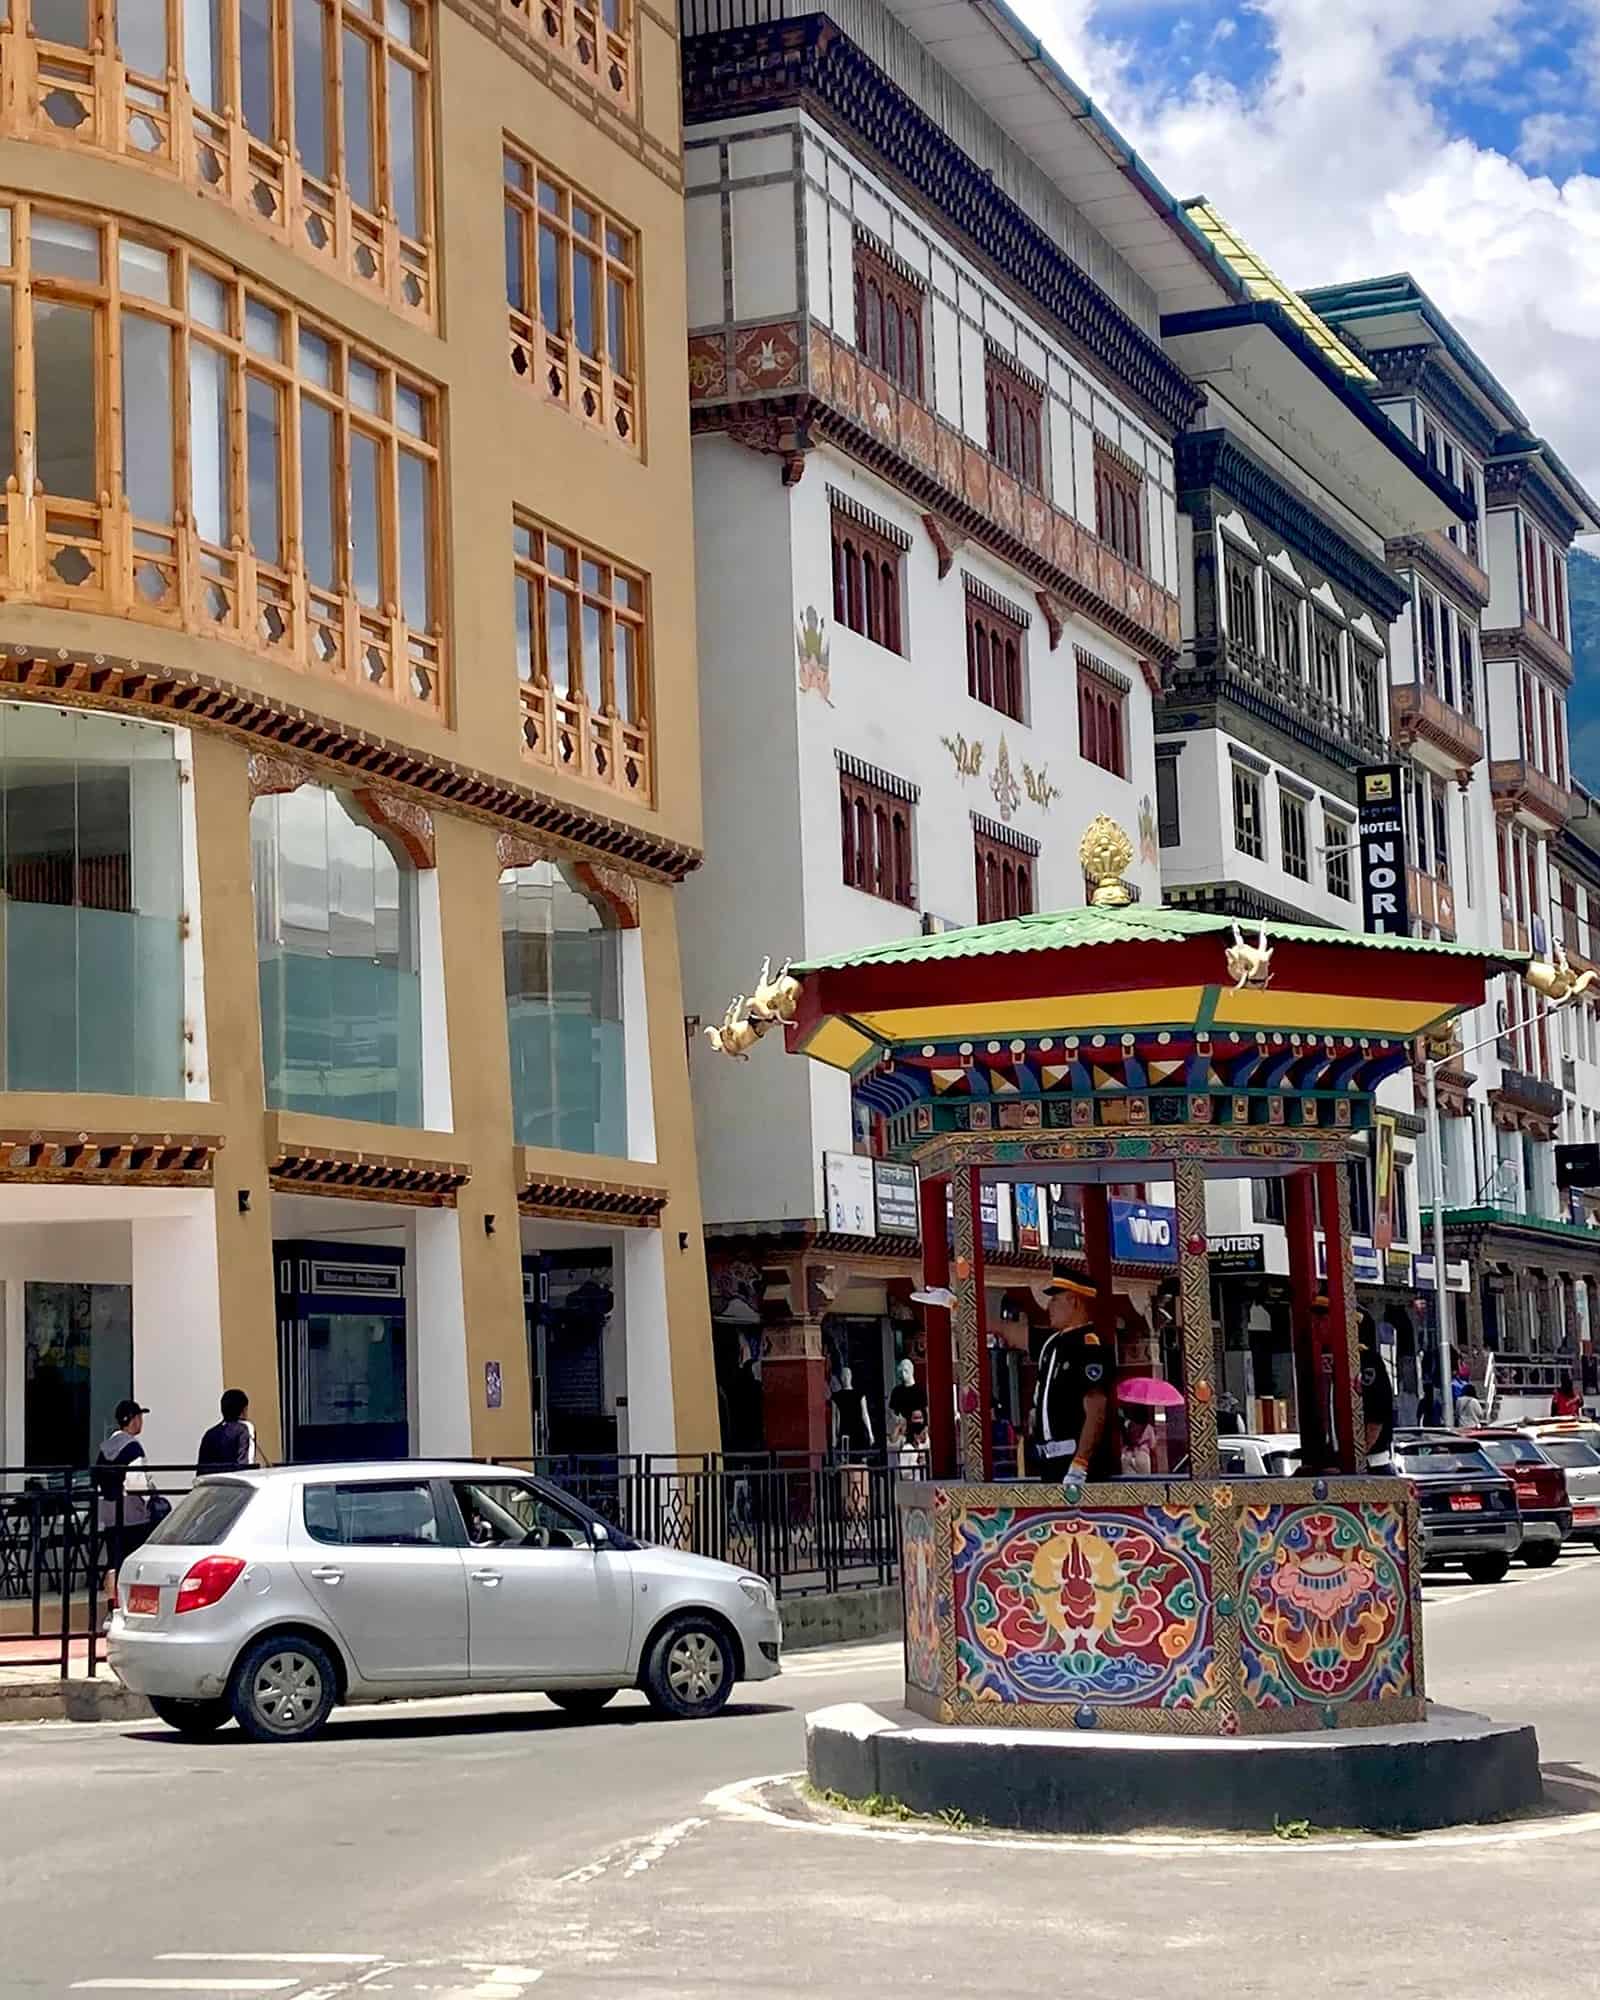
The agreement provides free trade between the two countries: no basic customs duty is charged on goods going to or coming from Bhutan, and trade is carried out in Indian rupees and Bhutanese ngultrum (Department of Commerce Annual Report 2024-25).
What it buys from India
- Petroleum products and electricity-sector equipment
- Rice, food and processed food
- Vehicles, machinery and building materials
- Medicines and consumer goods
Import rules on their side
- Food, plants and animal products are checked at the border by the Bhutan Food and Drug Authority (formerly BAFRA).
- Bhutan does not charge basic customs duty on Indian goods, but sales tax and other domestic levies may apply; the importer handles these.
- Bhutan sometimes restricts imports of certain goods (for example vehicles) to manage its foreign-currency position; check with the buyer.
Practical tips
- Still file a shipping bill and get paid through a bank so your export counts and you can claim export benefits.
- Government agencies and hydropower projects are big buyers; watch Bhutanese government tenders.
- Mountain roads close during heavy monsoon rain; build in extra transit time from June to September.
Trade data
India’s exports to Bhutan in numbers
From the Department of Commerce’s TradeStat (Indian financial years, April–March), the country’s imports from the world from UN Comtrade, and its basics from the World Bank.
- India’s exports here, 2025-26
- US$ 1.25 bn No. 29 of our 30 countries
- Change from 2024-25
- ↓ -0.9% US$ 1.26 bn → US$ 1.25 bn
- Share of all Indian exports
- 0.28%
- Its imports from the world
- US$ 1.57 bn 2022 · India’s share 71.39%
What India sells here most
By HS chapter, 2025-26. Change is against 2024-25.
What is rising and what is falling
Chapters where India sells at least US$ 5 million. Change from 2024-25 to 2025-26.
↑ High demand
- Flour, malt, starchUS$ 5.2 mn → US$ 7.4 mn↑+41%
- Vehicles and partsUS$ 55.6 mn → US$ 74.8 mn↑+34.5%
- Other chemical productsUS$ 12.7 mn → US$ 16.5 mn↑+30.5%
- MeatUS$ 9.4 mn → US$ 12.2 mn↑+29.8%
- MachineryUS$ 99.2 mn → US$ 121 mn↑+21.5%
- Fuels and petroleum productsUS$ 279 mn → US$ 336 mn↑+20.6%
- Animal feed and food residuesUS$ 11.5 mn → US$ 13.7 mn↑+19.4%
- Salt, stone, cementUS$ 11.8 mn → US$ 13.7 mn↑+16.6%
↓ Low demand
- TobaccoUS$ 12.4 mn → US$ 8 mn↓-35.2%
- Electrical and electronicsUS$ 132 mn → US$ 86.2 mn↓-34.6%
- VegetablesUS$ 12.8 mn → US$ 10.1 mn↓-21.3%
- Other food preparationsUS$ 15.7 mn → US$ 12.4 mn↓-21.2%
- Iron and steel articlesUS$ 50.2 mn → US$ 41.5 mn↓-17.4%
Opportunity: what this country buys from the world, and from India
The country’s own recorded imports in UN Comtrade, 2022. Chapters with the biggest gap between what it buys from the world and what it buys from India.
Our product guides that sell here
India’s exports of each product to this country, 2025-26.
The 20 biggest export lines
4-digit HS lines, 2025-26, with their Harmonized System descriptions.
What India buys from Bhutan
India’s imports from this country in 2025-26 by HS chapter, from TradeStat — this country can be your supplier too.
- India’s imports, 2025-26
- US$ 821 mn US$ 642 mn → US$ 821 mn
- India’s exports, 2025-26
- US$ 1.25 bn
- Trade balance
- +US$ 432 mn exports minus imports
- Change in imports
- +27.9%
The country at a glance
- Population
- 797k 2025
- GDP
- US$ 3.58 bn 2025
- GDP per person
- US$ 4,493 2025
- Imports (goods and services)
- US$ 1.6 bn 2024
Sources: TradeStat — Export Import Data Bank, Department of Commerce · UN Comtrade database (United Nations Statistics Division) · World Bank — World Development Indicators · Figures taken 29 October 2026.
What to send to Bhutan
All products → Free, with conditionsFarm produceNon-basmati riceHigh-volume staple sold mainly to Africa and Bangladesh. Export reopened in 2024–25, but contracts must now be registered with APEDA.HS1006.30Exports 2025-26US$ 5.86 bn ↓10.2%
 Free to exportProcessed foodProcessed foodSnacks, pickles, ready-to-eat meals, sauces, biscuits and mixes. FSSAI licence plus the buyer country’s labelling and registration rules.HS19–21Exports 2025-26US$ 4.19 bn ↑8.9%
 Free to exportFarm produceFresh vegetablesOkra, green chilli, drumstick, gourds and potatoes for Gulf and UK ethnic markets. Fast, perishable and residue-sensitive.HS07Exports 2025-26US$ 2.26 bn ↑3%
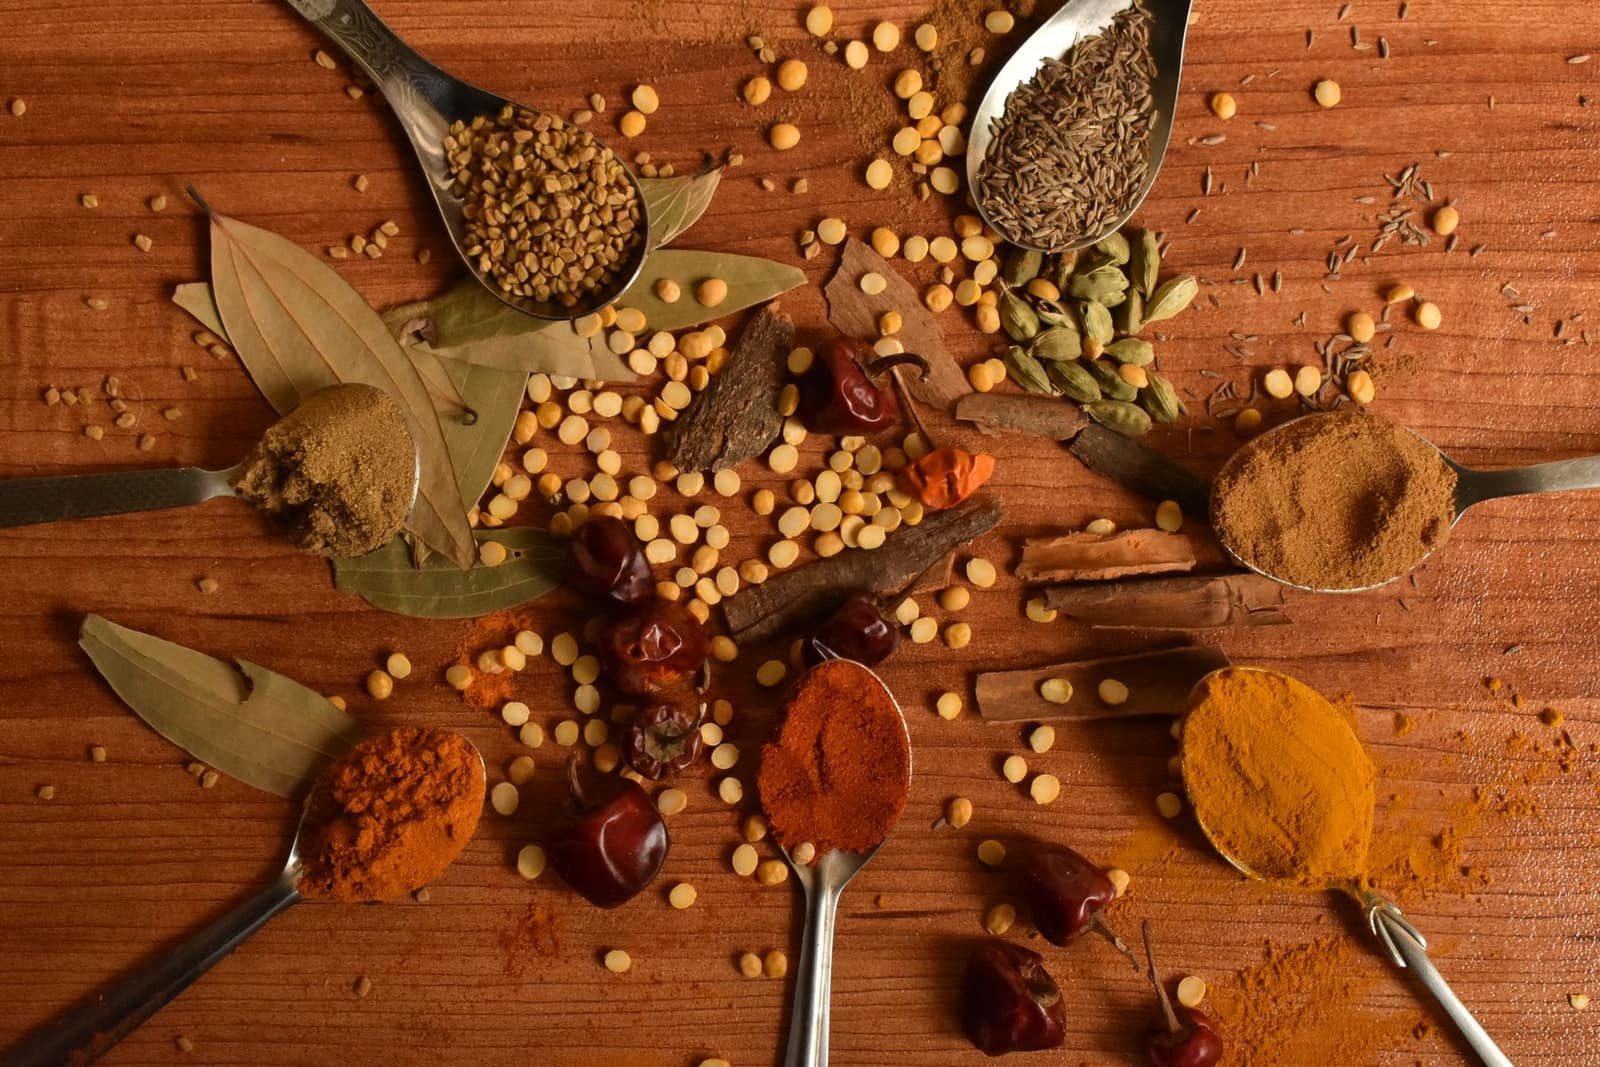 Free to exportFarm produceSpicesWhole, ground and blended spices. Spices Board registration (CRES) is compulsory; residue and ethylene oxide tests keep buyers.HS0904–0910Exports 2025-26US$ 3.12 bn ↓5.1%
 Free to exportPharma & chemicalsGeneric medicines (formulations)Tablets, capsules and injectables; every market needs product registration. The USA buys the most.HS3004Exports 2025-26US$ 21.9 bn ↓0.7%
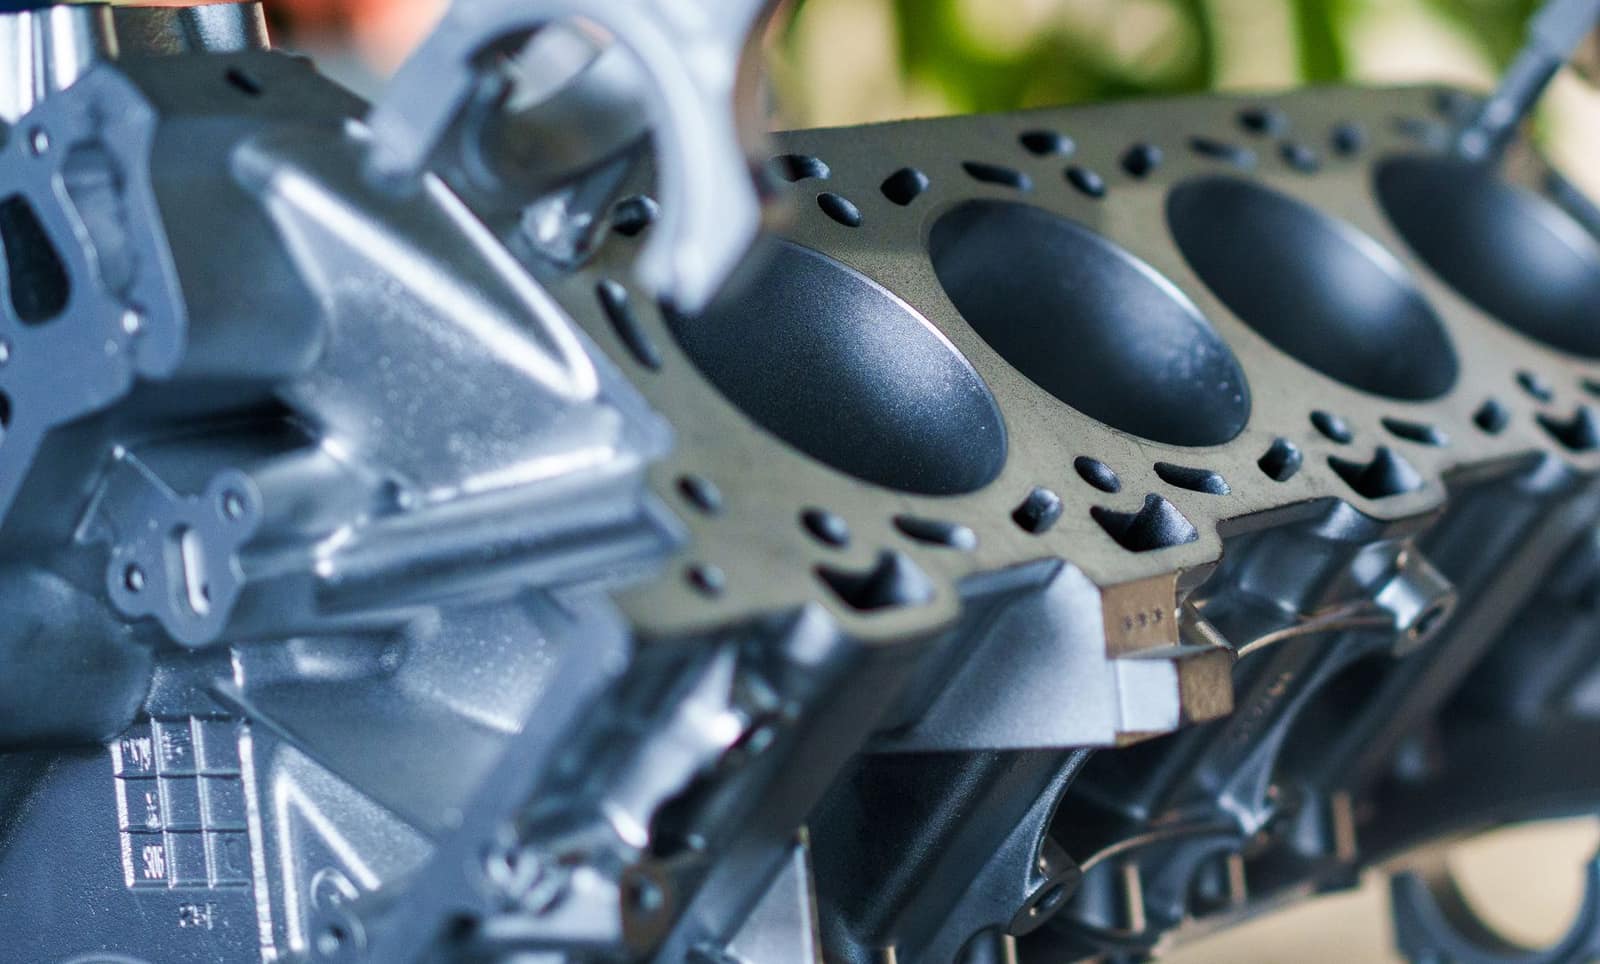 Free to exportEngineering goodsAuto parts and componentsOEM and aftermarket vehicle parts; the USA, Germany and Italy buy most, with strong demand in Latin America.HS8708Exports 2025-26US$ 7.64 bn ↑1.8%
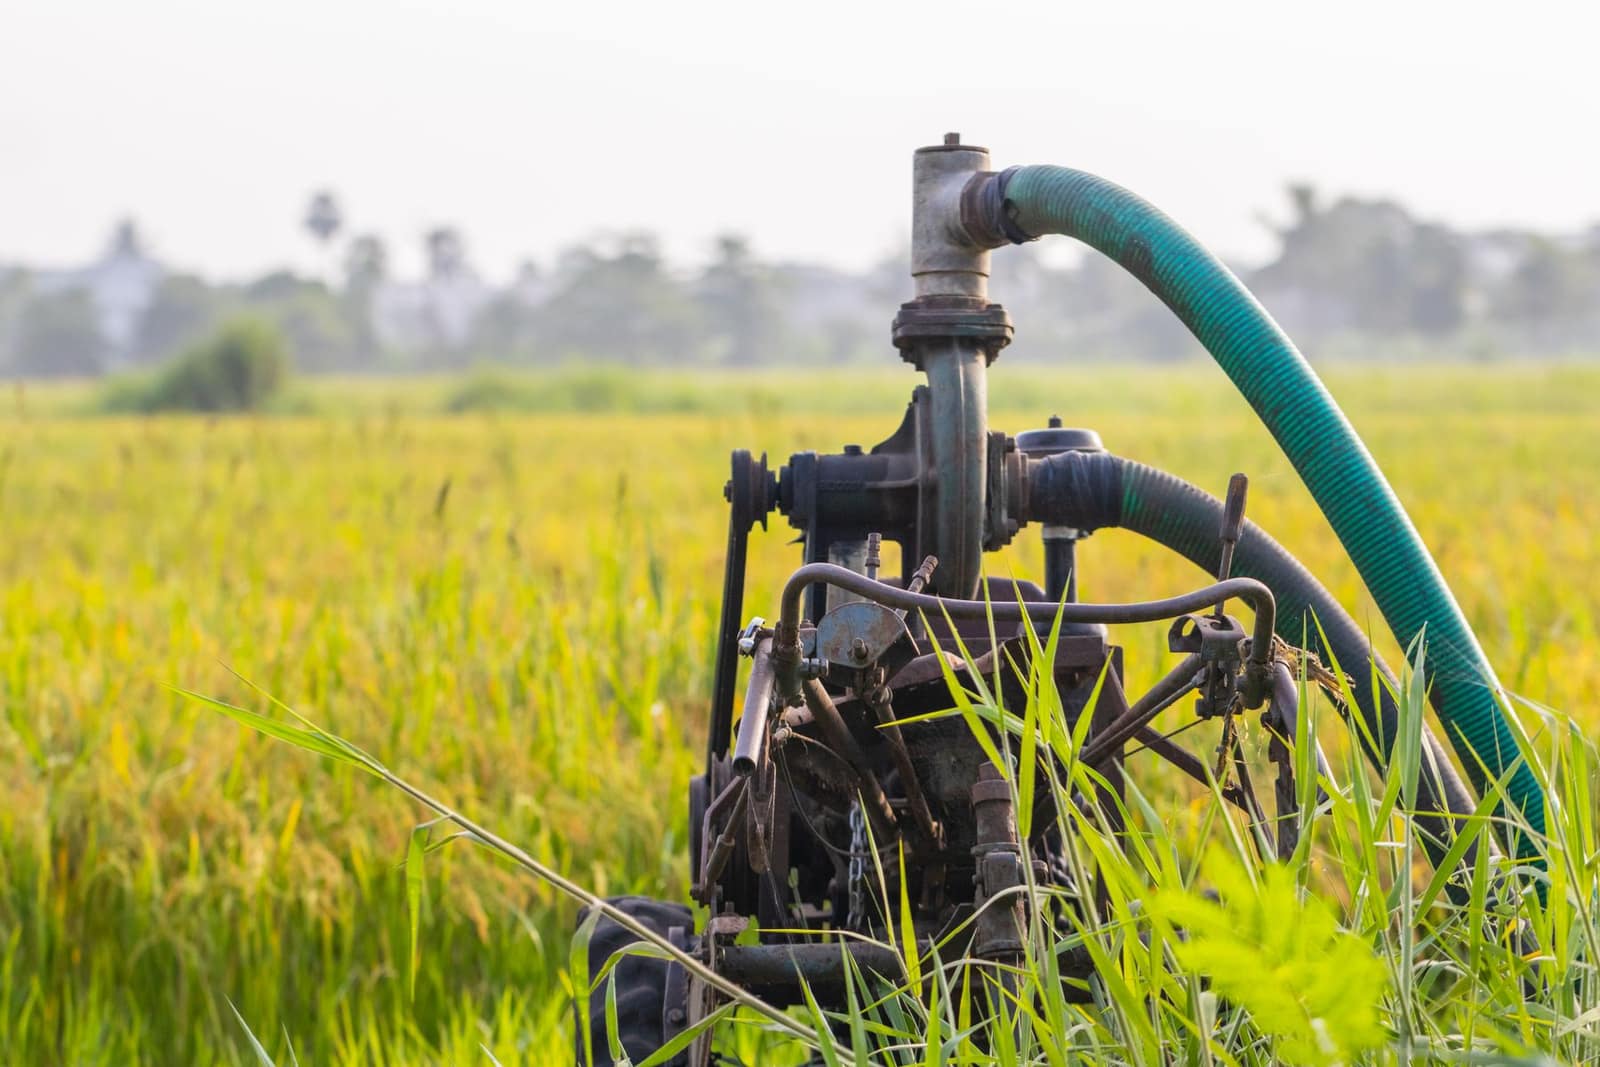 Free to exportEngineering goodsPumpsAgricultural, domestic and industrial pumps from Coimbatore, Rajkot and Ahmedabad; the USA leads.HS8413Exports 2025-26US$ 1.6 bn ↑5.2%
 Free to exportOther goodsPlastic goods and packagingWoven sacks, FIBC bags, containers and household plastics; the USA leads, then the UAE and UK.HS3923Exports 2025-26US$ 1.21 bn ↑3.3%
More in South Asia
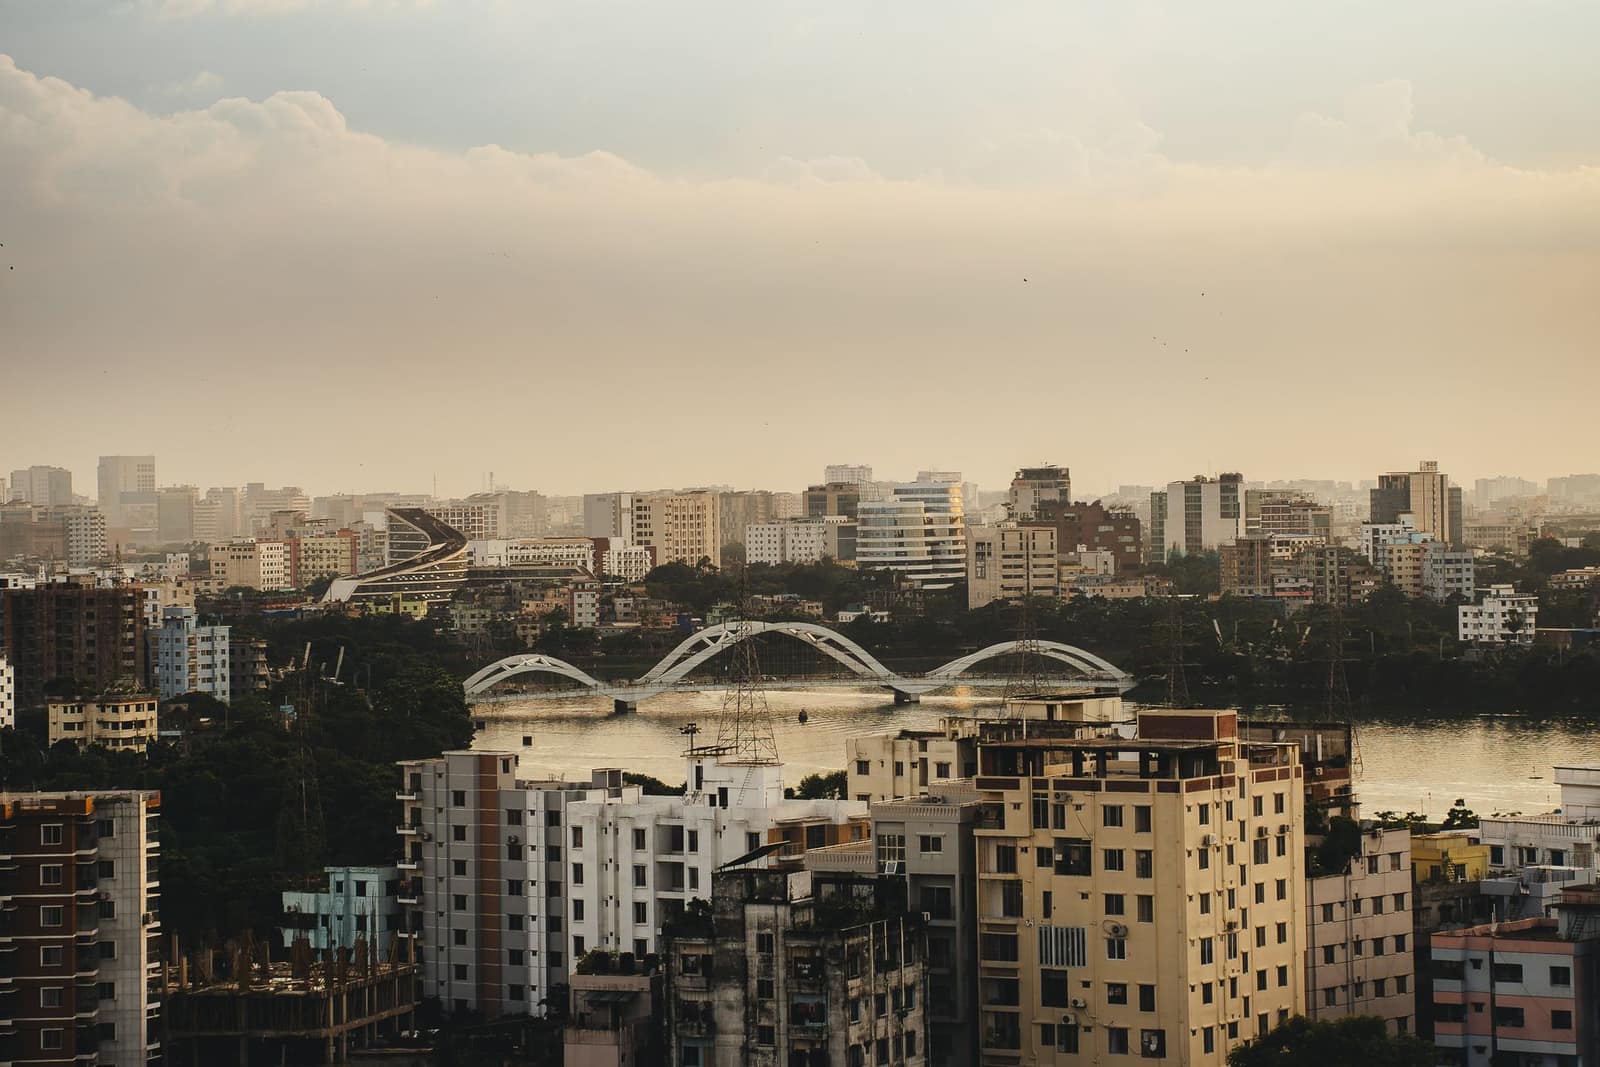 SAFTABDTDhakaBangladeshBig neighbour market for cotton, yarn, food and machinery. Mostly LC-based; land and sea routes.From India 2025-26US$ 10.6 bn
 SAFTANPRKathmanduNepalOpen land border, rupee payments and a market that relies on Indian goods — an easy first market by road.From India 2025-26US$ 7.45 bn
 ISFTALKRSri Jayawardenepura Kotte (Colombo is the commercial capital)Sri LankaClose island market with India's oldest FTA. Buys food, medicines, vehicles, yarn and building materials.From India 2025-26US$ 5.52 bn