


South Asia
Export to Nepal
Open land border, rupee payments and a market that relies on Indian goods — an easy first market by road.
- Capital
- Kathmandu
- Currency
- NPR
- Trade agreement with India
- India–Nepal Treaty of Trade (with Treaty of Transit); also SAFTA 1991 (revised; Treaty of Transit revised 1 June 2023)
- Main ports
- Birgunj (opposite Raxaul, Bihar) and Birgunj ICD dry port, Biratnagar (opposite Jogbani, Bihar), Bhairahawa (opposite Sunauli, UP)
Nepal buys a large share of its everyday goods from India — food, fuel, medicines, vehicles, building material and consumer goods. Goods go by truck through border points such as Raxaul–Birgunj or by rail to the Birgunj dry port. Because payment can be in Indian rupees and the language and business customs are familiar, it suits small first-time exporters from UP, Bihar and West Bengal.

Trade is governed by the India–Nepal Treaty of Trade, and Nepal is also a SAFTA member. Nepal applies its own customs duties on Indian goods, so check the Nepal customs tariff for your product. Trade can be settled in Indian rupees. Confirm current terms on commerce.gov.in.
What it buys from India
- Petroleum products, iron and steel
- Rice, vegetables, spices and processed food
- Vehicles, auto parts, machinery and electrical goods
- Medicines, cement, garments and plastic goods
Import rules on their side
- Nepal customs charges import duty and VAT at the border; clearance is through the importer's customs agent at the Nepal side.
- Food, plants and plant products need an Indian phytosanitary or health certificate and pass Nepal's quarantine and food-quality checks at the border.
- Medicines must be registered with Nepal's drug regulator before they can be sold there.
Practical tips
- Even in rupee trade, follow the normal export process — shipping bill, invoice and bank-routed payment — so your export is recorded and you can claim benefits.
- Work with a reliable clearing agent on both sides of the border; a missing document can hold trucks for days.
- Nepal sometimes restricts imports of certain goods to save foreign exchange; check with the buyer before producing a large order.
Trade data
India’s exports to Nepal in numbers
From the Department of Commerce’s TradeStat (Indian financial years, April–March), the country’s imports from the world from UN Comtrade, and its basics from the World Bank.
- India’s exports here, 2025-26
- US$ 7.45 bn No. 11 of our 30 countries
- Change from 2024-25
- ↑ +0.8% US$ 7.39 bn → US$ 7.45 bn
- Share of all Indian exports
- 1.69%
- Its imports from the world
- —
What India sells here most
By HS chapter, 2025-26. Change is against 2024-25.
What is rising and what is falling
Chapters where India sells at least US$ 5 million. Change from 2024-25 to 2025-26.
↑ High demand
- CopperUS$ 39.8 mn → US$ 64.4 mn↑+61.6%
- Vehicles and partsUS$ 378 mn → US$ 512 mn↑+35.3%
- Oilseeds and seedsUS$ 36.3 mn → US$ 47 mn↑+29.7%
- VegetablesUS$ 97.1 mn → US$ 117 mn↑+20%
- Salt, stone, cementUS$ 37.9 mn → US$ 43.8 mn↑+15.5%
- MachineryUS$ 458 mn → US$ 528 mn↑+15.3%
- Woven garmentsUS$ 34.5 mn → US$ 38.1 mn↑+10.3%
↓ Low demand
No sizeable chapter falls in this list this year.
Our product guides that sell here
India’s exports of each product to this country, 2025-26.
The 20 biggest export lines
4-digit HS lines, 2025-26, with their Harmonized System descriptions.
What India buys from Nepal
India’s imports from this country in 2025-26 by HS chapter, from TradeStat — this country can be your supplier too.
- India’s imports, 2025-26
- US$ 1.94 bn US$ 1.29 bn → US$ 1.94 bn
- India’s exports, 2025-26
- US$ 7.45 bn
- Trade balance
- +US$ 5.51 bn exports minus imports
- Change in imports
- +50.7%
The country at a glance
- Population
- 29.6 mn 2025
- GDP
- US$ 45.5 bn 2025
- GDP per person
- US$ 1,536 2025
- Imports (goods and services)
- US$ 15.3 bn 2025
Sources: TradeStat — Export Import Data Bank, Department of Commerce · World Bank — World Development Indicators · Figures taken 29 October 2026.
What to send to Nepal
All products → Free, with conditionsFarm produceNon-basmati riceHigh-volume staple sold mainly to Africa and Bangladesh. Export reopened in 2024–25, but contracts must now be registered with APEDA.HS1006.30Exports 2025-26US$ 5.86 bn ↓10.2%
 Free to exportFarm produceFresh vegetablesOkra, green chilli, drumstick, gourds and potatoes for Gulf and UK ethnic markets. Fast, perishable and residue-sensitive.HS07Exports 2025-26US$ 2.26 bn ↑3%
 Free to exportFarm produceFresh onionBig-volume fresh export to Asia and the Gulf. Policy swings with domestic prices — check DGFT and CBIC before every season.HS0703.10Exports 2025-26US$ 430 mn ↓8.3%
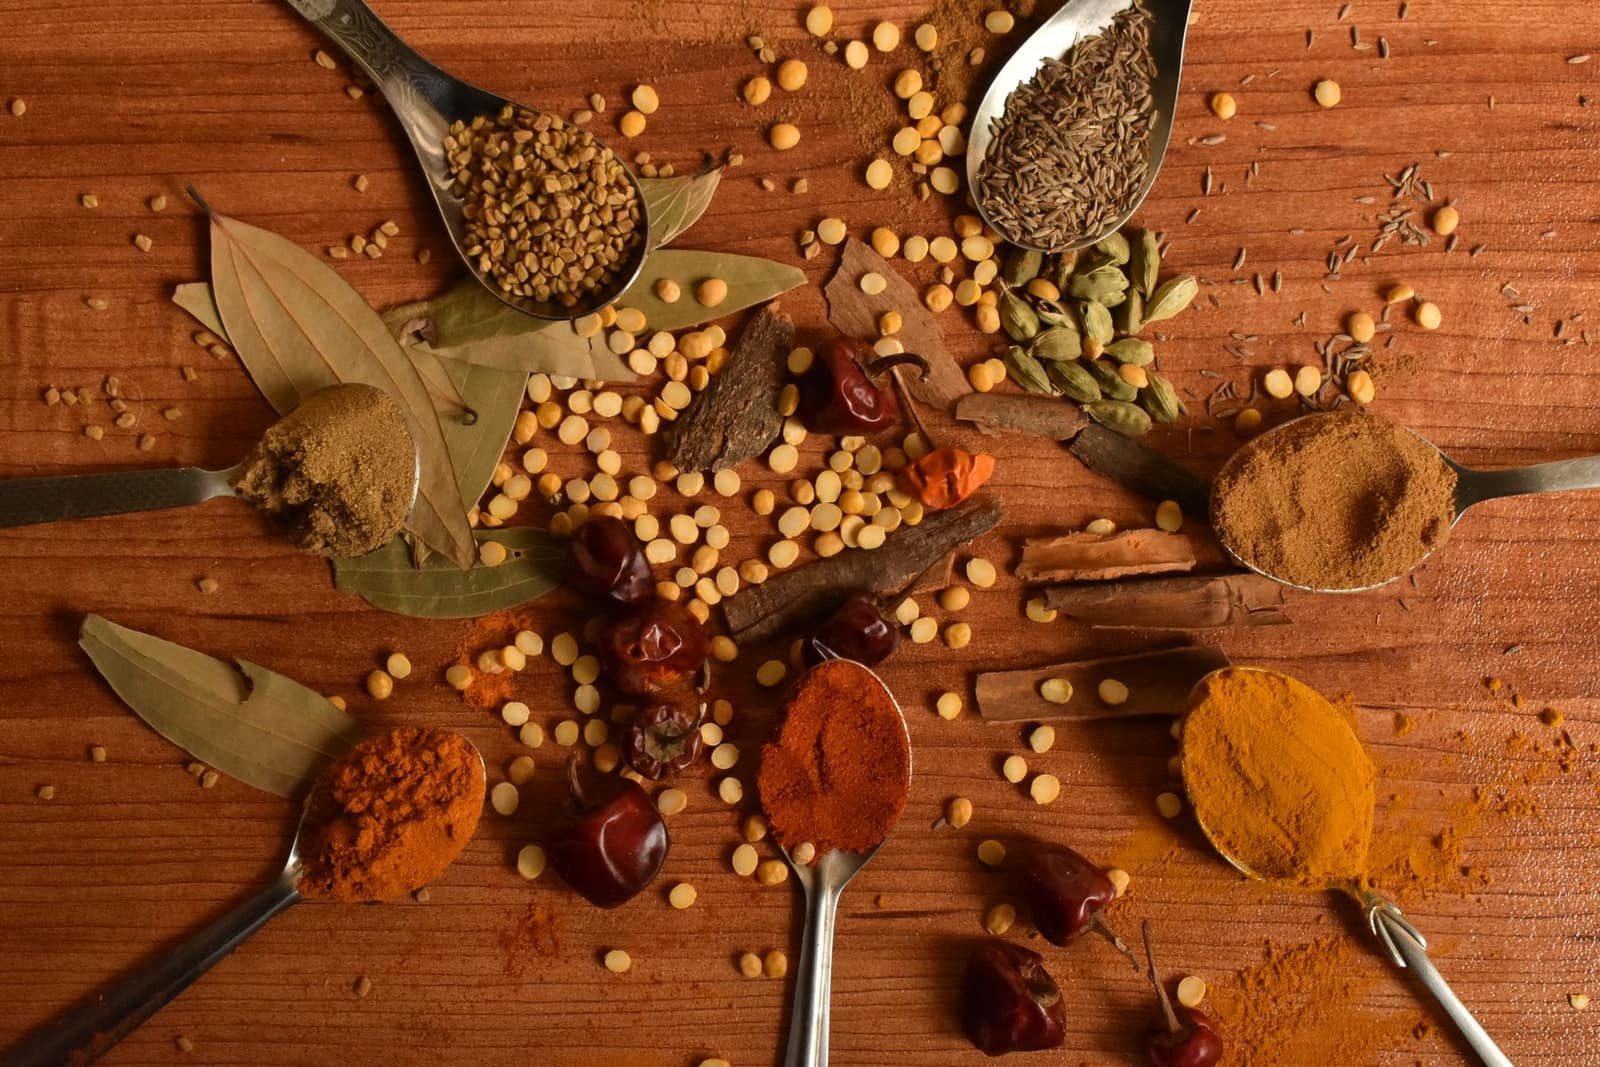 Free to exportFarm produceSpicesWhole, ground and blended spices. Spices Board registration (CRES) is compulsory; residue and ethylene oxide tests keep buyers.HS0904–0910Exports 2025-26US$ 3.12 bn ↓5.1%
 Free to exportProcessed foodProcessed foodSnacks, pickles, ready-to-eat meals, sauces, biscuits and mixes. FSSAI licence plus the buyer country’s labelling and registration rules.HS19–21Exports 2025-26US$ 4.19 bn ↑8.9%
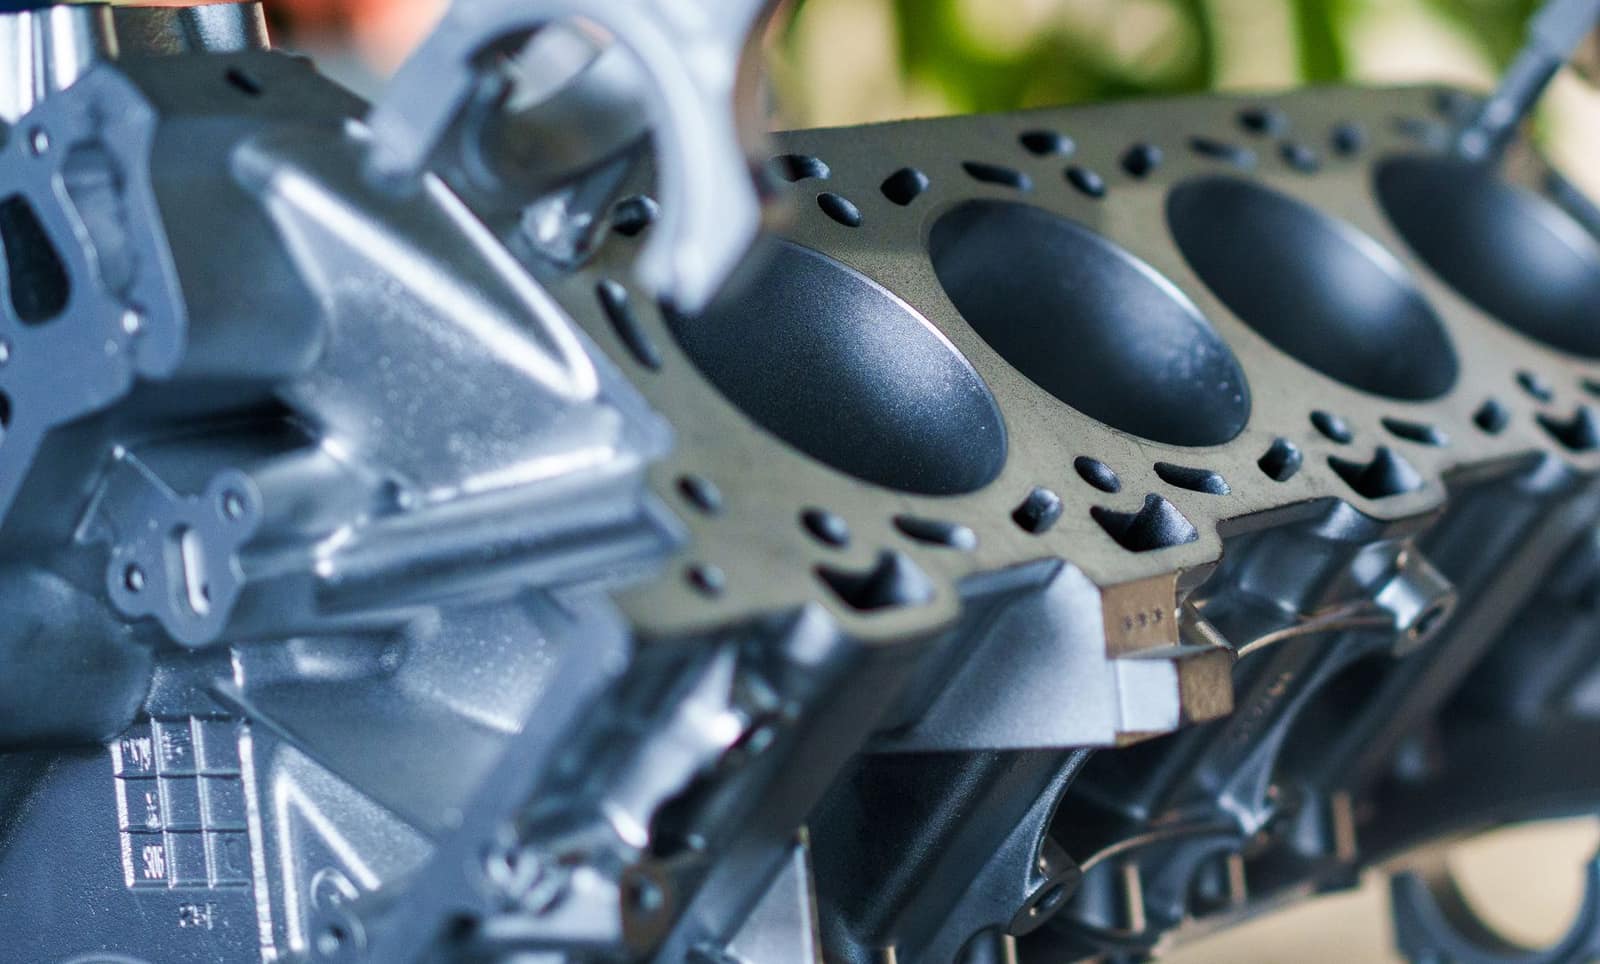 Free to exportEngineering goodsAuto parts and componentsOEM and aftermarket vehicle parts; the USA, Germany and Italy buy most, with strong demand in Latin America.HS8708Exports 2025-26US$ 7.64 bn ↑1.8%
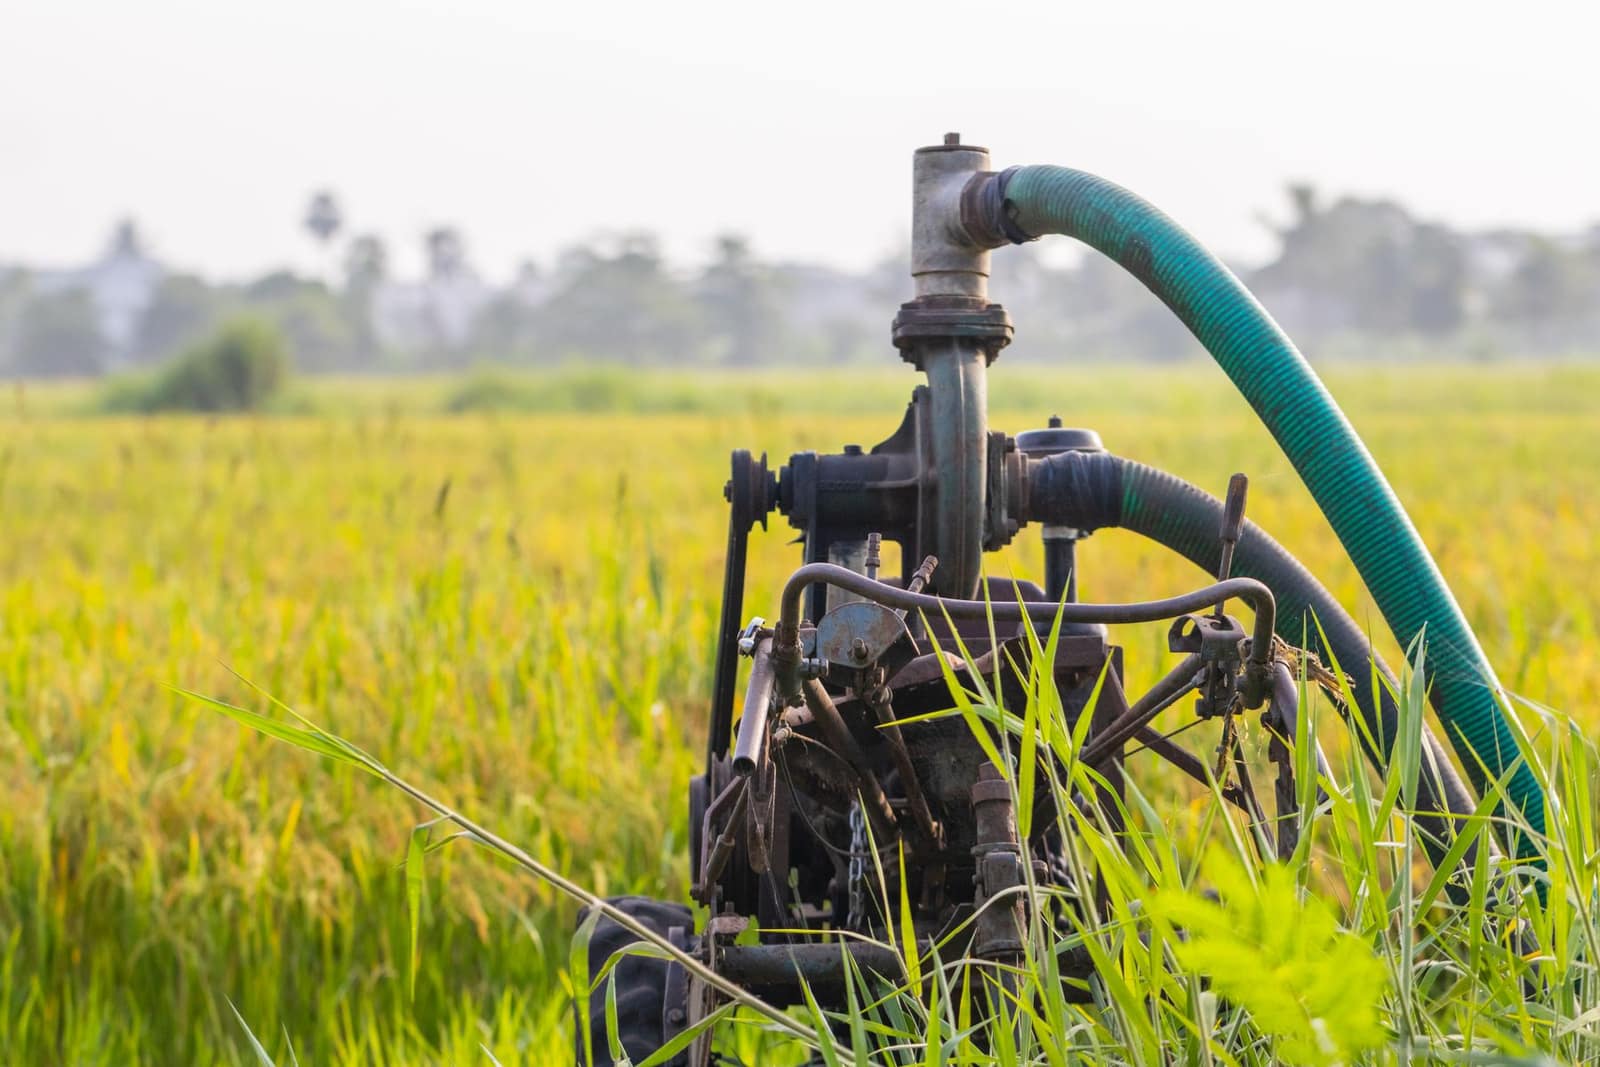 Free to exportEngineering goodsPumpsAgricultural, domestic and industrial pumps from Coimbatore, Rajkot and Ahmedabad; the USA leads.HS8413Exports 2025-26US$ 1.6 bn ↑5.2%
 Free to exportPharma & chemicalsGeneric medicines (formulations)Tablets, capsules and injectables; every market needs product registration. The USA buys the most.HS3004Exports 2025-26US$ 21.9 bn ↓0.7%
More in South Asia
 SAFTABDTDhakaBangladeshBig neighbour market for cotton, yarn, food and machinery. Mostly LC-based; land and sea routes.From India 2025-26US$ 10.6 bn
 ISFTALKRSri Jayawardenepura Kotte (Colombo is the commercial capital)Sri LankaClose island market with India's oldest FTA. Buys food, medicines, vehicles, yarn and building materials.From India 2025-26US$ 5.52 bn
 SAFTABTNThimphuBhutanDuty-free, rupee-based neighbour market reached by road from West Bengal and Assam.From India 2025-26US$ 1.25 bn