

Gulf & Middle East
Export to Israel
Technology-driven buyer of Indian diamonds, chemicals, machinery and food. FTA talks under way since 2025.
- Capital
- Jerusalem (most embassies, including India’s, are in Tel Aviv)
- Currency
- ILS
- Trade agreement with India
- India–Israel Free Trade Agreement (under negotiation) Not in force yetNot in force
- Main ports
- Haifa, Ashdod, Eilat
Israel buys cut diamonds, chemicals, machinery, textiles, rice and spices from India. Buyers are demanding on quality and paperwork, and many food retailers ask for kosher certification even where the law does not. Food imports need approval from the Ministry of Health’s National Food Service.
India and Israel signed terms of reference for an FTA in November 2025, held the first round of talks in February 2026 and the second round in New Delhi in July 2026. Until a deal is signed and in force, normal Israeli duties apply. Confirm current status on commerce.gov.in.
What it buys from India
- Cut and polished diamonds and jewellery
- Chemicals, petroleum products and machinery
- Textiles, garments, rice and spices
Import rules on their side
- Food imports must be approved by the Ministry of Health’s National Food Service; the importer files the request and may need lab tests per shipment.
- Fresh produce, seeds and plant material need an import permit and phytosanitary checks by the Plant Protection and Inspection Services (PPIS).
- Goods covered by mandatory Israeli standards are tested or certified through the Standards Institution of Israel (SII). Labels need Hebrew.
Practical tips
- Kosher certification opens most supermarket shelves for food; agree with the buyer which certifying body they accept before production.
- Shipping and insurance to Israel have been affected by regional conflict and Red Sea attacks. Check routing, war-risk cover and ECGC’s country position before each order.
- Business is in English and fast-paced. Clear specifications and samples matter more than long introductions.
Sources (8)
- PIB backgrounder — India's Trade Partnerships (27 Feb 2026)
- All India Radio News — India, Israel conclude second round of FTA negotiations (25 Jul 2026)
- Israel Ministry of Health — National Food Service (food import)
- Israel Plant Protection and Inspection Services (PPIS)
- Standards Institution of Israel (SII)
- Israel Tax Authority — Customs
- Department of Commerce — TradeStat export-import data bank
- ECGC Ltd — export credit insurance and country risk
Trade data
India’s exports to Israel in numbers
From the Department of Commerce’s TradeStat (Indian financial years, April–March), the country’s imports from the world from UN Comtrade, and its basics from the World Bank.
- India’s exports here, 2025-26
- US$ 2.24 bn No. 39 of our 80 countries
- Change from 2024-25
- ↑ +4.2% US$ 2.15 bn → US$ 2.24 bn
- Share of all Indian exports
- 0.51%
- Its imports from the world
- —
What India sells here most
By HS chapter, 2025-26. Change is against 2024-25.
What is rising and what is falling
Chapters where India sells at least US$ 5 million. Change from 2024-25 to 2025-26.
↑ High demand
- Fish and seafoodUS$ 7.8 mn → US$ 14.2 mn↑+82.4%
- Electrical and electronicsUS$ 262 mn → US$ 362 mn↑+38.5%
- Medicines and pharmaUS$ 14.5 mn → US$ 20 mn↑+38.1%
- Coffee, tea, spicesUS$ 24.7 mn → US$ 32.4 mn↑+31.3%
- Other chemical productsUS$ 22.5 mn → US$ 28.3 mn↑+26.1%
- Iron and steel articlesUS$ 33.5 mn → US$ 42.3 mn↑+26%
- Instruments, medical devicesUS$ 34.2 mn → US$ 42.3 mn↑+23.9%
- Paper and paperboardUS$ 28.6 mn → US$ 34.8 mn↑+21.5%
↓ Low demand
- Cereals (rice, wheat, maize)US$ 104 mn → US$ 69.3 mn↓-33.2%
- Oilseeds and seedsUS$ 24.7 mn → US$ 17.1 mn↓-31%
- AircraftUS$ 54.3 mn → US$ 40.3 mn↓-25.8%
- PlasticsUS$ 89.3 mn → US$ 71 mn↓-20.5%
- Explosives, matchesUS$ 21 mn → US$ 17.5 mn↓-16.4%
- Knitted garmentsUS$ 66.4 mn → US$ 58.8 mn↓-11.5%
Our product guides that sell here
India’s exports of each product to this country, 2025-26.
The 20 biggest export lines
4-digit HS lines, 2025-26, with their Harmonized System descriptions.
What India buys from Israel
India’s imports from this country in 2025-26 by HS chapter, from TradeStat — this country can be your supplier too.
- India’s imports, 2025-26
- US$ 1.67 bn US$ 1.48 bn → US$ 1.67 bn
- India’s exports, 2025-26
- US$ 2.24 bn
- Trade balance
- +US$ 569 mn exports minus imports
- Change in imports
- +12.5%
The country at a glance
- Population
- 10.1 mn 2025
- GDP
- US$ 610.8 bn 2025
- GDP per person
- US$ 60,337 2025
- Imports (goods and services)
- US$ 155.3 bn 2025
Sources: TradeStat — Export Import Data Bank, Department of Commerce · World Bank — World Development Indicators · Figures taken 29 October 2026.
What to send to Israel
All products → Free to exportJewelleryCut and polished diamondsIndia's largest gem export, polished in Surat; Hong Kong, the UAE, the USA and Belgium are the main buyers.HS7102.39Exports 2025-26US$ 12.1 bn ↓8.7%
 Free, with conditionsJewelleryGold jewelleryPlain and studded gold jewellery; the UAE buys about half, followed by the USA.HS7113.19Exports 2025-26US$ 11.6 bn ↑0.5%
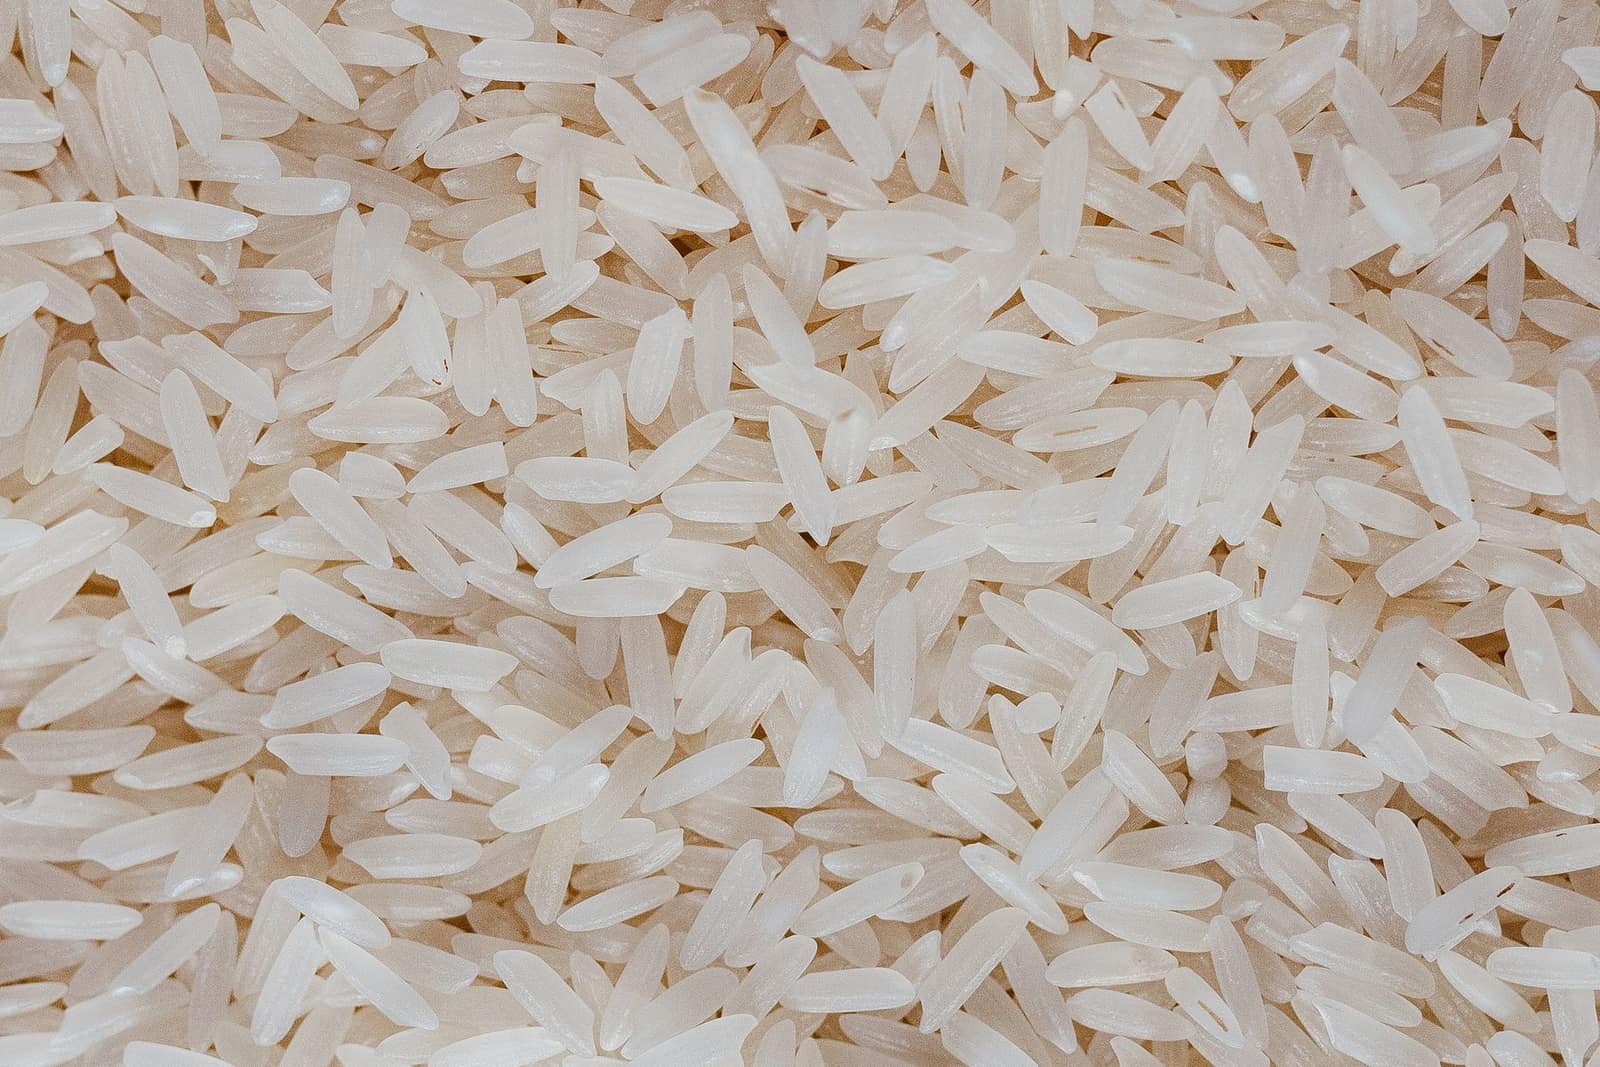 Free, with conditionsFarm produceBasmati riceIndia’s top agri export by value. Free to export, but every contract must be registered with APEDA first.HS1006.30Exports 2025-26US$ 5.67 bn ↓4.6%
 Free to exportFarm produceSpicesWhole, ground and blended spices. Spices Board registration (CRES) is compulsory; residue and ethylene oxide tests keep buyers.HS0904–0910Exports 2025-26US$ 3.12 bn ↓5.1%
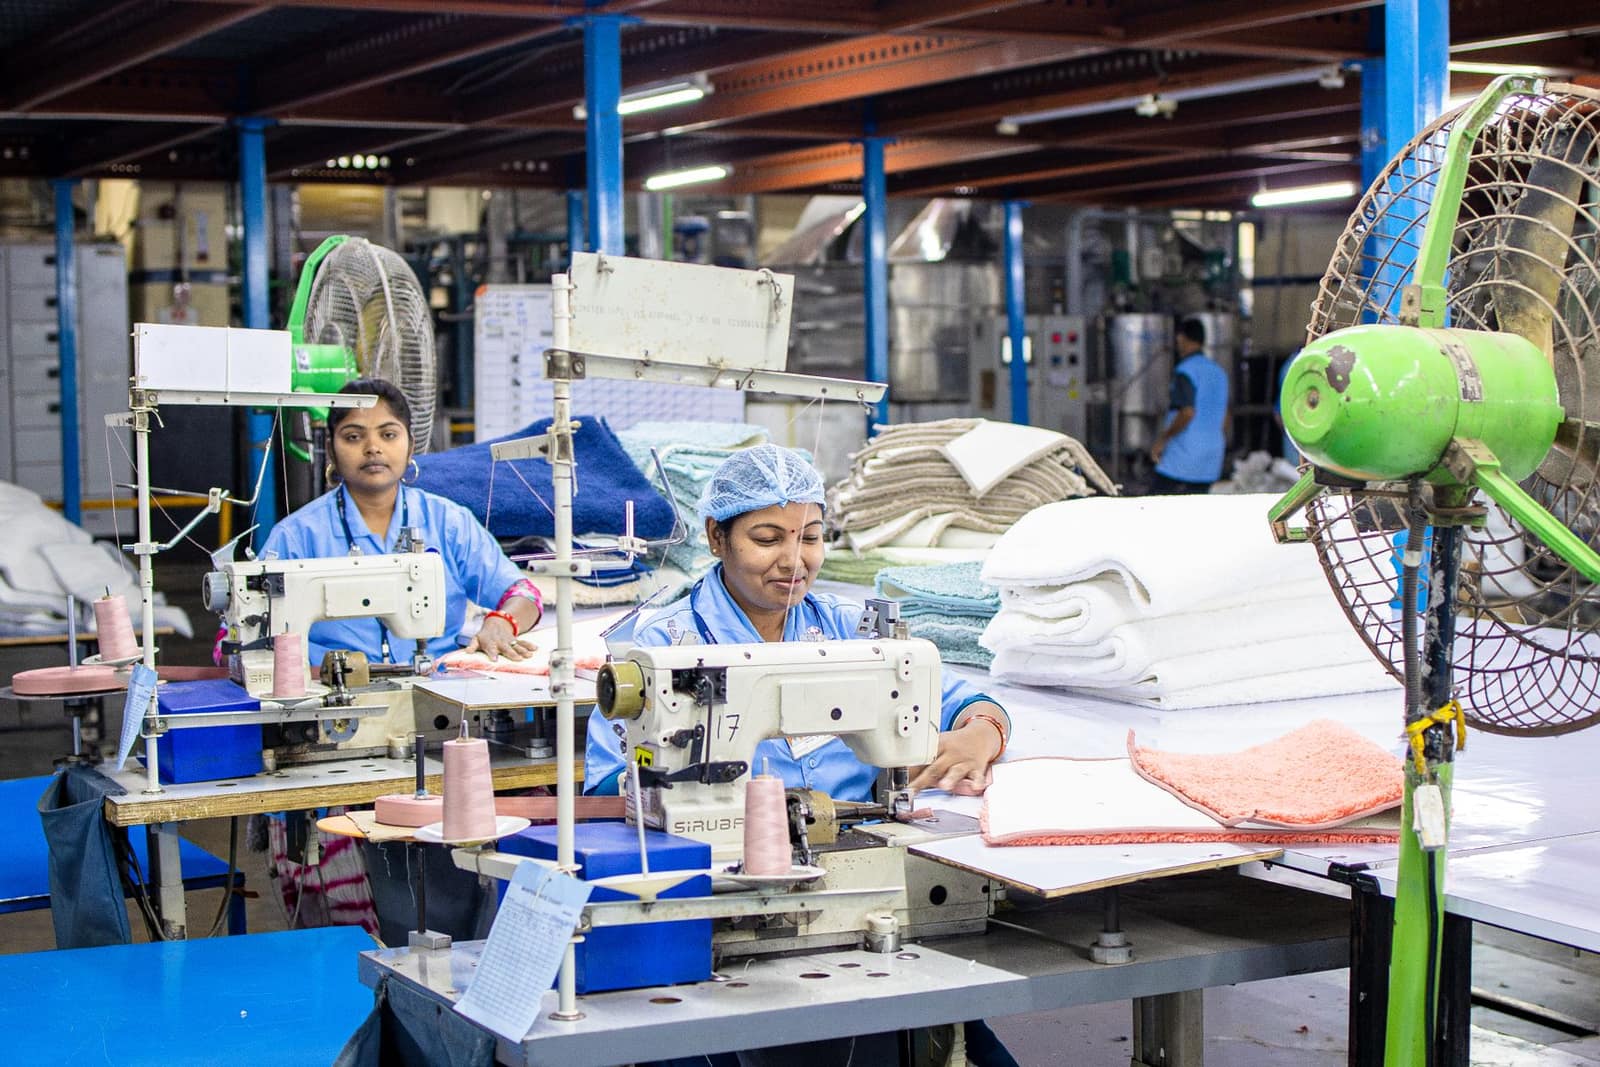 Free to exportTextiles & apparelReadymade garmentsKnitted and woven clothing for brands and retailers; the USA, UK, UAE and the EU are the big buyers.HS6109.10Exports 2025-26US$ 15.8 bn ↓1.2%
 Free to exportTextiles & apparelHome textiles (bed, bath and kitchen linen)Bedsheets, towels and kitchen linen for retailers; the USA buys more than half of India's exports.HS6302Exports 2025-26US$ 2.01 bn ↓5.7%
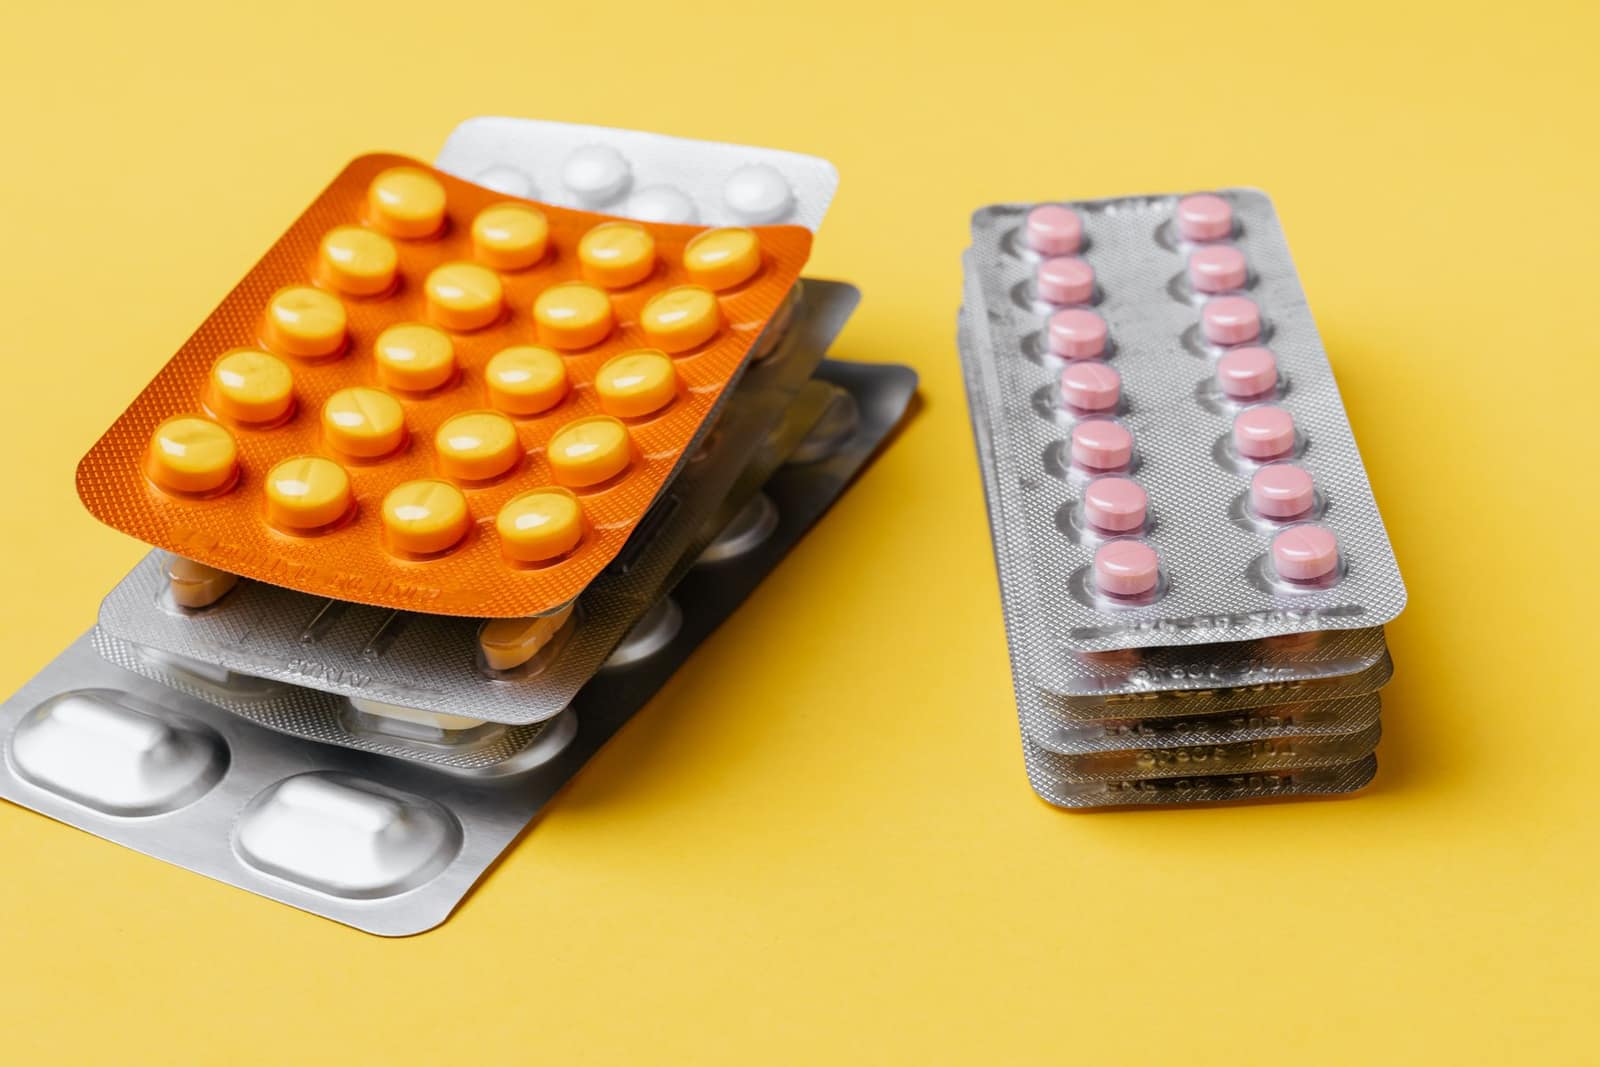 Free to exportPharma & chemicalsGeneric medicines (formulations)Tablets, capsules and injectables; every market needs product registration. The USA buys the most.HS3004Exports 2025-26US$ 21.9 bn ↓0.7%
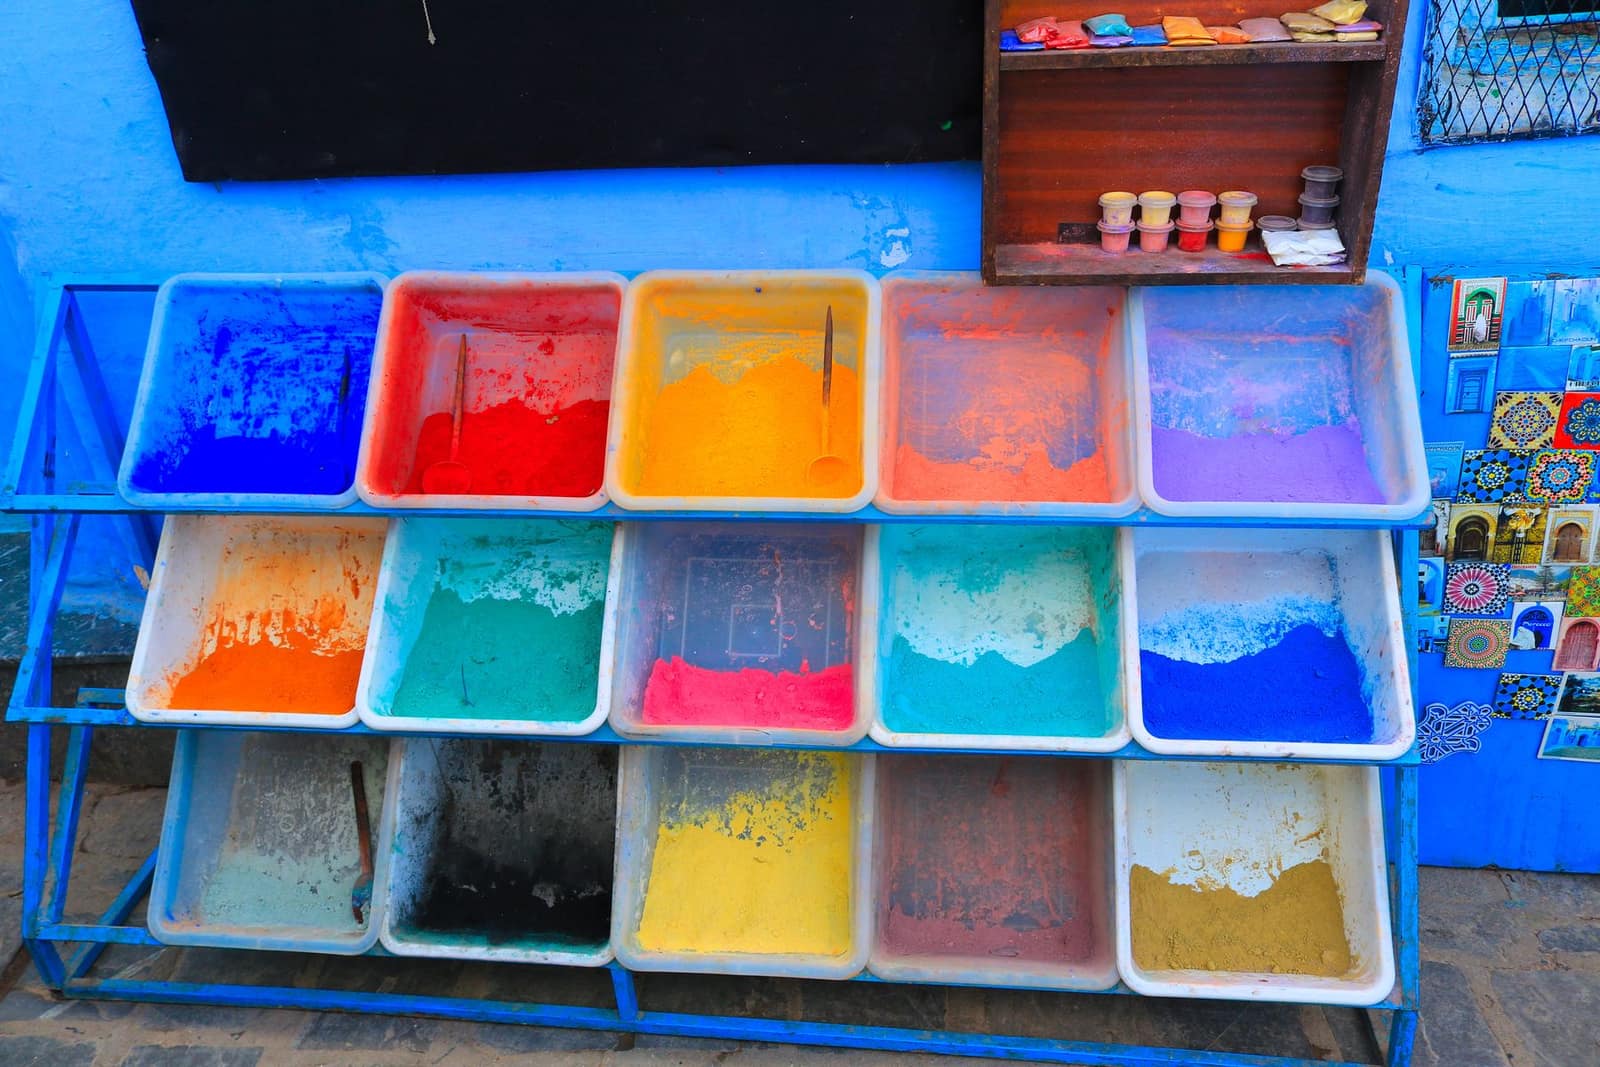 Free to exportPharma & chemicalsDyes and pigmentsReactive and disperse dyes and organic pigments from Gujarat and Maharashtra; textile hubs in Asia and Europe buy them.HS3204Exports 2025-26US$ 2.46 bn ↓8.7%
More in Gulf & Middle East
 CEPAAEDAbu DhabiUnited Arab EmiratesIndia's biggest Gulf buyer and a re-export hub for the Middle East and Africa. CEPA in force since 2022.From India 2025-26US$ 37.4 bn
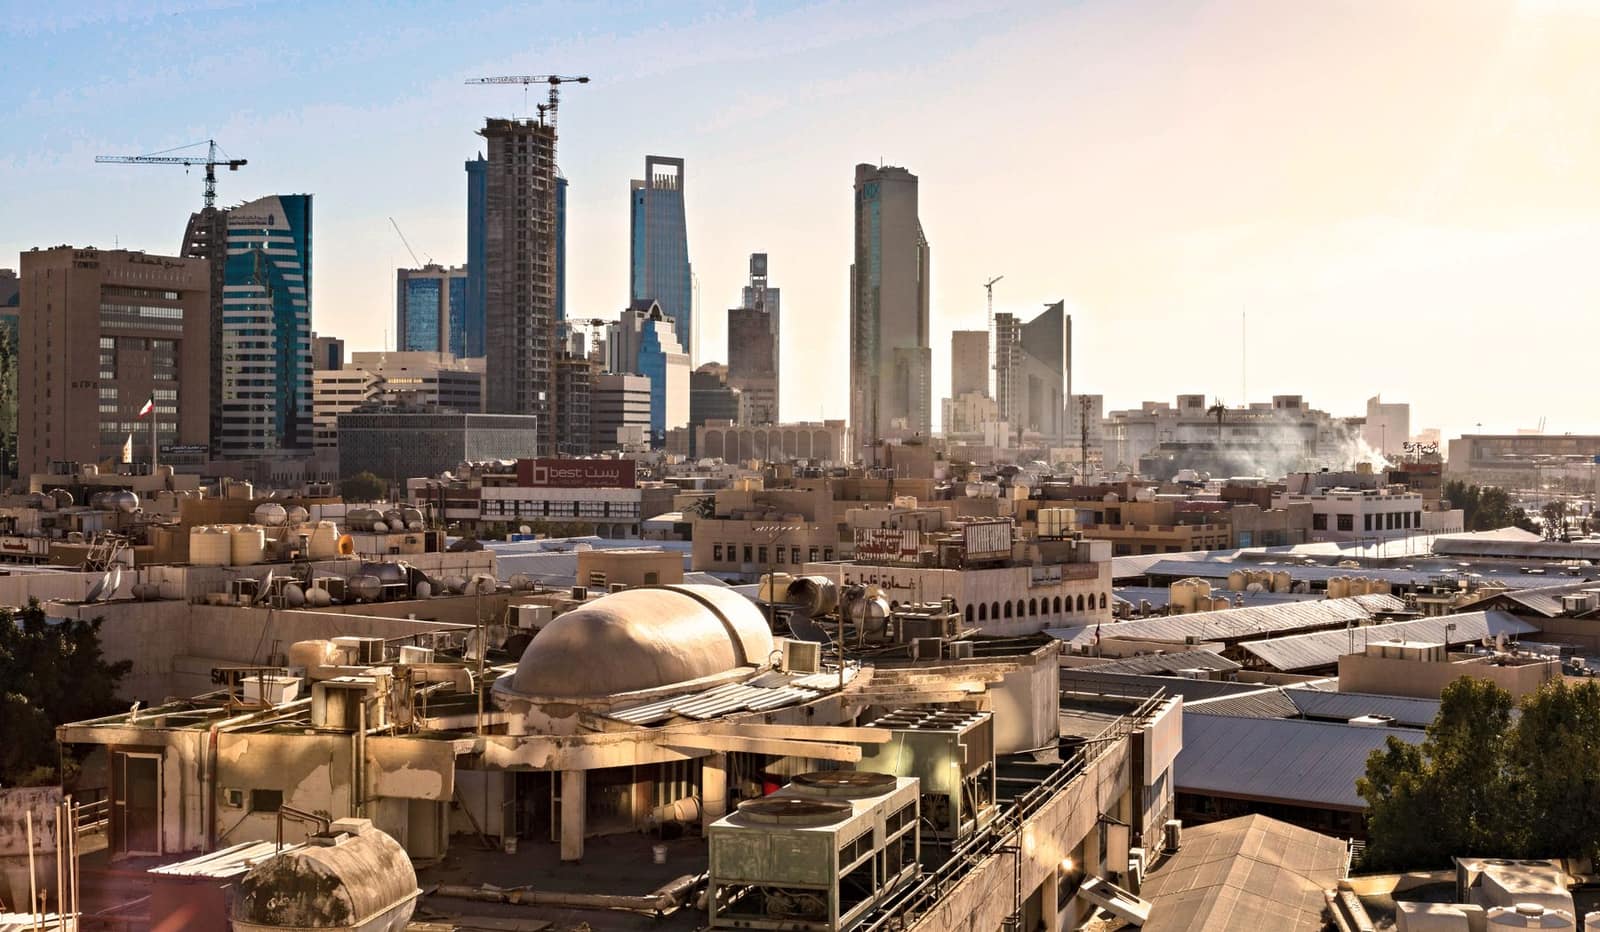 SARRiyadhSaudi ArabiaLarge Gulf market for rice, food and engineering goods. Strict SFDA food rules and SABER certification for regulated goods.From India 2025-26US$ 10.3 bn
 CEPAOMRMuscatOmanNew CEPA in force since June 2026 — almost all Indian goods now enter duty-free. Short sea route from Gujarat.From India 2025-26US$ 4.02 bn
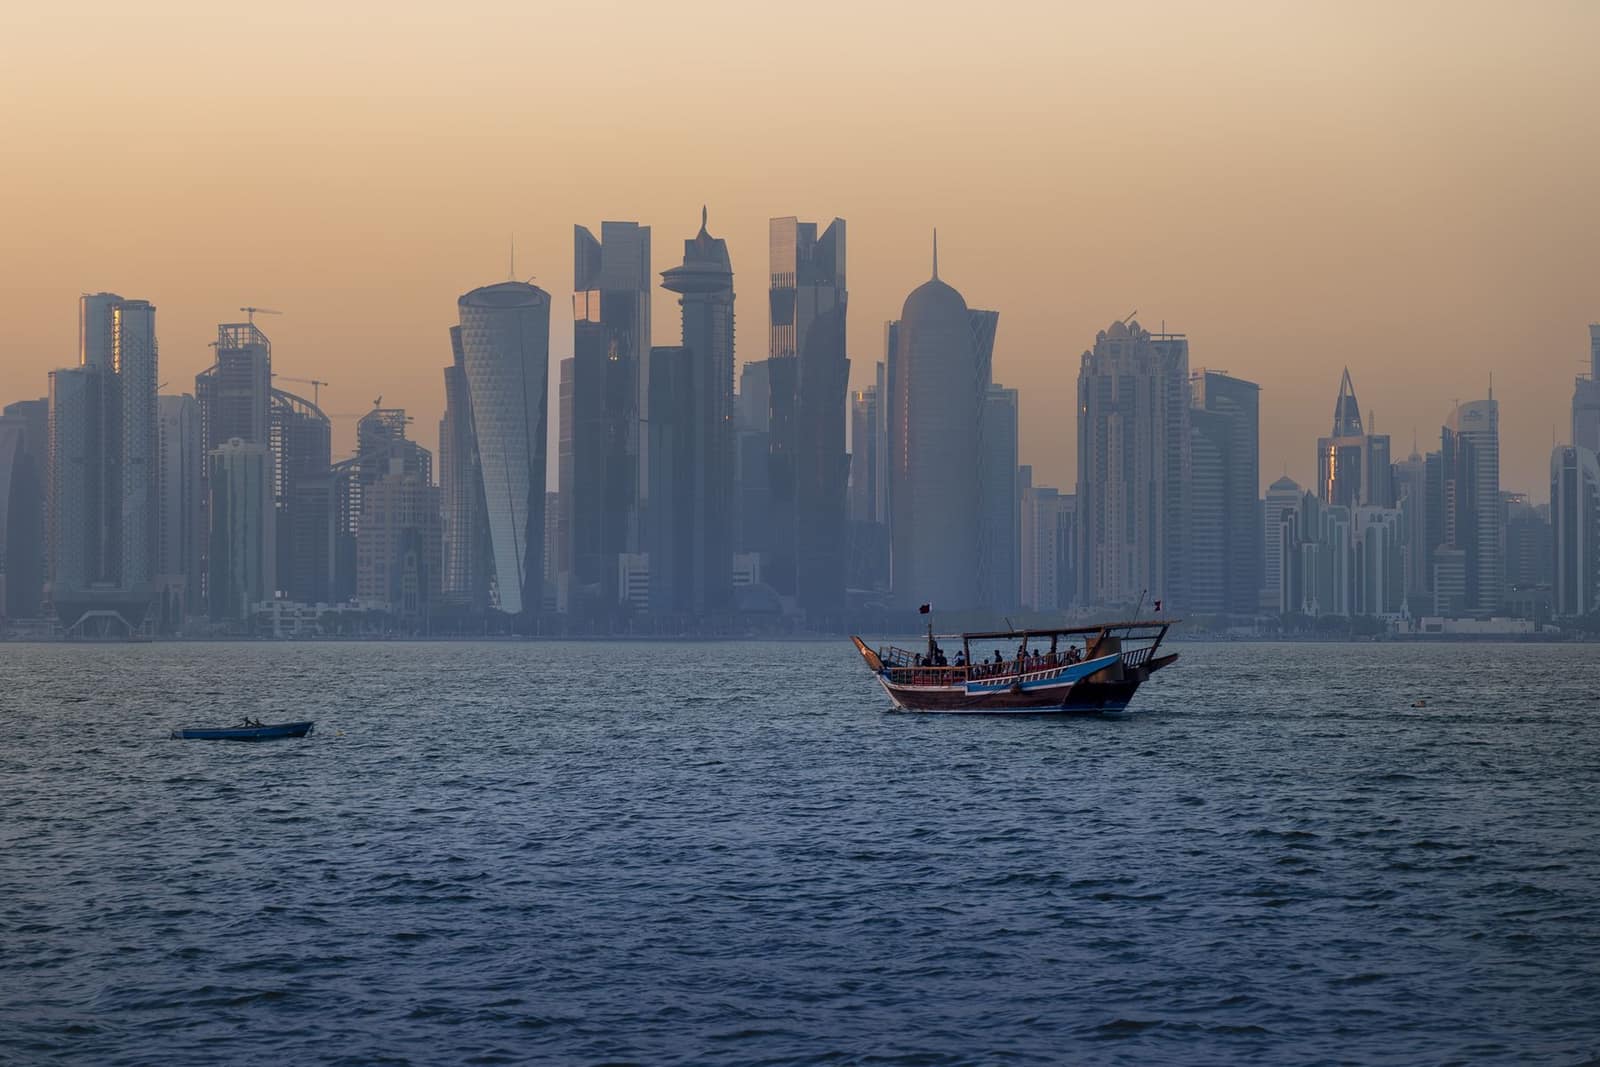 QARDohaQatarSmall, wealthy Gulf market with a huge Indian workforce. Imports nearly all its food.From India 2025-26US$ 1.62 bn