

Americas
Export to Mexico
Large Latin American market for Indian vehicles, auto parts and chemicals. Higher duties on non-FTA goods since January 2026.
- Capital
- Mexico City
- Currency
- MXN
- Trade agreement with India
- No India–Mexico trade agreement (trade talks under way) Not in force yetNot in force
- Main ports
- Manzanillo, Lázaro Cárdenas, Veracruz
Mexico is one of India's biggest markets in Latin America and a manufacturing base tied closely to the United States. Indian cars, two-wheelers, auto parts, chemicals and medicines sell well. The January 2026 duty increase makes it important to check your exact HS code before you price an order.
There is no trade agreement. From 1 January 2026 Mexico raised its normal (MFN) duties on a long list of goods from countries without a trade agreement with it, including India — vehicles, auto parts, steel, textiles and garments were among the goods hit. India and Mexico are holding talks on trade (PIB, Feb 2026). Check the current duty for your HS code in Mexico's official gazette (DOF) before quoting.
What it buys from India
- Passenger cars, motorcycles and auto parts
- Organic chemicals, bulk drugs and medicines
- Iron and steel products and machinery
- Cotton yarn, fabrics and garments
Import rules on their side
- The importer must be listed in the Padrón de Importadores (register of importers) kept by Mexico's tax authority SAT; some goods need a sector-specific listing.
- Plant and animal products need SENASICA import requirements and an inspection at entry; medicines, food supplements and cosmetics are regulated by COFEPRIS.
- Labels must be in Spanish and follow the relevant Mexican Official Standard (NOM), for example NOM-051 for packaged food and drinks.
Practical tips
- Sea freight from India usually goes to Manzanillo on the Pacific coast; ask your forwarder for transit time, as many services tranship in East Asia.
- Spanish-language quotations and technical sheets are expected. Mexican importers often use a customs broker (agente aduanal) who will ask for exact HS codes.
- For a first order ask for an advance or an LC; check ECGC cover before offering credit.
Sources (6)
- PIB backgrounder — India's Trade Partnerships (27 Feb 2026)
- Diario Oficial de la Federación, Mexico (official gazette)
- SENASICA — National Service of Agro-Food Health, Safety and Quality, Mexico
- COFEPRIS — Federal Commission for Protection against Sanitary Risks, Mexico
- SAT — Mexico Tax Administration Service (register of importers)
- Department of Commerce — TradeStat export-import data bank
Trade data
India’s exports to Mexico in numbers
From the Department of Commerce’s TradeStat (Indian financial years, April–March), the country’s imports from the world from UN Comtrade, and its basics from the World Bank.
- India’s exports here, 2025-26
- US$ 5.73 bn No. 23 of our 80 countries
- Change from 2024-25
- ↓ -0.4% US$ 5.75 bn → US$ 5.73 bn
- Share of all Indian exports
- 1.3%
- Its imports from the world
- —
What India sells here most
By HS chapter, 2025-26. Change is against 2024-25.
What is rising and what is falling
Chapters where India sells at least US$ 5 million. Change from 2024-25 to 2025-26.
↑ High demand
- Gems, jewellery, precious metalsUS$ 10.9 mn → US$ 168 mn↑+1,442.6%
- Medicines and pharmaUS$ 197 mn → US$ 327 mn↑+65.8%
- Essential oils, cosmeticsUS$ 24.7 mn → US$ 32.3 mn↑+31.1%
- Instruments, medical devicesUS$ 55.8 mn → US$ 69.5 mn↑+24.6%
- Other chemical productsUS$ 58.6 mn → US$ 68.1 mn↑+16.3%
- RubberUS$ 71.2 mn → US$ 81.3 mn↑+14.1%
- Furniture, lightingUS$ 26.5 mn → US$ 29.6 mn↑+11.7%
↓ Low demand
- Ceramics and tilesUS$ 94.1 mn → US$ 52.6 mn↓-44.2%
- AluminiumUS$ 383 mn → US$ 260 mn↓-32.3%
- Home textiles, made-upsUS$ 55.6 mn → US$ 42 mn↓-24.5%
- Woven garmentsUS$ 111 mn → US$ 86.5 mn↓-21.9%
- Iron and steel articlesUS$ 177 mn → US$ 139 mn↓-21.2%
- Man-made staple fibresUS$ 44.6 mn → US$ 35.3 mn↓-20.9%
- PlasticsUS$ 137 mn → US$ 112 mn↓-18.2%
- Dyes, paints, inksUS$ 86.2 mn → US$ 76.1 mn↓-11.7%
Our product guides that sell here
India’s exports of each product to this country, 2025-26.
The 20 biggest export lines
4-digit HS lines, 2025-26, with their Harmonized System descriptions.
What India buys from Mexico
India’s imports from this country in 2025-26 by HS chapter, from TradeStat — this country can be your supplier too.
- India’s imports, 2025-26
- US$ 2.11 bn US$ 2.87 bn → US$ 2.11 bn
- India’s exports, 2025-26
- US$ 5.73 bn
- Trade balance
- +US$ 3.62 bn exports minus imports
- Change in imports
- -26.6%
The country at a glance
- Population
- 132 mn 2025
- GDP
- US$ 1,832.6 bn 2025
- GDP per person
- US$ 13,889 2025
- Imports (goods and services)
- US$ 738.2 bn 2025
Sources: TradeStat — Export Import Data Bank, Department of Commerce · World Bank — World Development Indicators · Figures taken 29 October 2026.
What to send to Mexico
All products →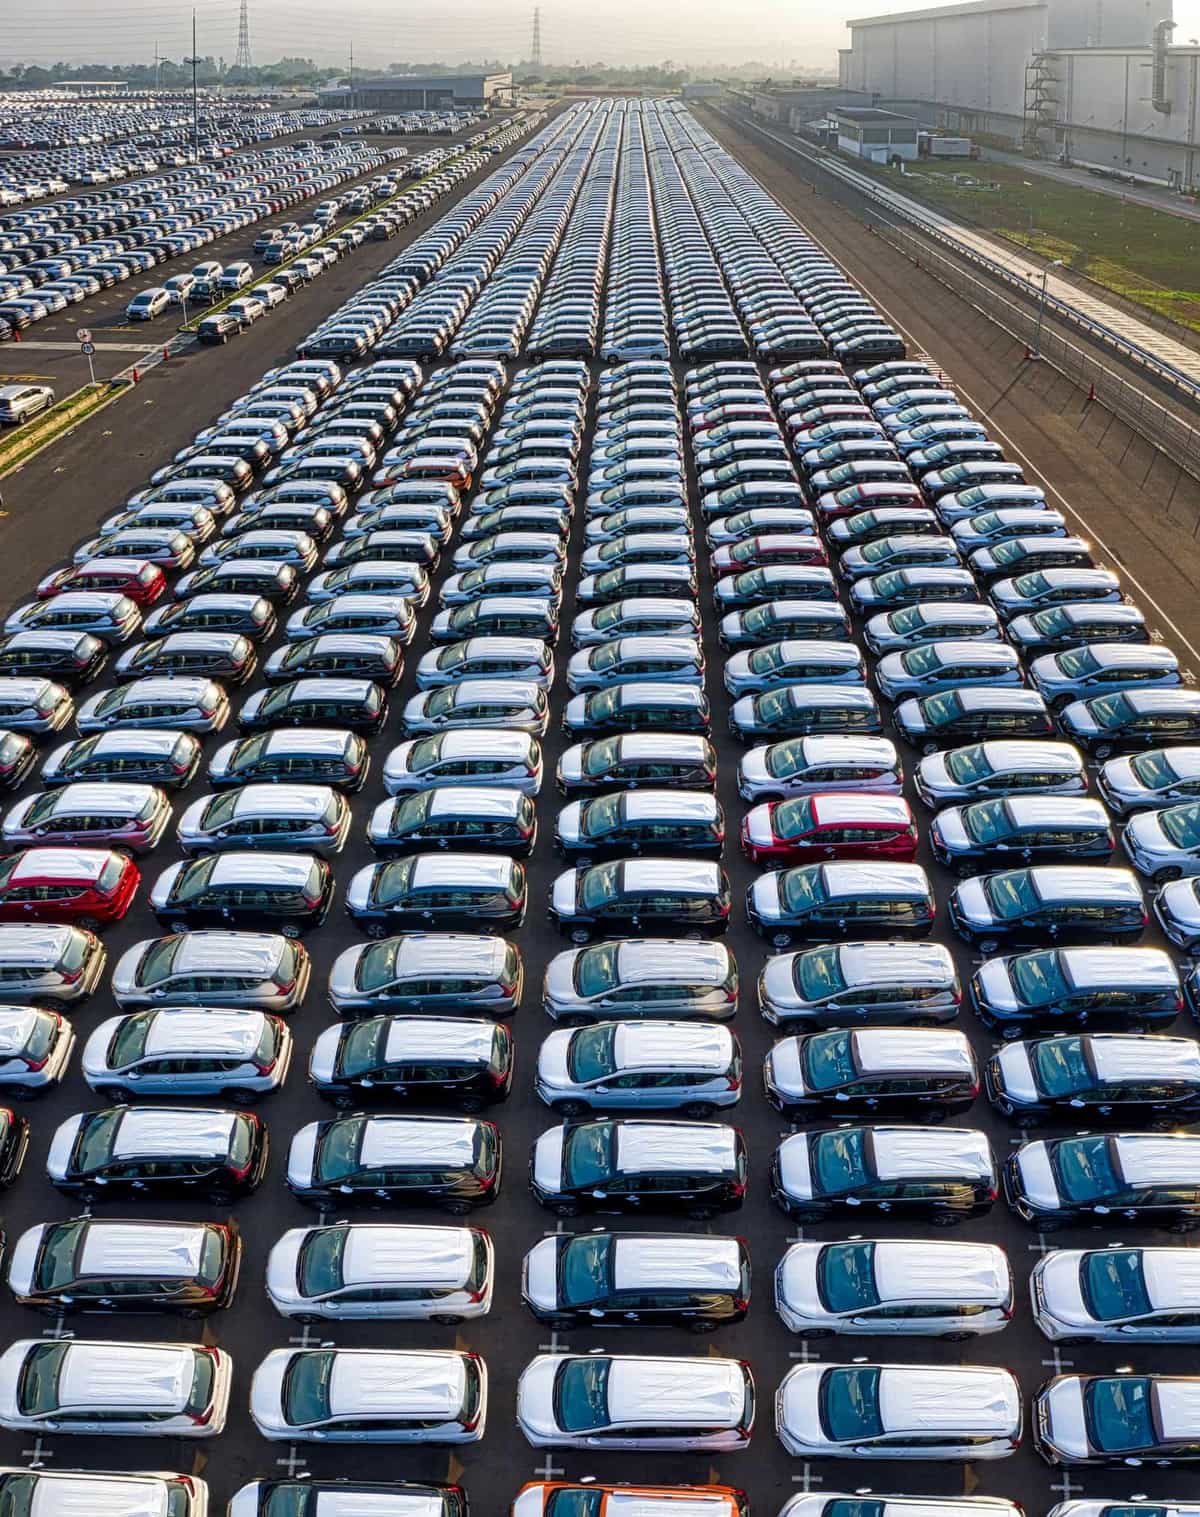 Free to exportEngineering goodsPassenger carsSmall cars and SUVs built in India for Africa, the Gulf, Latin America and Japan.HS8703Exports 2025-26US$ 9.04 bn ↑24.9%
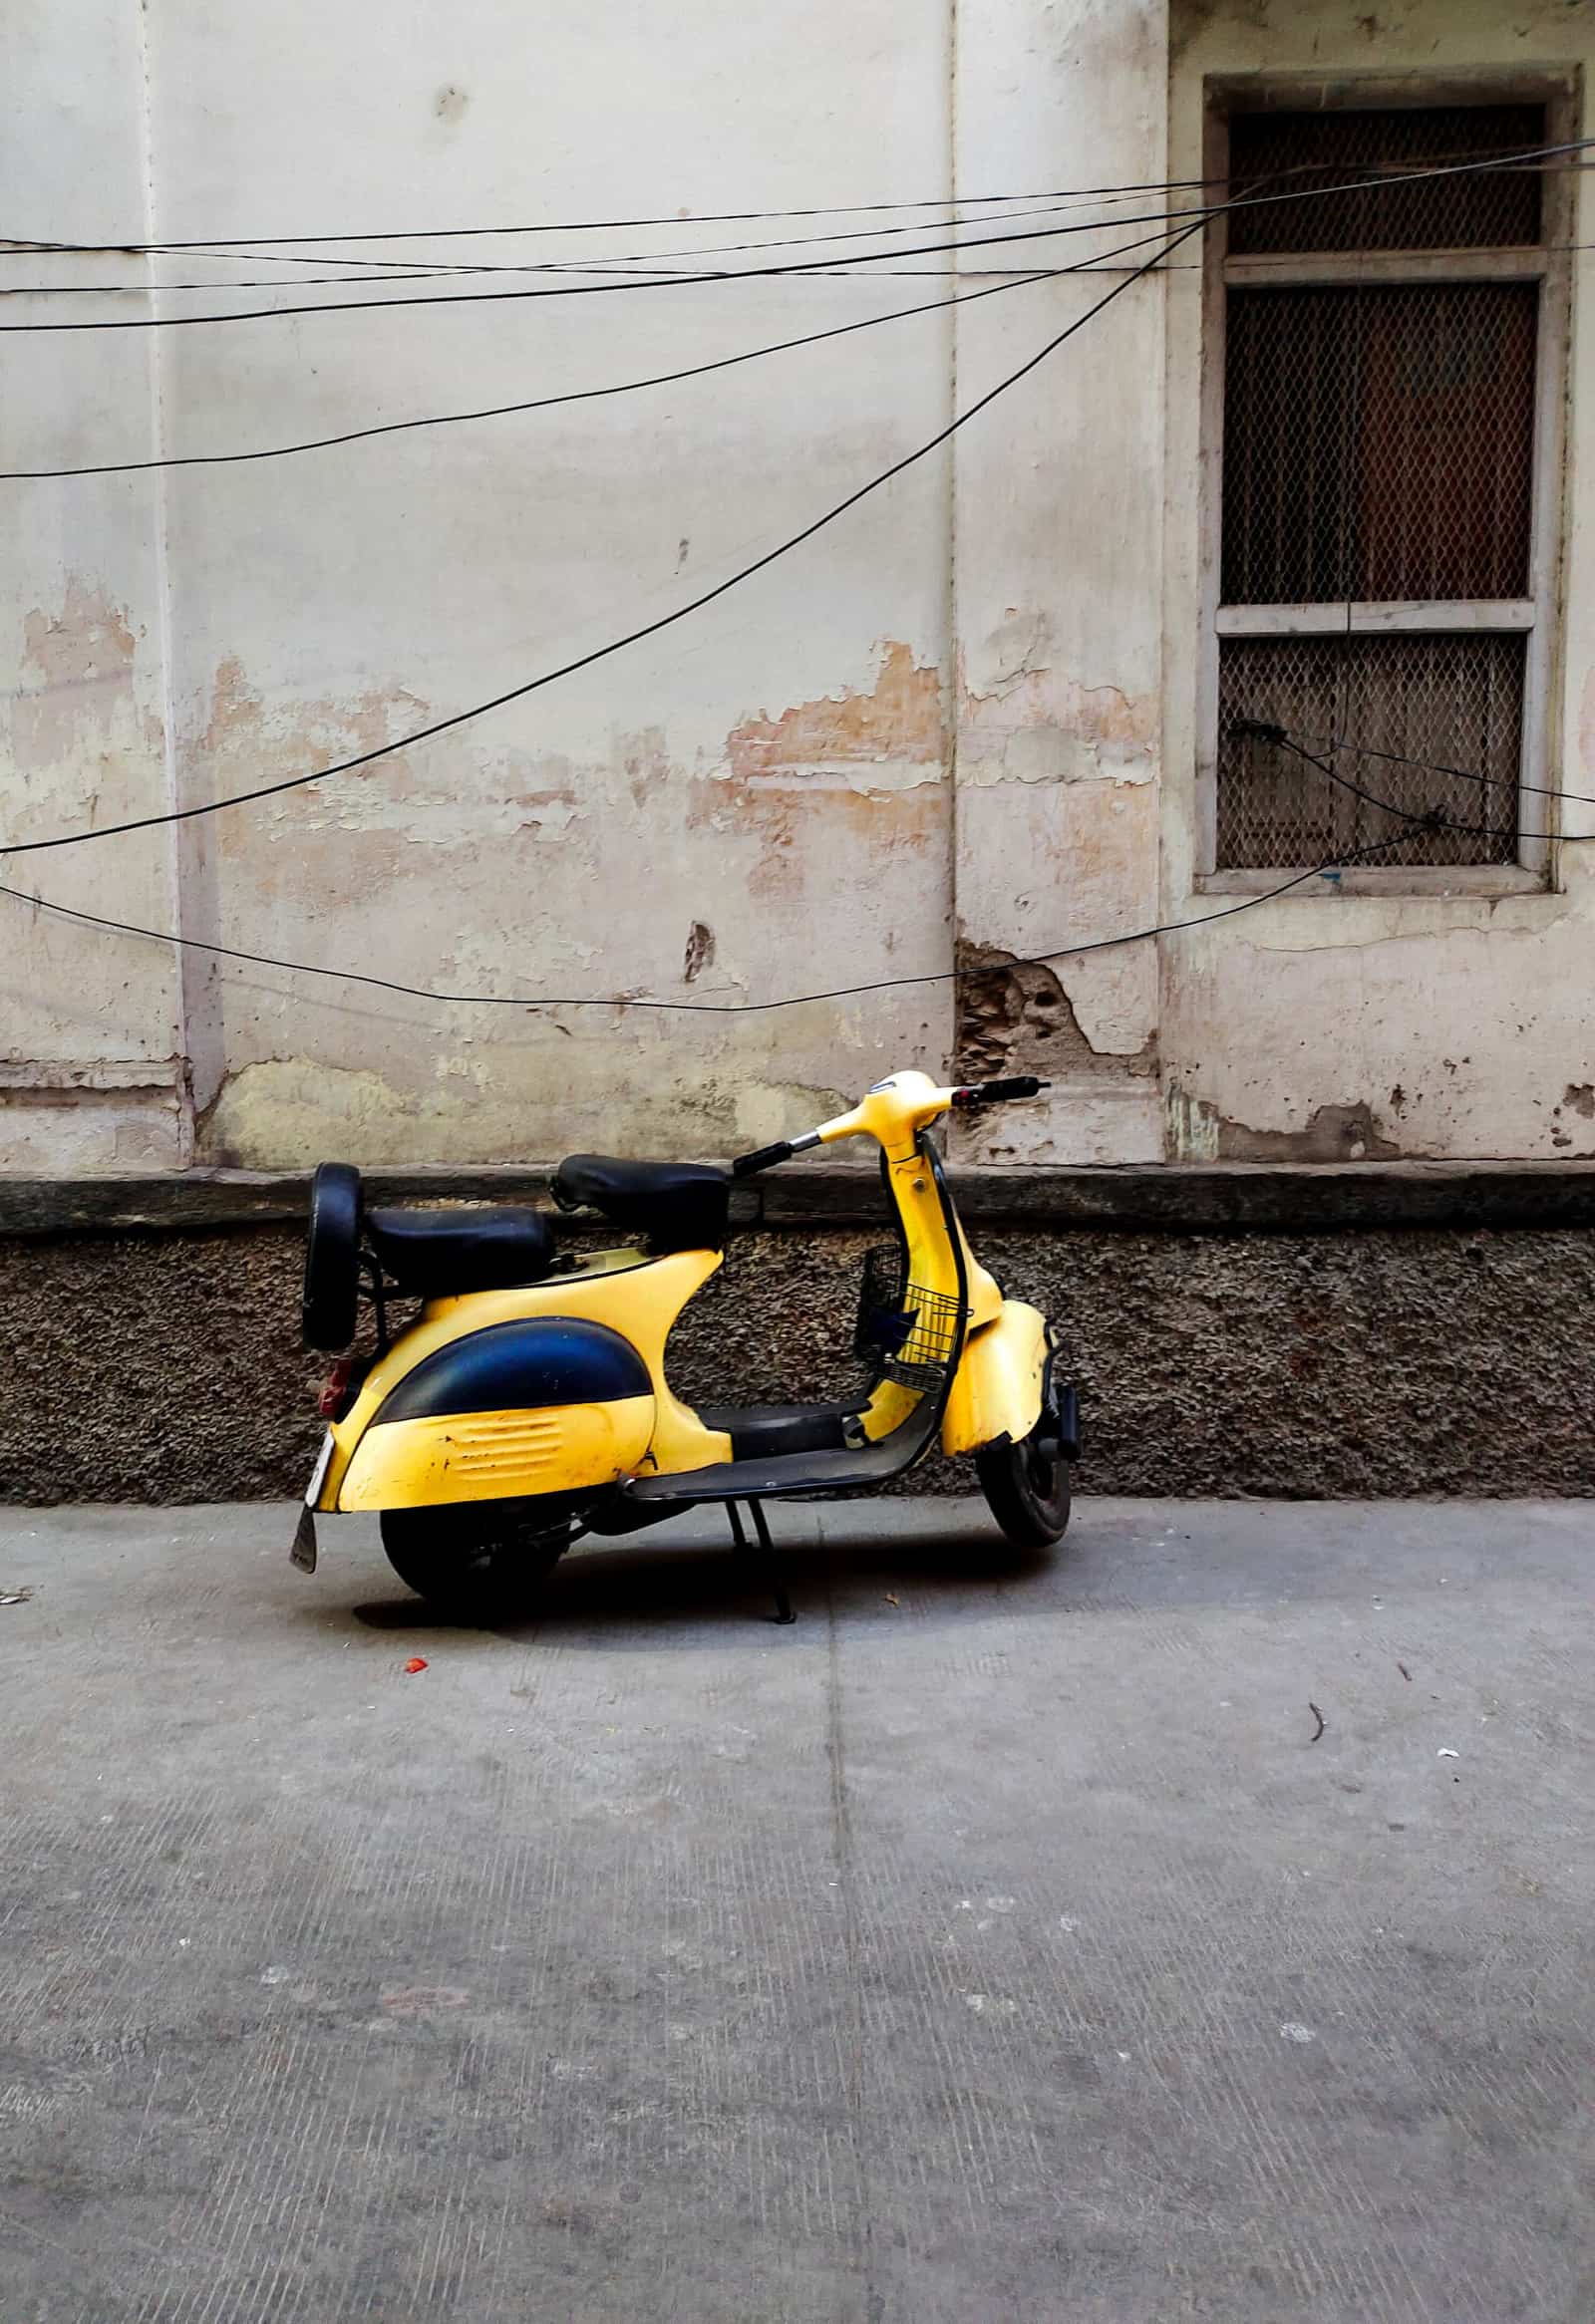 Free to exportEngineering goodsMotorcycles and scootersCommuter motorcycles and scooters for Latin America, Africa and South Asia; India is a top exporter.HS8711Exports 2025-26US$ 3.98 bn ↑24.2%
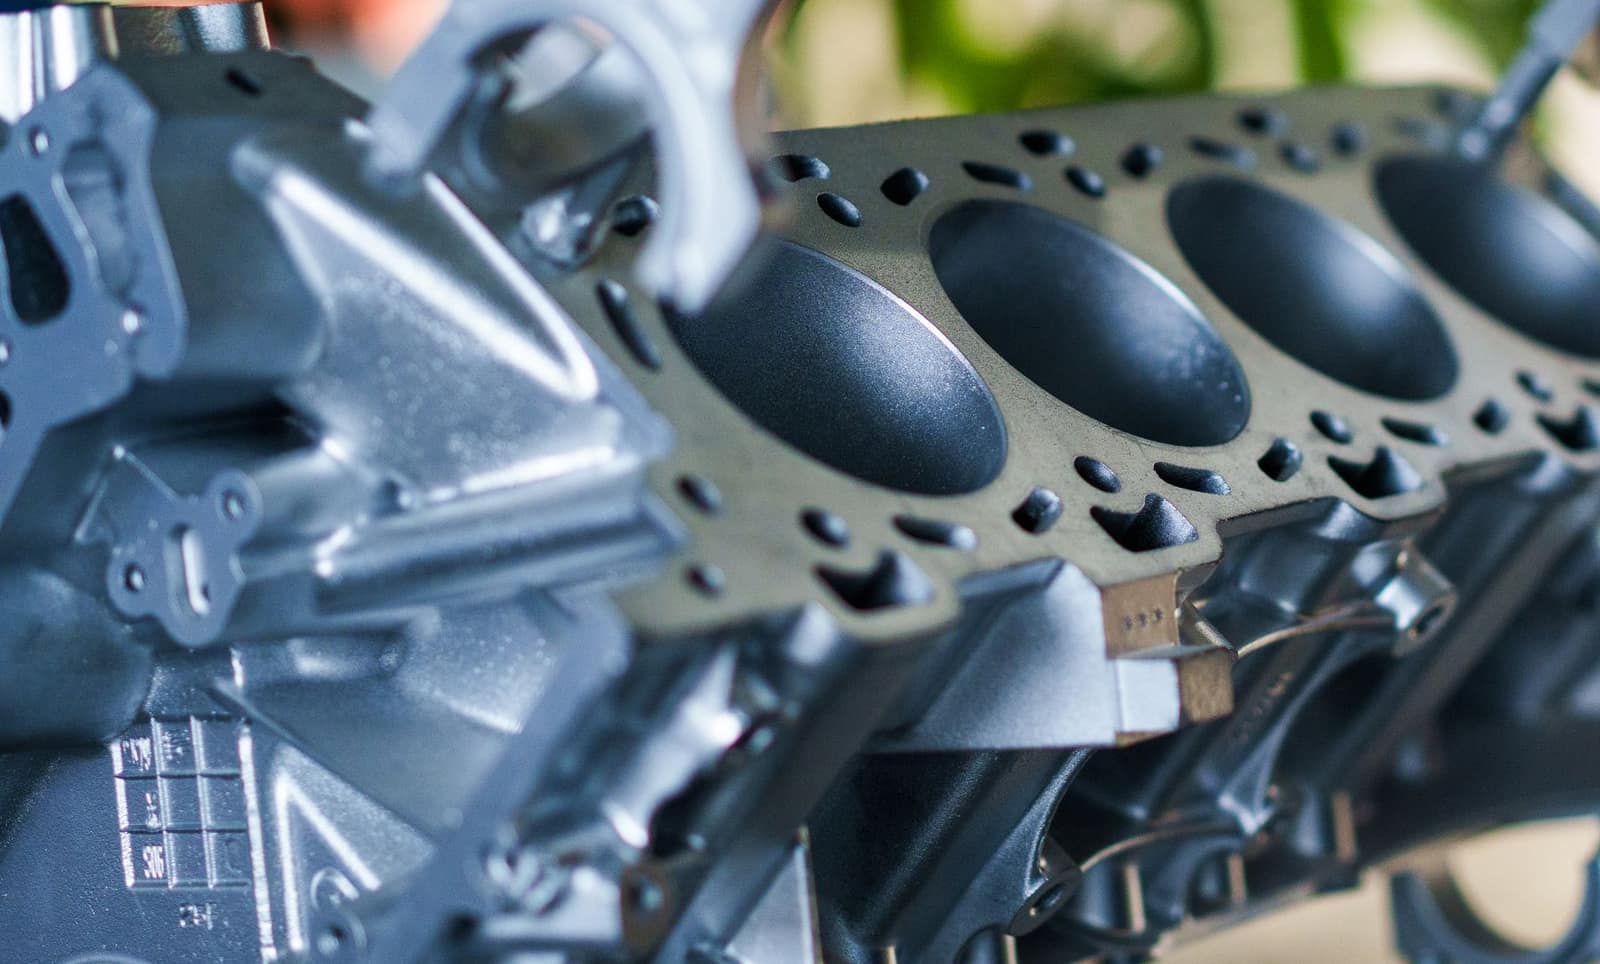 Free to exportEngineering goodsAuto parts and componentsOEM and aftermarket vehicle parts; the USA, Germany and Italy buy most, with strong demand in Latin America.HS8708Exports 2025-26US$ 7.64 bn ↑1.8%
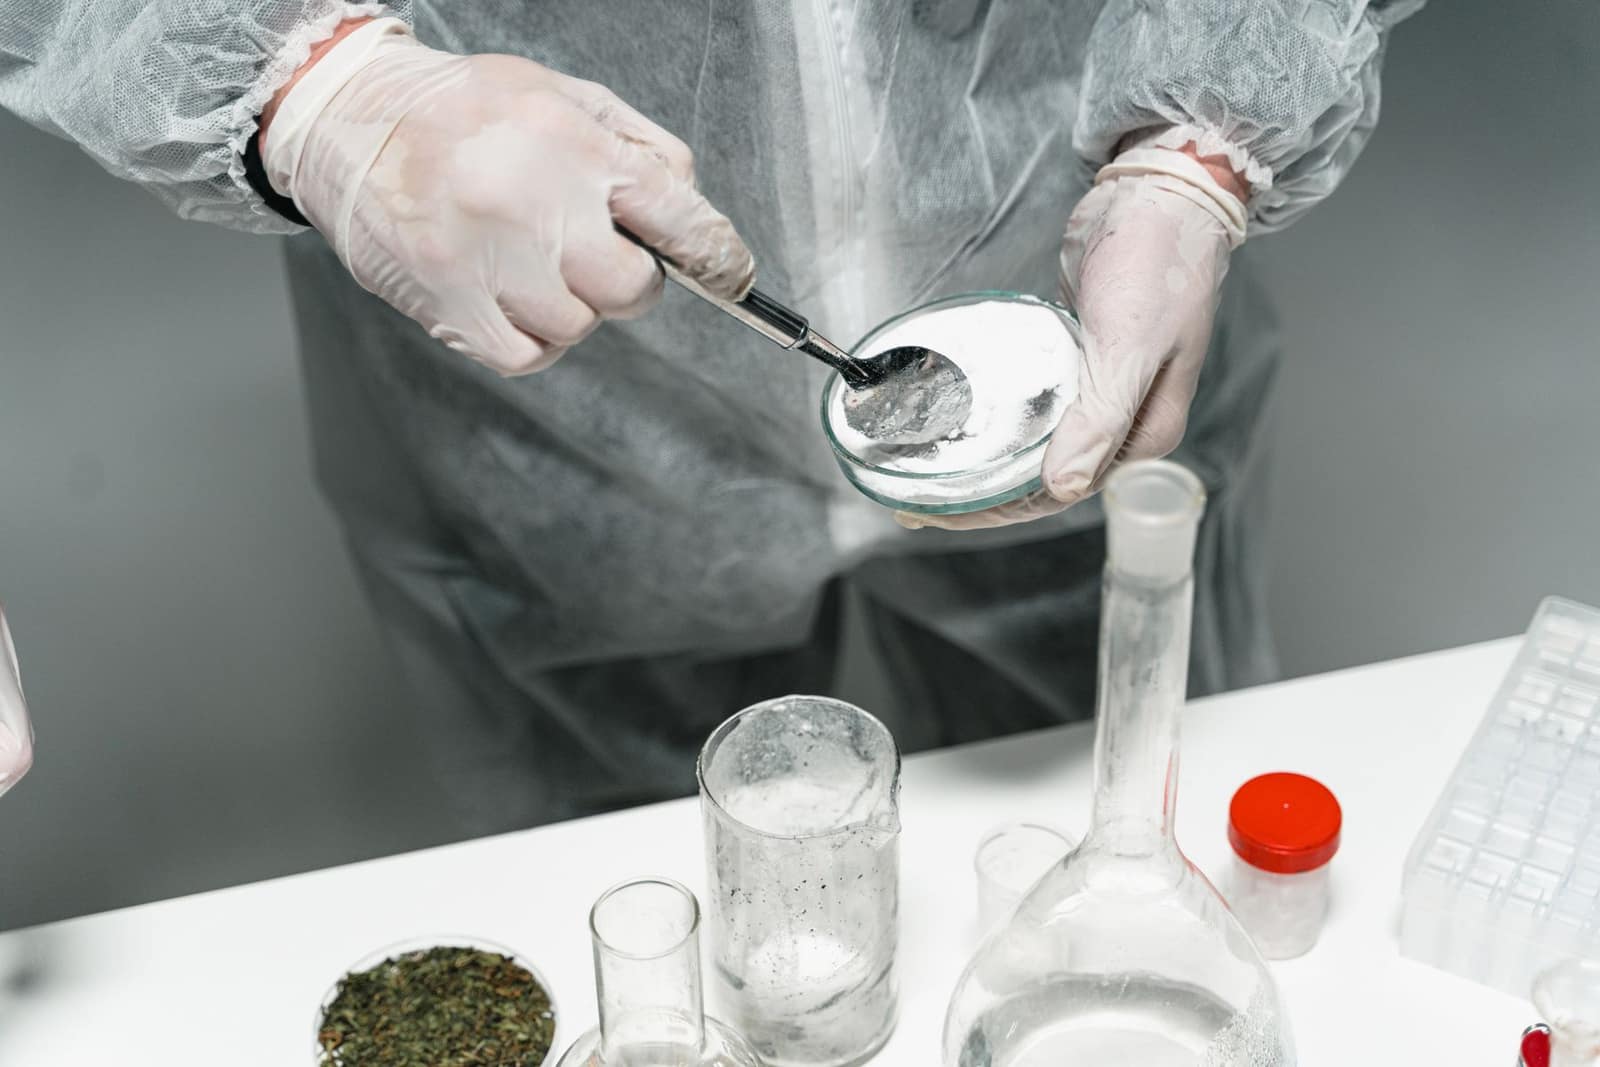 Free to exportPharma & chemicalsBulk drugs (APIs)APIs and intermediates from Hyderabad, Visakhapatnam and Gujarat; regulated buyers need DMFs and GMP inspections.HS2933Exports 2025-26US$ 7.78 bn ↓0.6%
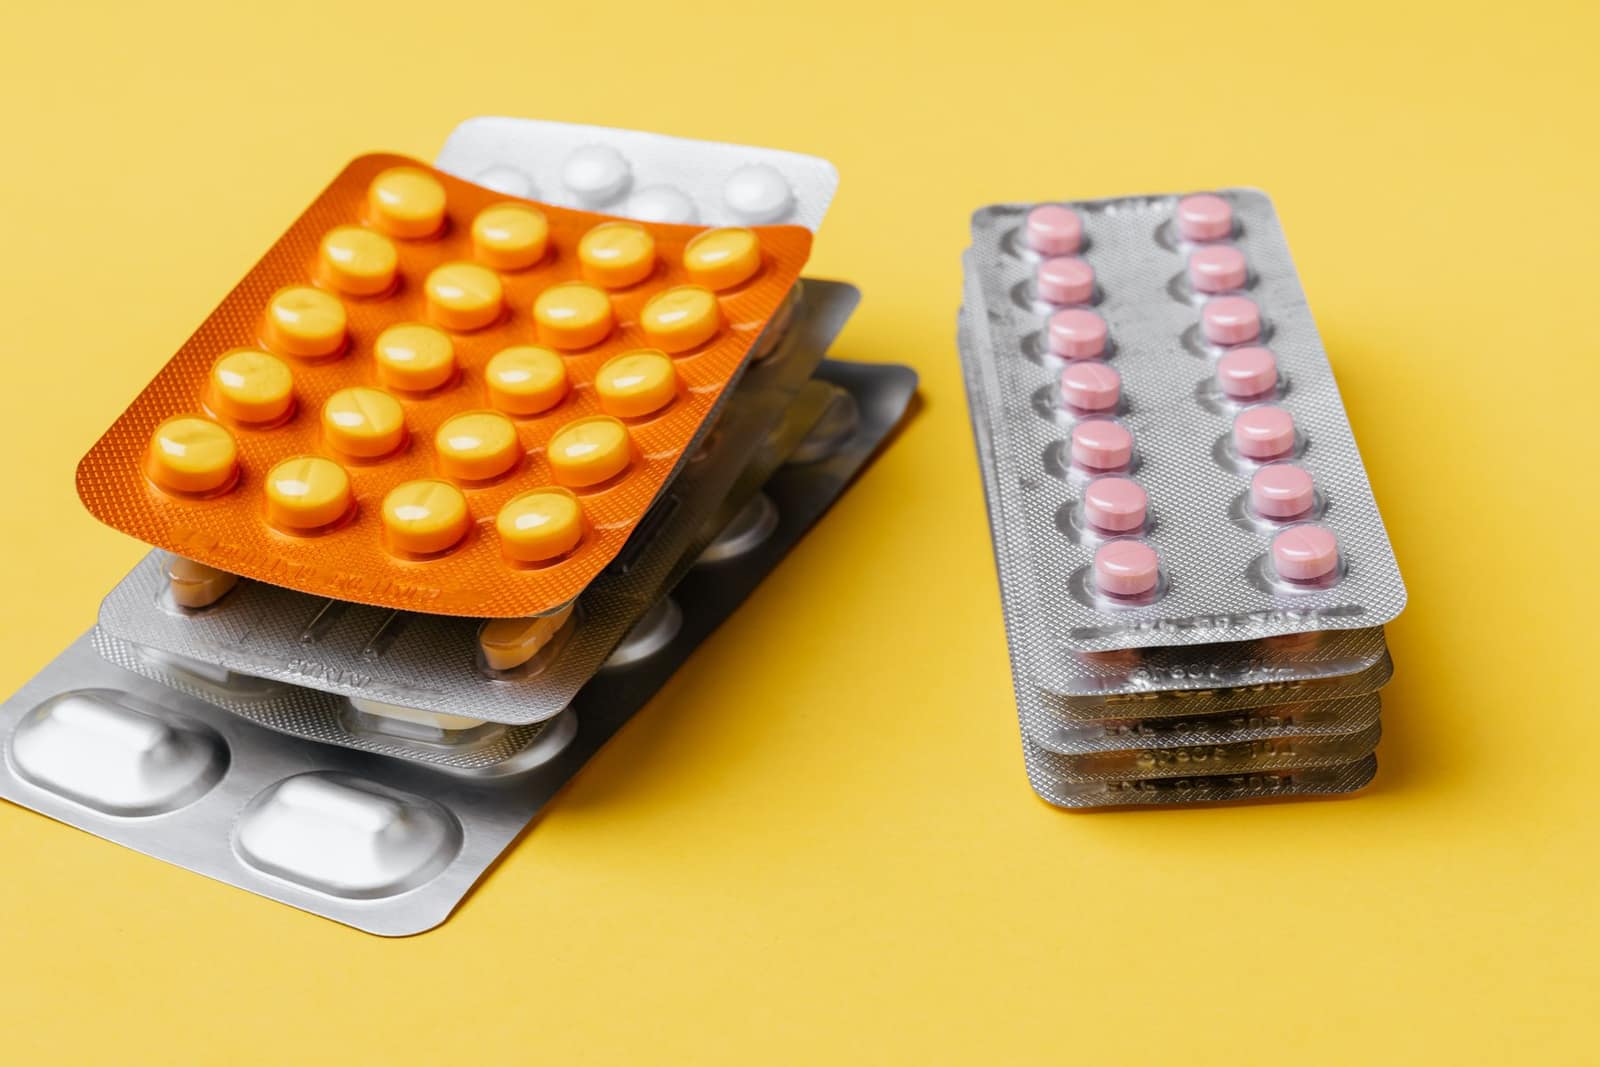 Free to exportPharma & chemicalsGeneric medicines (formulations)Tablets, capsules and injectables; every market needs product registration. The USA buys the most.HS3004Exports 2025-26US$ 21.9 bn ↓0.7%
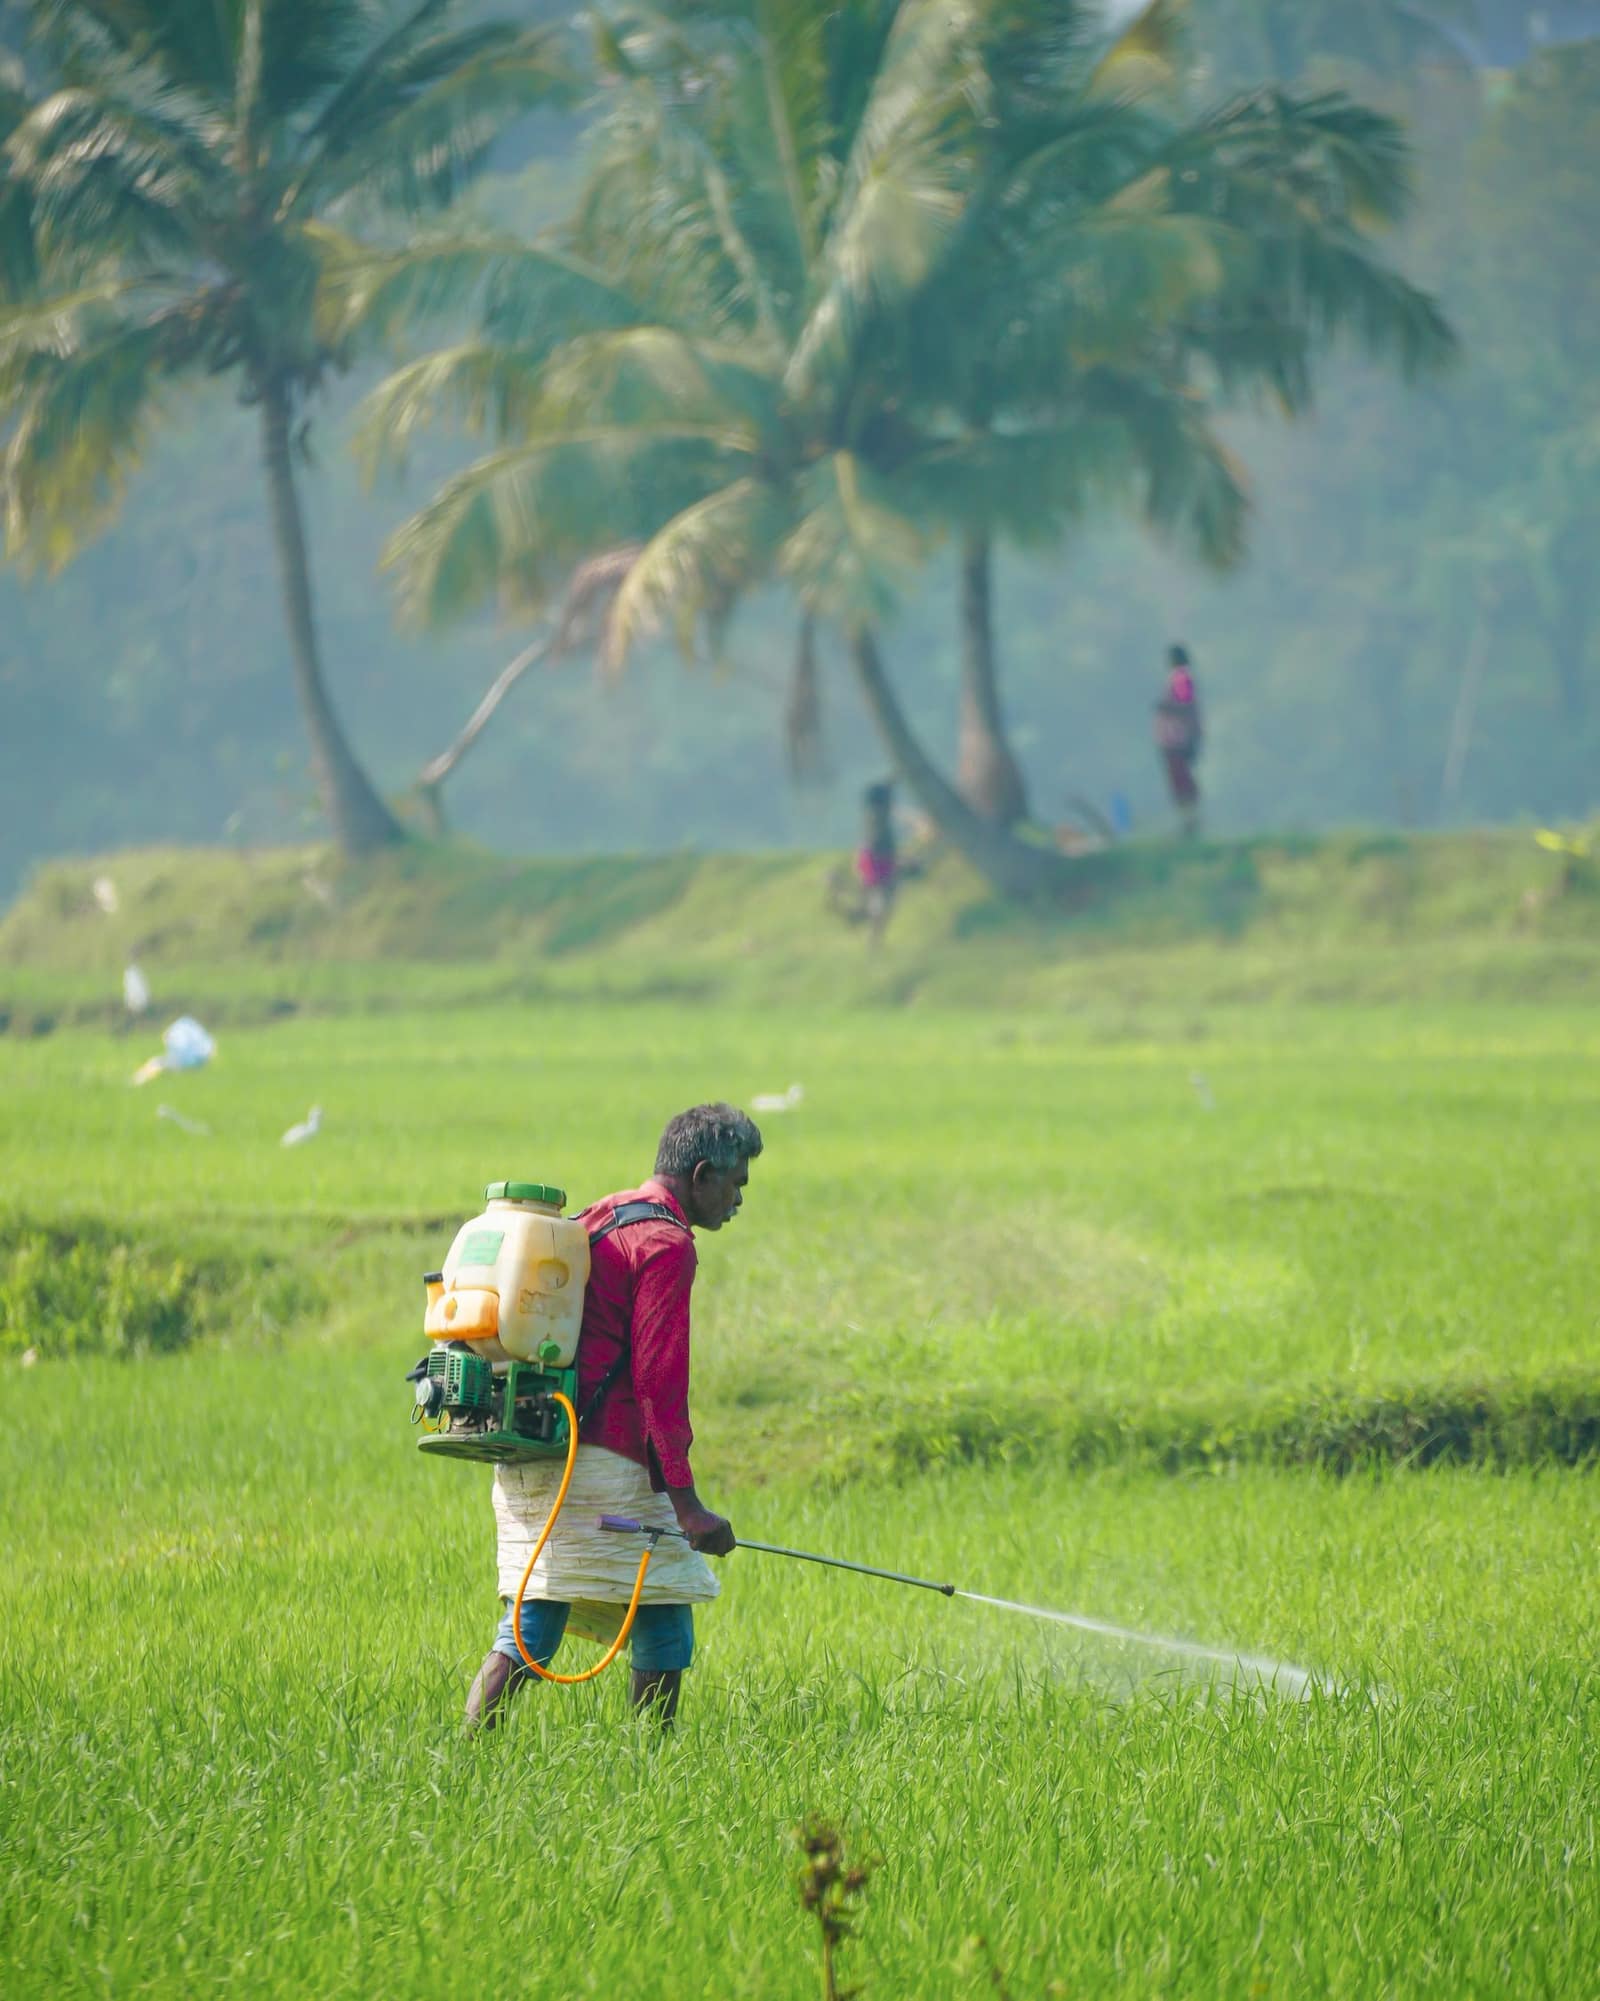 Free to exportPharma & chemicalsAgrochemicals (pesticides)Generic insecticides, fungicides and herbicides; Brazil and the USA are by far the largest buyers.HS3808Exports 2025-26US$ 3.87 bn ↓9.4%
 Free to exportEngineering goodsIron and steel castingsGrey and ductile iron and steel castings from Kolhapur, Rajkot, Coimbatore and Howrah; the USA leads.HS7325Exports 2025-26US$ 1.25 bn ↑3.2%
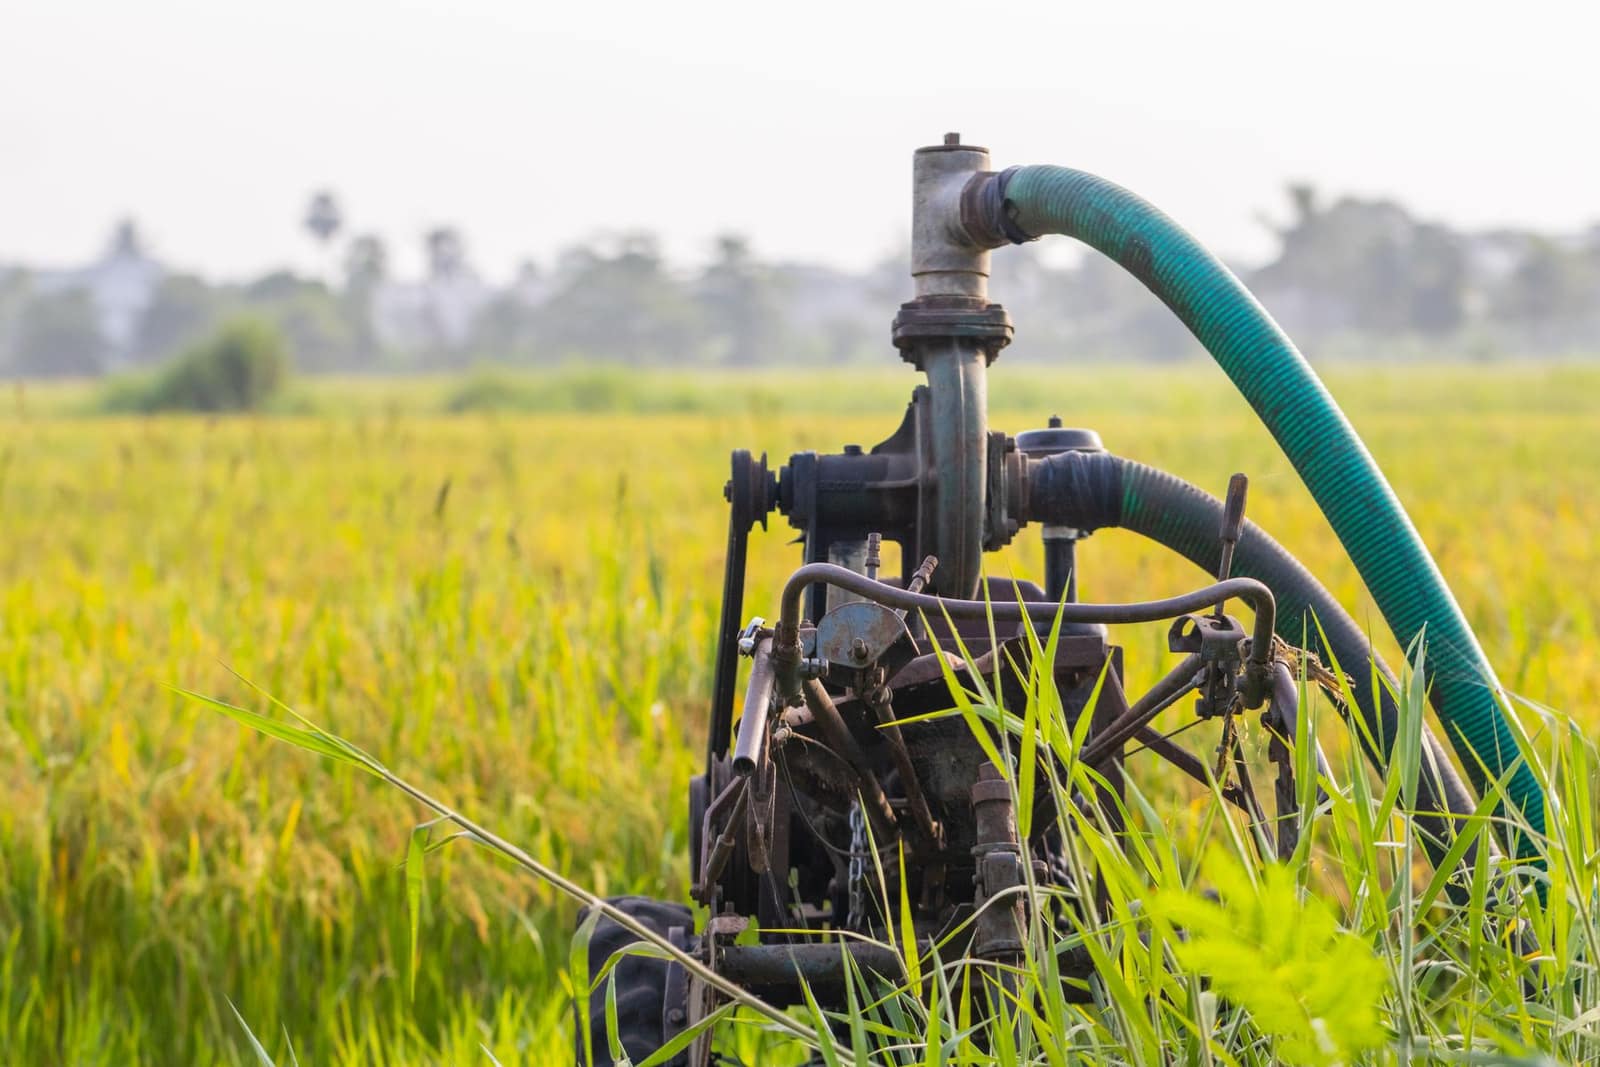 Free to exportEngineering goodsPumpsAgricultural, domestic and industrial pumps from Coimbatore, Rajkot and Ahmedabad; the USA leads.HS8413Exports 2025-26US$ 1.6 bn ↑5.2%
More in Americas
 USDWashington, D.C.United States of AmericaIndia's largest single-country export market. Strict FDA rules for food; extra 10% US duty on most goods since July 2026.From India 2025-26US$ 87.3 bn
 CADOttawaCanadaLarge Indian diaspora market. Importer needs a CFIA licence for food; labels in English and French.From India 2025-26US$ 4.67 bn
 PTABRLBrasíliaBrazilLatin America's largest economy. Buys Indian fuels, agrochemicals, medicines, vehicles and yarn; MERCOSUR PTA applies.From India 2025-26US$ 7.02 bn
 PTAARSBuenos AiresArgentinaBig South American market for Indian chemicals, agrochemicals, vehicles and medicines. Import and currency rules change often.From India 2025-26US$ 1.01 bn