

Americas
Export to Brazil
Latin America's largest economy. Buys Indian fuels, agrochemicals, medicines, vehicles and yarn; MERCOSUR PTA applies.
- Capital
- Brasília
- Currency
- BRL
- Trade agreement with India
- India–MERCOSUR Preferential Trade Agreement (PTA) 1 June 2009
- Main ports
- Santos, Paranaguá, Itajaí / Navegantes
Brazil is India's largest trading partner in Latin America. Its huge farm sector buys Indian agrochemicals, and its health system buys Indian medicines and bulk drugs. Duties and taxes are high and paperwork is detailed, so most Indian exporters work through an experienced Brazilian importer.
The PTA gives limited duty cuts (on about 450 tariff lines each way, with preference margins of 10% to 100%). Check whether your HS code is on Brazil's list before relying on it. Negotiations to expand the PTA were launched on 14 September 2026, when a protocol accepting electronic certificates of origin was also signed. Get the PTA certificate of origin through DGFT's online platform.
What it buys from India
- Diesel and other petroleum products
- Agrochemicals and organic chemicals
- Medicines and bulk drugs
- Vehicles and auto parts, cotton and synthetic yarn
Import rules on their side
- The importer must be authorised in Siscomex (the RADAR registration) before it can clear goods.
- Products of plant or animal origin and agrochemicals need clearance from the Ministry of Agriculture (MAPA); medicines, cosmetics and many foods are regulated by ANVISA, and registration can take months.
- Goods under compulsory certification (for example some electrical items, tyres and toys) need INMETRO conformity. Labels must be in Portuguese.
Practical tips
- Brazil's landed cost is far above CIF because of several layered taxes. Let the buyer calculate it before you negotiate price.
- Portuguese documents and a local partner make a big difference. Trade fairs such as Hospitalar (health) and APAS Show (food retail) in São Paulo are good meeting points.
- Ask for an advance or an LC from a new buyer; check ECGC cover before giving credit.
Sources (8)
- All India Radio News — Piyush Goyal and Uruguay Foreign Minister announce launch of India-MERCOSUR trade talks (14 Sep 2026)
- Uruguay Ministry of Foreign Affairs — Joint communiqué on launching negotiations to expand the MERCOSUR-India PTA
- DGFT — Common Digital Platform for Certificate of Origin
- Ministry of Agriculture and Livestock, Brazil (MAPA)
- ANVISA — Brazilian Health Regulatory Agency
- INMETRO — National Institute of Metrology, Quality and Technology, Brazil
- Portal Siscomex — Brazil foreign trade single window
- Department of Commerce — TradeStat export-import data bank
Trade data
India’s exports to Brazil in numbers
From the Department of Commerce’s TradeStat (Indian financial years, April–March), the country’s imports from the world from UN Comtrade, and its basics from the World Bank.
- India’s exports here, 2025-26
- US$ 7.02 bn No. 15 of our 80 countries
- Change from 2024-25
- ↑ +3.7% US$ 6.77 bn → US$ 7.02 bn
- Share of all Indian exports
- 1.59%
- Its imports from the world
- —
What India sells here most
By HS chapter, 2025-26. Change is against 2024-25.
What is rising and what is falling
Chapters where India sells at least US$ 5 million. Change from 2024-25 to 2025-26.
↑ High demand
- FertilisersUS$ 32.4 mn → US$ 66.1 mn↑+103.8%
- Organic chemicalsUS$ 728 mn → US$ 924 mn↑+27%
- Vehicles and partsUS$ 691 mn → US$ 825 mn↑+19.5%
- Instruments, medical devicesUS$ 108 mn → US$ 127 mn↑+17.5%
- Medicines and pharmaUS$ 520 mn → US$ 604 mn↑+16.1%
- Inorganic chemicalsUS$ 54 mn → US$ 61.1 mn↑+13.2%
- Iron and steelUS$ 154 mn → US$ 170 mn↑+10.4%
↓ Low demand
- Man-made filamentsUS$ 144 mn → US$ 84.6 mn↓-41.4%
- Dyes, paints, inksUS$ 139 mn → US$ 113 mn↓-18.3%
- Other chemical productsUS$ 1.16 bn → US$ 980 mn↓-15.8%
- Iron and steel articlesUS$ 106 mn → US$ 91.9 mn↓-13.4%
- Soaps, detergents, waxesUS$ 48.2 mn → US$ 41.7 mn↓-13.4%
- PlasticsUS$ 119 mn → US$ 104 mn↓-12.3%
Our product guides that sell here
India’s exports of each product to this country, 2025-26.
The 20 biggest export lines
4-digit HS lines, 2025-26, with their Harmonized System descriptions.
What India buys from Brazil
India’s imports from this country in 2025-26 by HS chapter, from TradeStat — this country can be your supplier too.
- India’s imports, 2025-26
- US$ 8.05 bn US$ 5.44 bn → US$ 8.05 bn
- India’s exports, 2025-26
- US$ 7.02 bn
- Trade balance
- −US$ 1.03 bn exports minus imports
- Change in imports
- +48.1%
The country at a glance
- Population
- 213 mn 2025
- GDP
- US$ 2,279.9 bn 2025
- GDP per person
- US$ 10,713 2025
- Imports (goods and services)
- US$ 398.3 bn 2025
Sources: TradeStat — Export Import Data Bank, Department of Commerce · World Bank — World Development Indicators · Figures taken 29 October 2026.
What to send to Brazil
All products →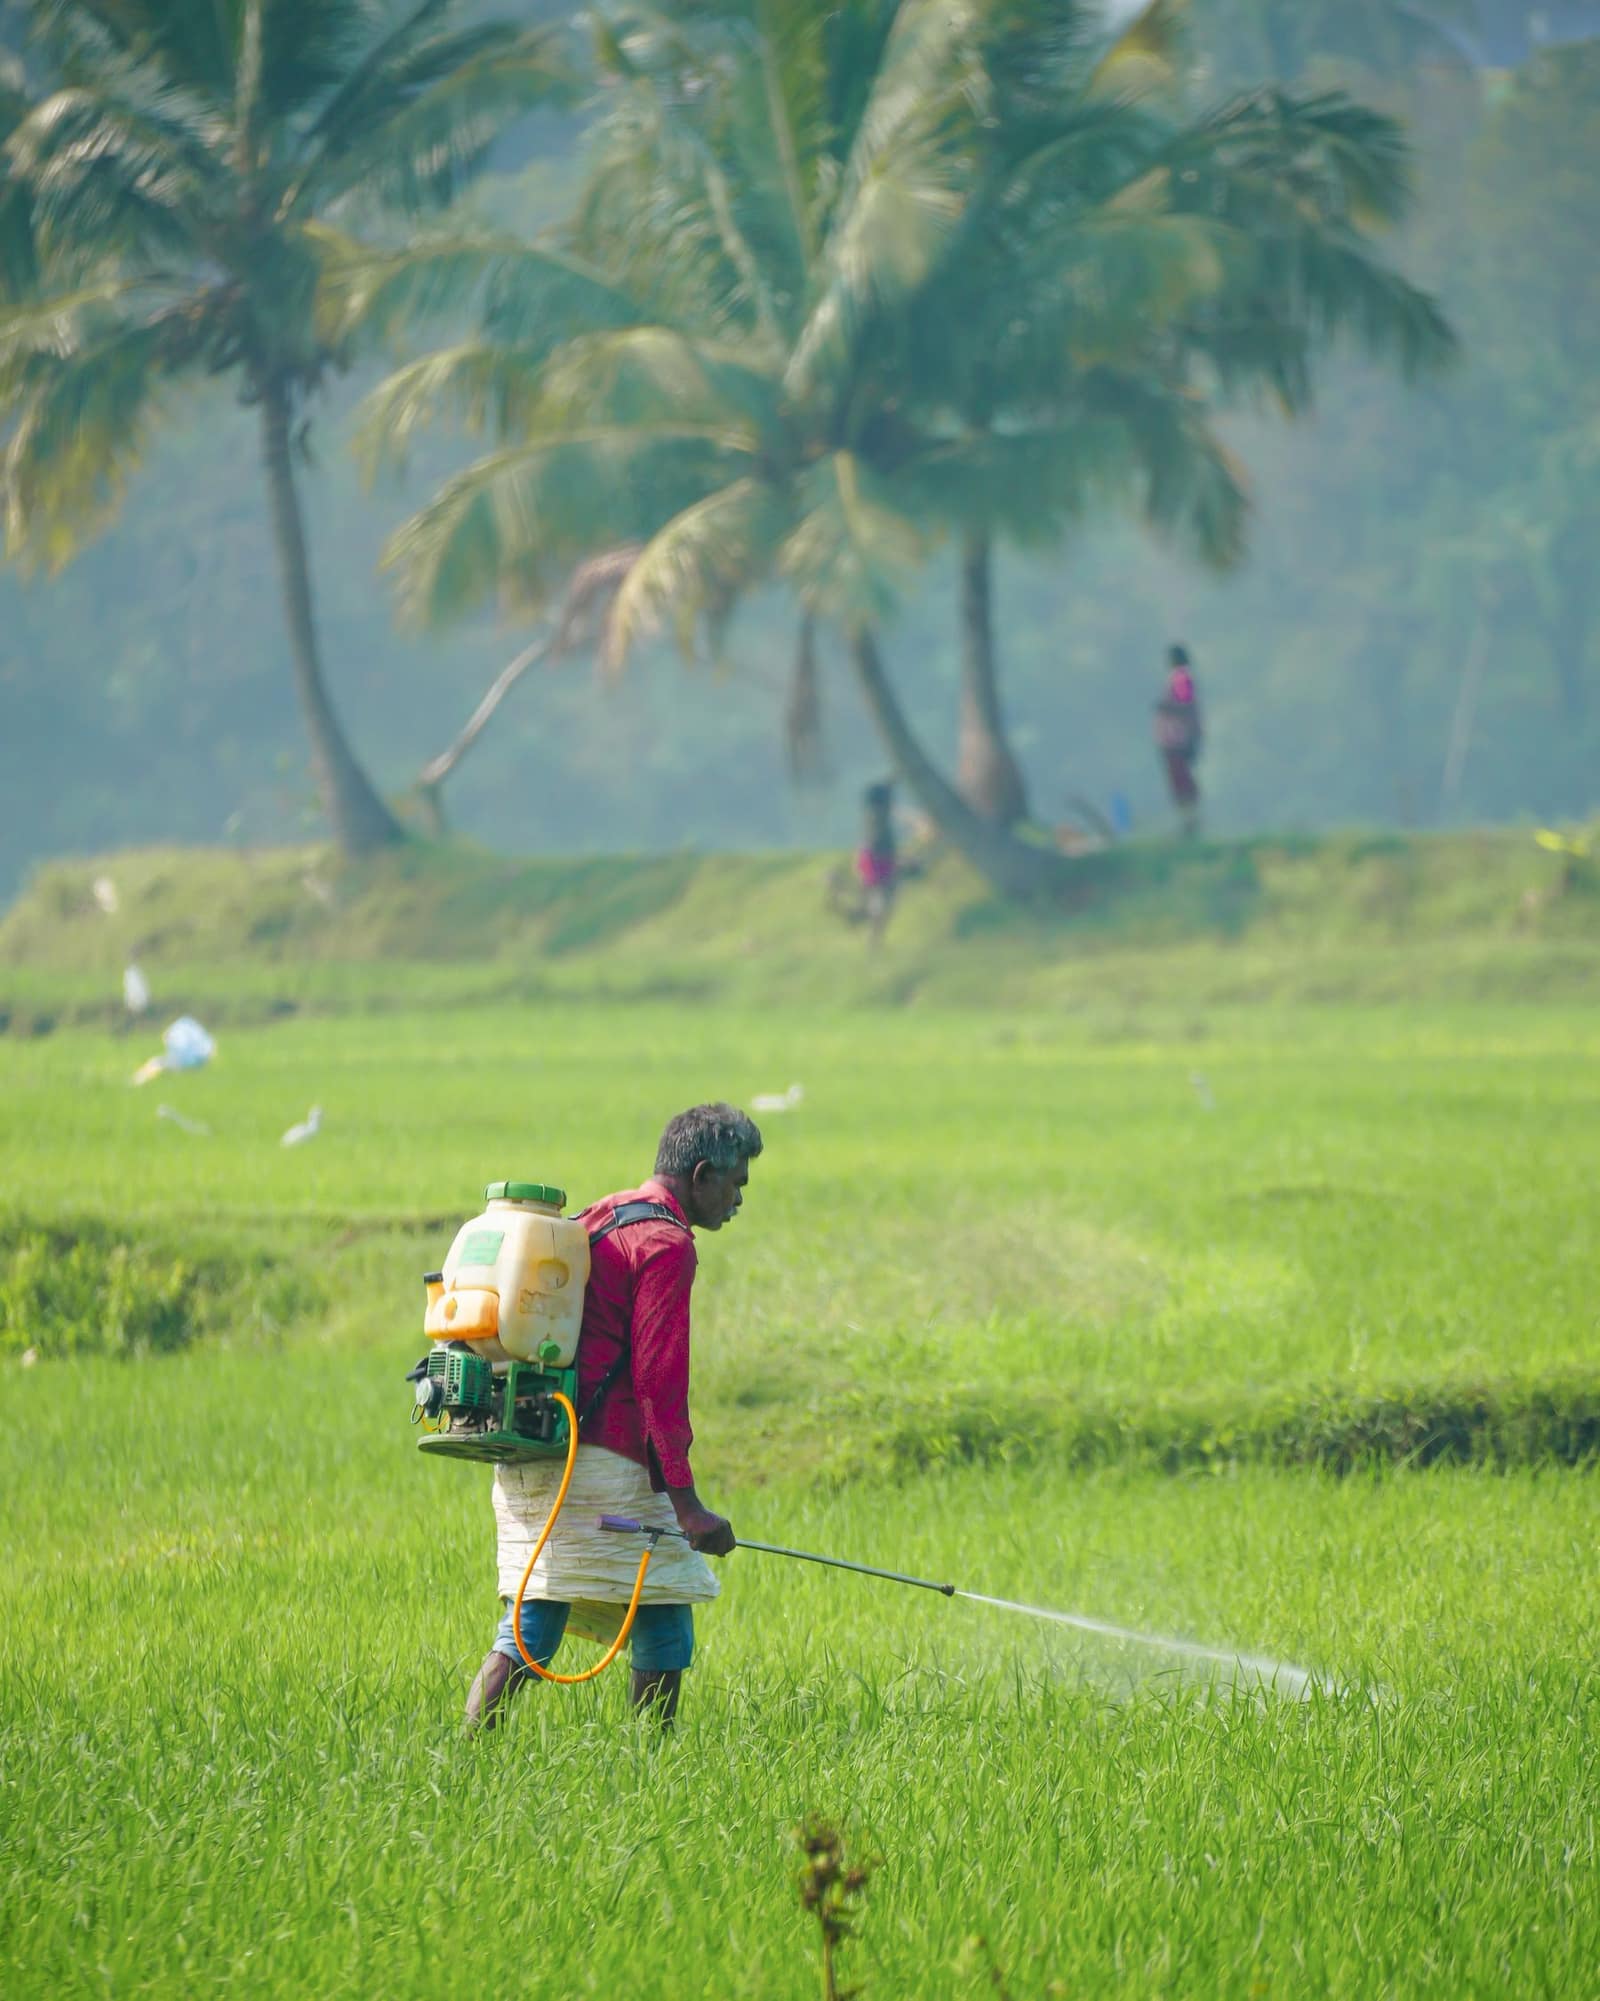 Free to exportPharma & chemicalsAgrochemicals (pesticides)Generic insecticides, fungicides and herbicides; Brazil and the USA are by far the largest buyers.HS3808Exports 2025-26US$ 3.87 bn ↓9.4%
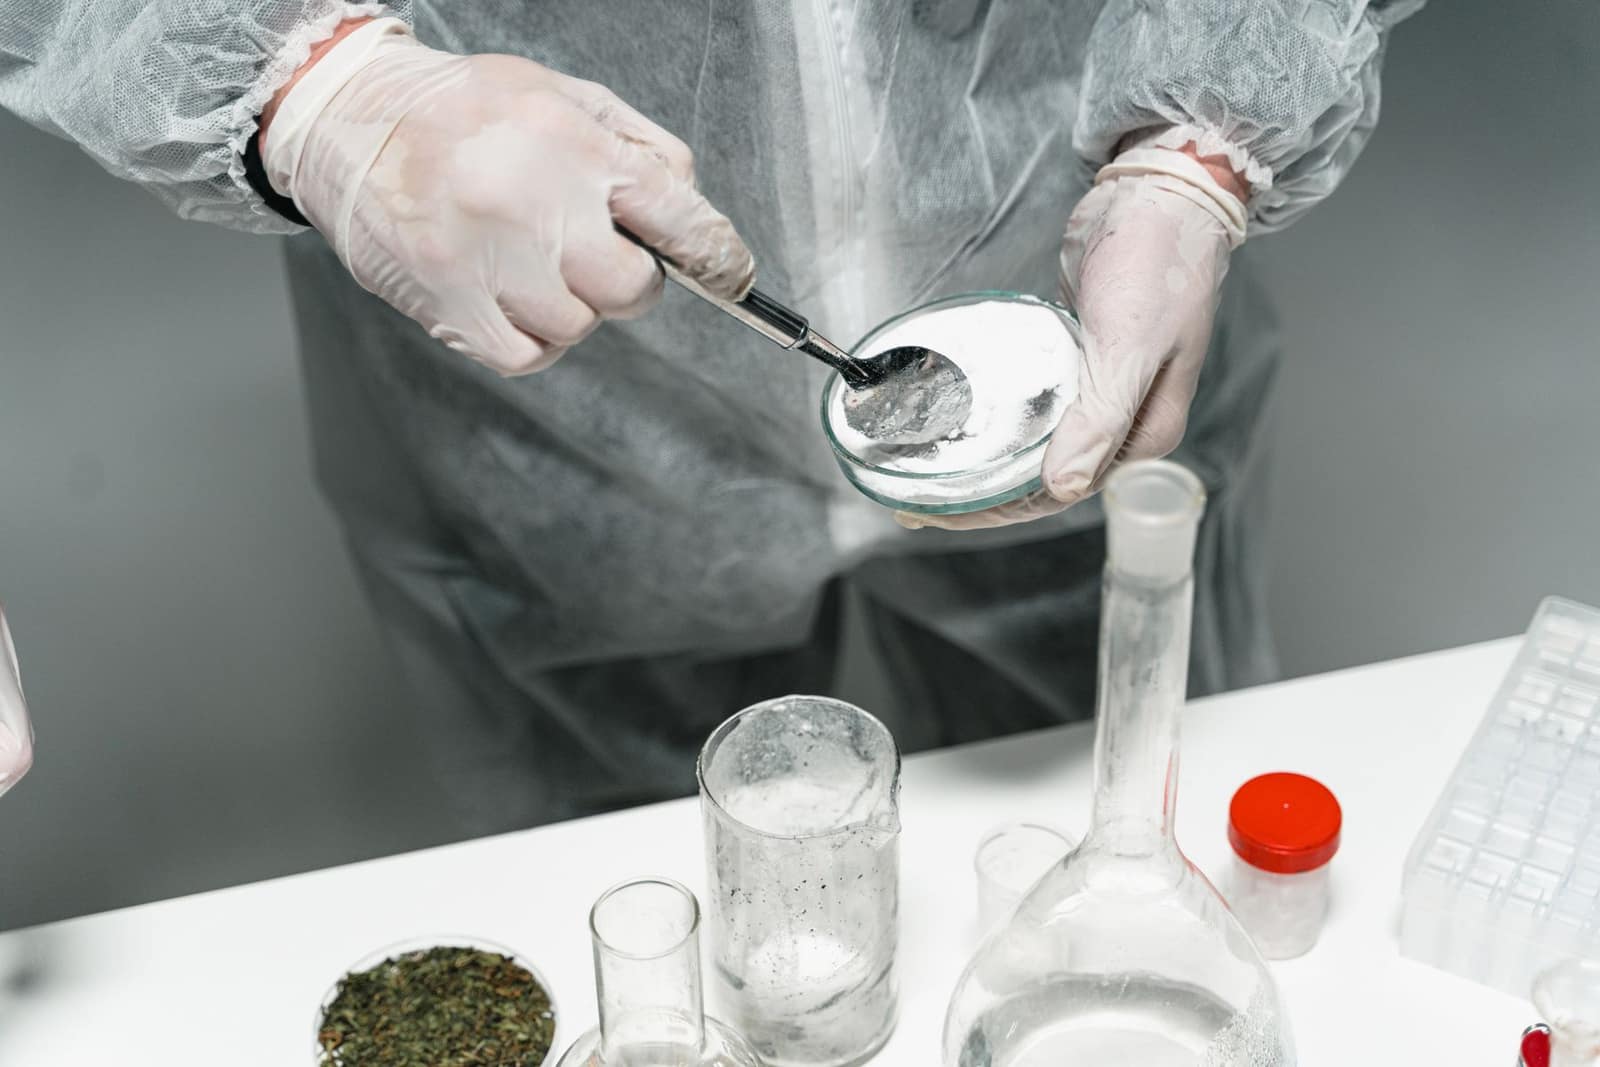 Free to exportPharma & chemicalsBulk drugs (APIs)APIs and intermediates from Hyderabad, Visakhapatnam and Gujarat; regulated buyers need DMFs and GMP inspections.HS2933Exports 2025-26US$ 7.78 bn ↓0.6%
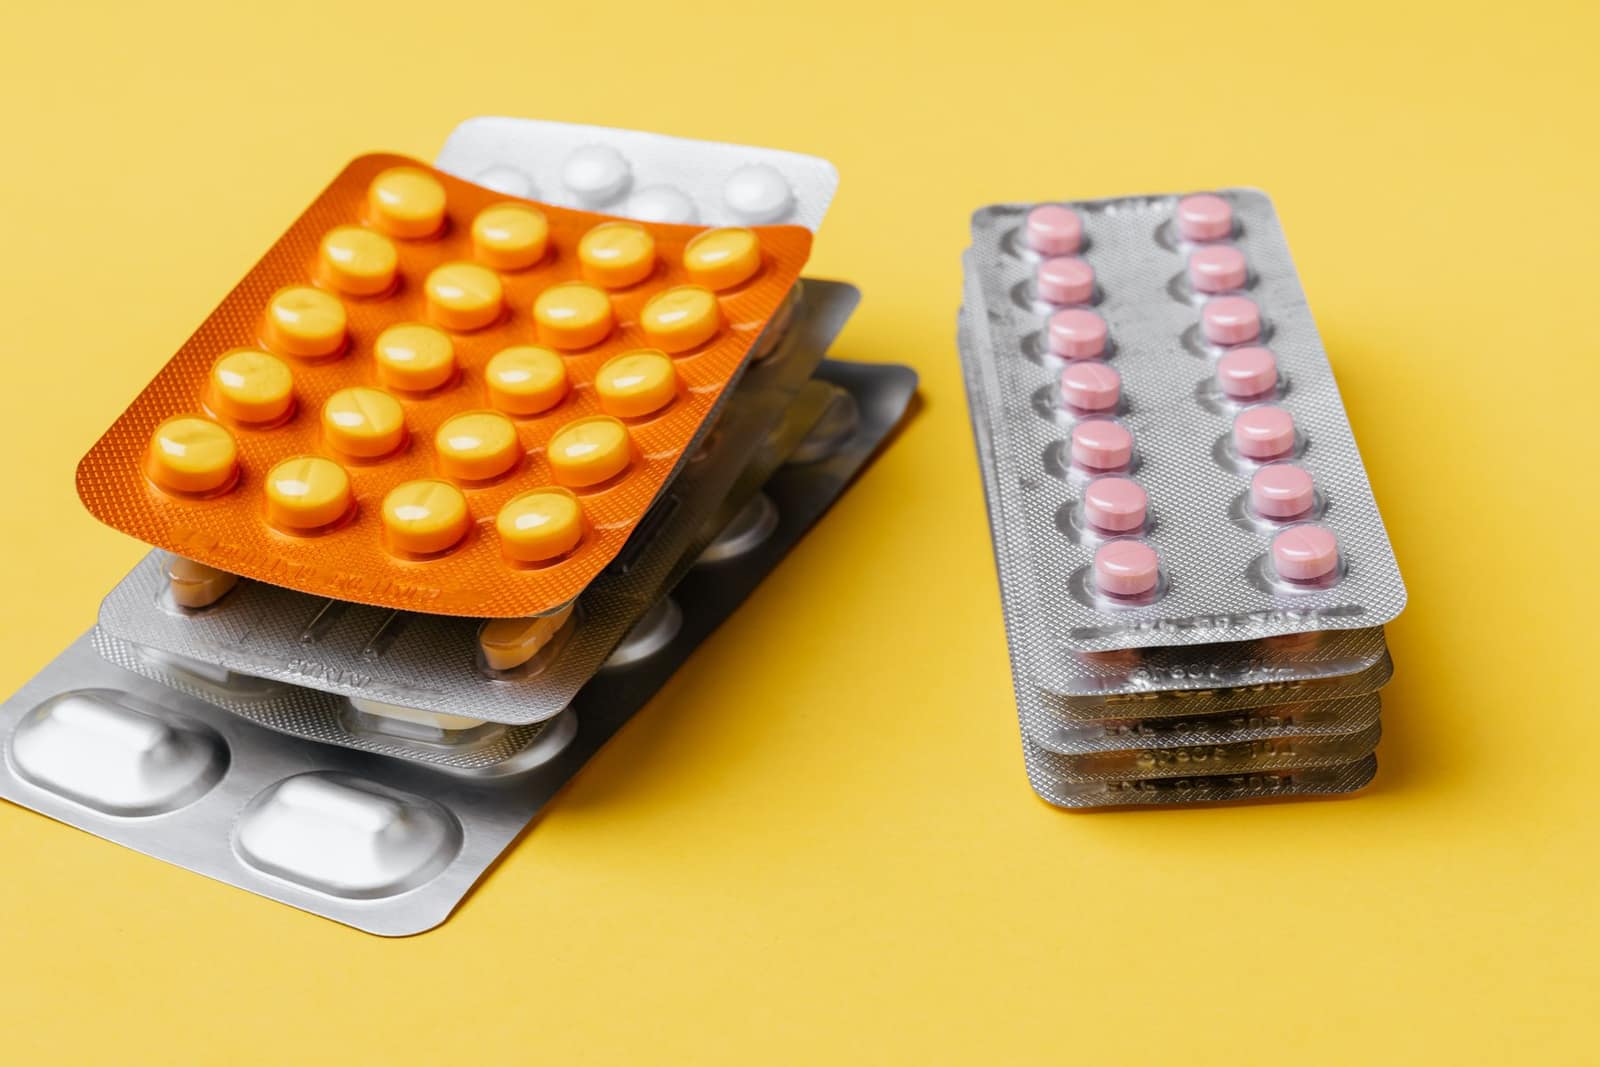 Free to exportPharma & chemicalsGeneric medicines (formulations)Tablets, capsules and injectables; every market needs product registration. The USA buys the most.HS3004Exports 2025-26US$ 21.9 bn ↓0.7%
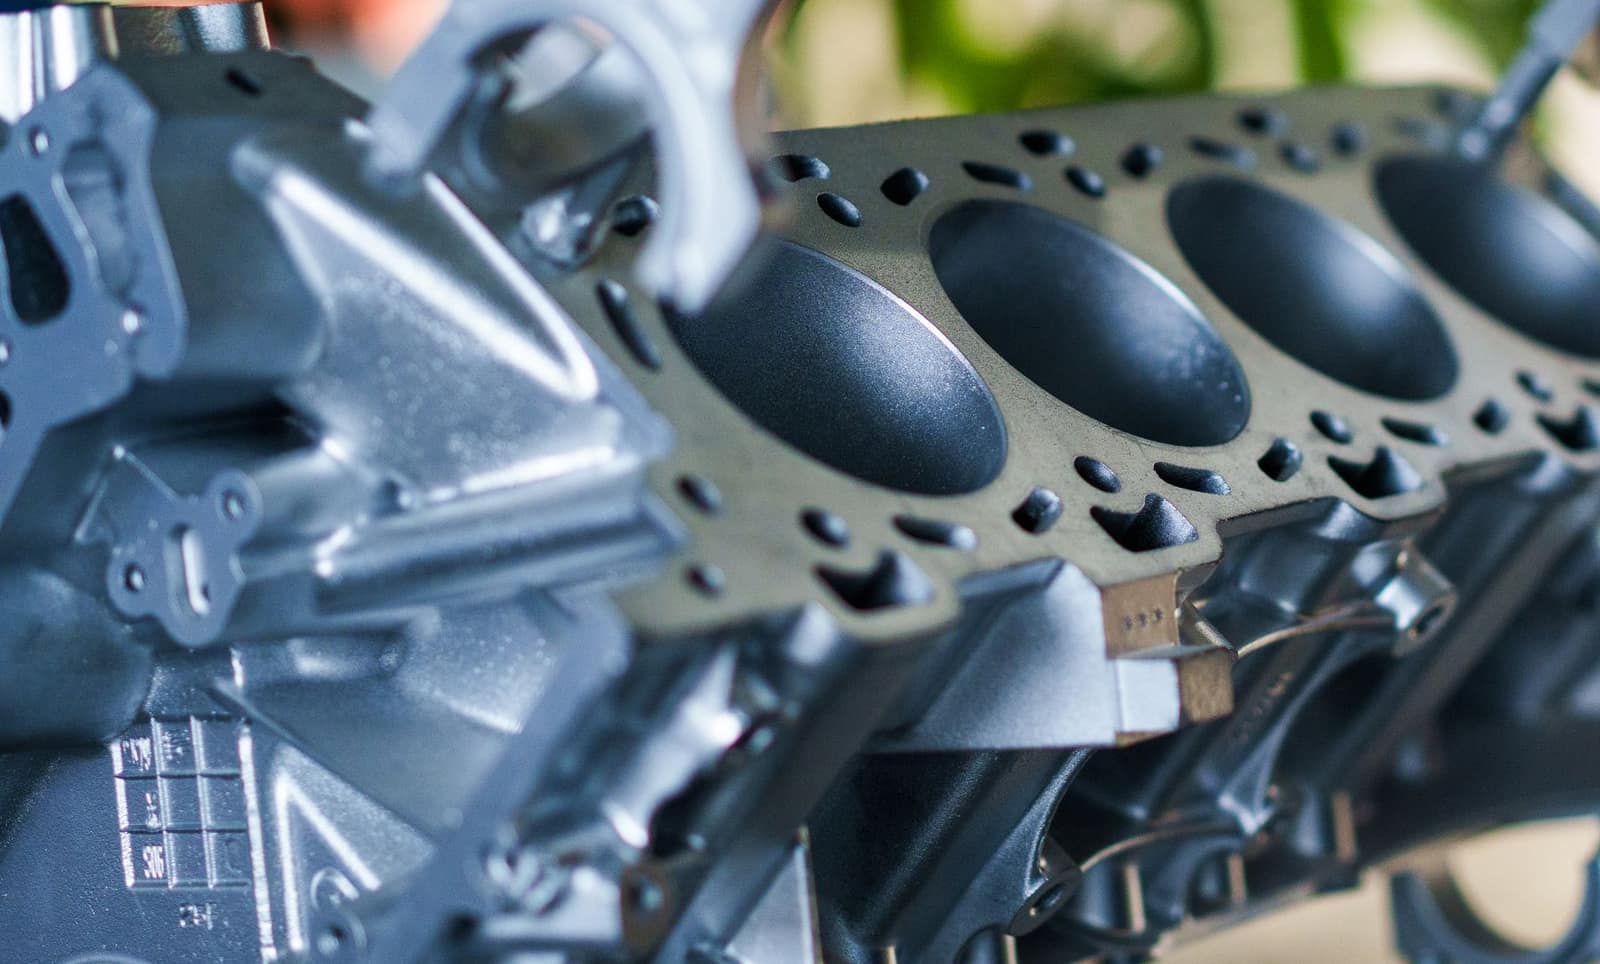 Free to exportEngineering goodsAuto parts and componentsOEM and aftermarket vehicle parts; the USA, Germany and Italy buy most, with strong demand in Latin America.HS8708Exports 2025-26US$ 7.64 bn ↑1.8%
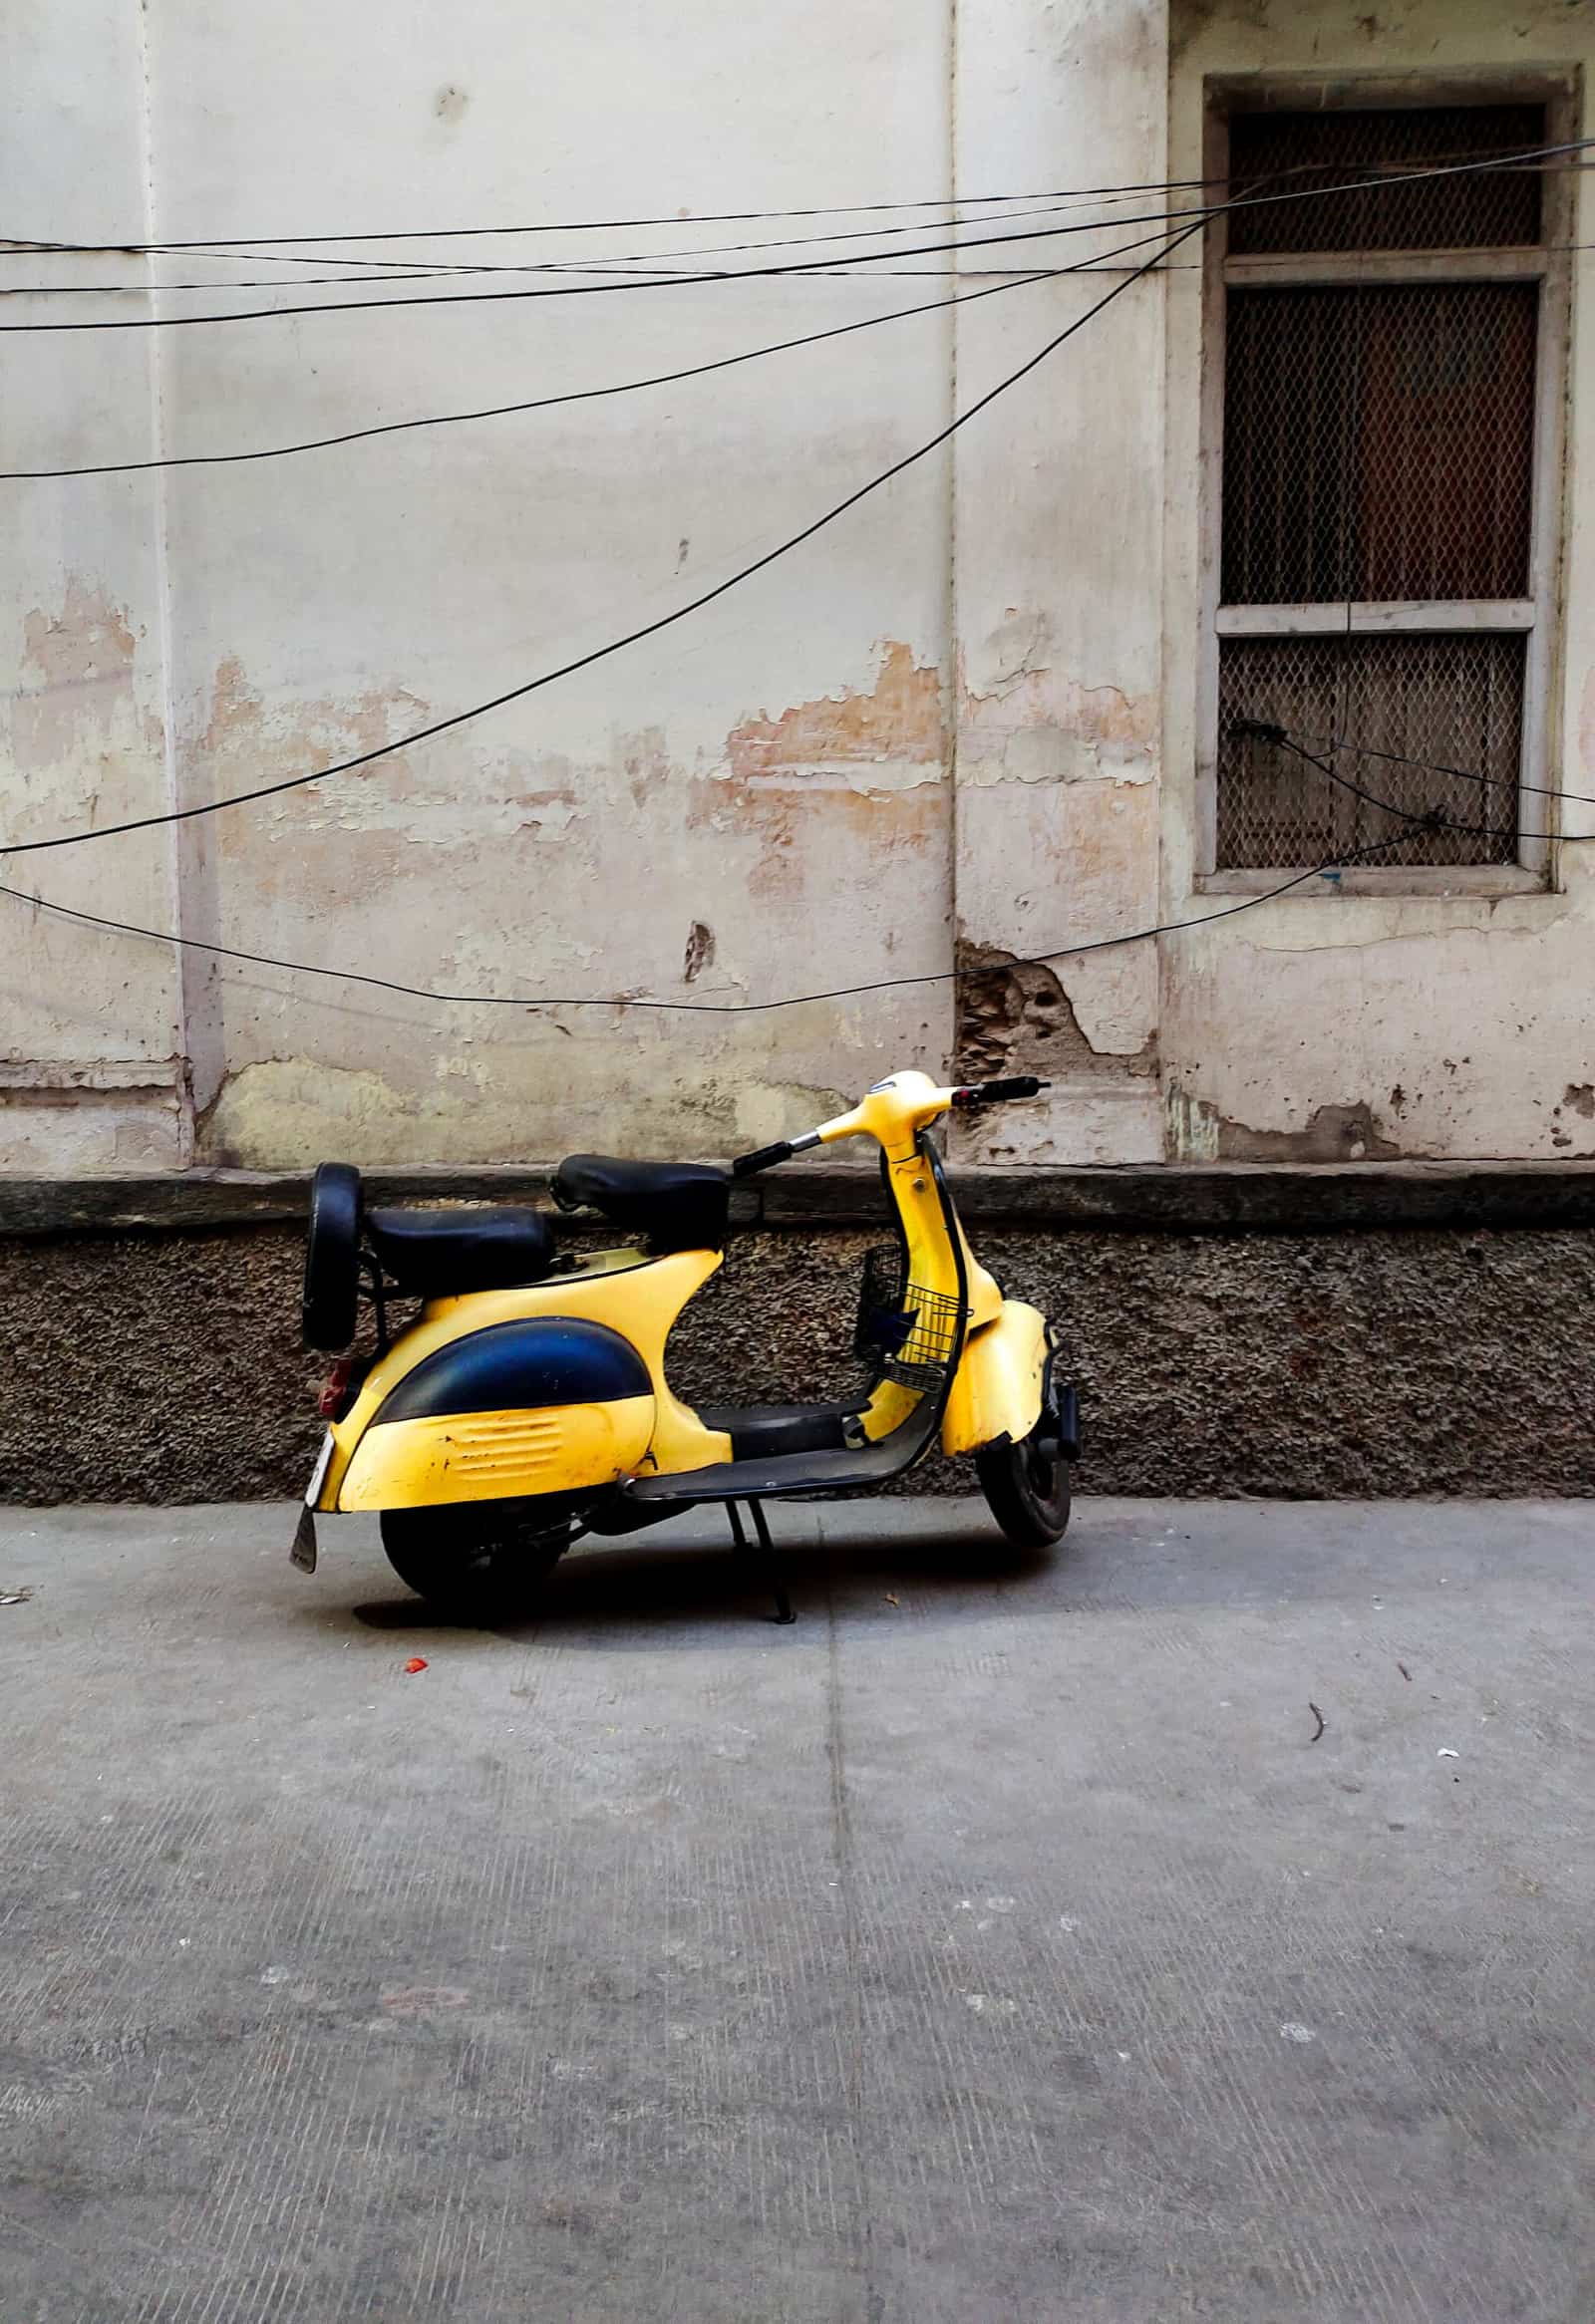 Free to exportEngineering goodsMotorcycles and scootersCommuter motorcycles and scooters for Latin America, Africa and South Asia; India is a top exporter.HS8711Exports 2025-26US$ 3.98 bn ↑24.2%
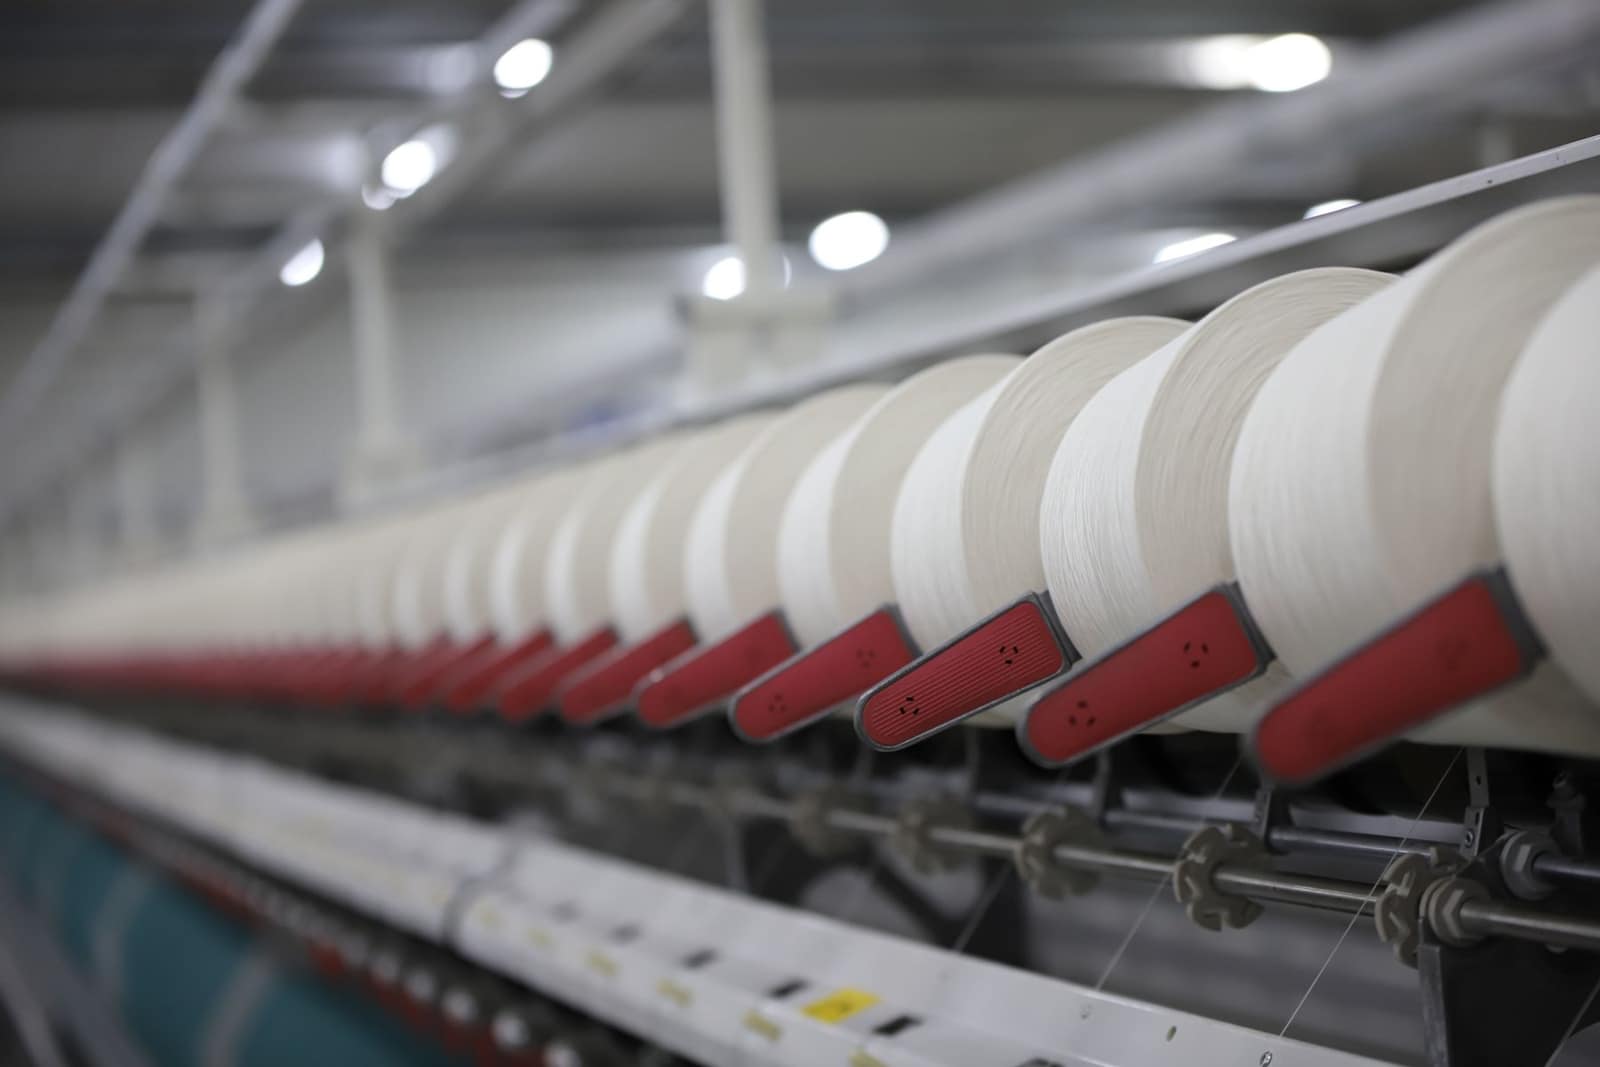 Free to exportTextiles & apparelCotton yarnBulk cotton yarn sold to weaving and knitting mills abroad; Bangladesh is by far the largest buyer.HS5205Exports 2025-26US$ 3.22 bn ↓4.1%
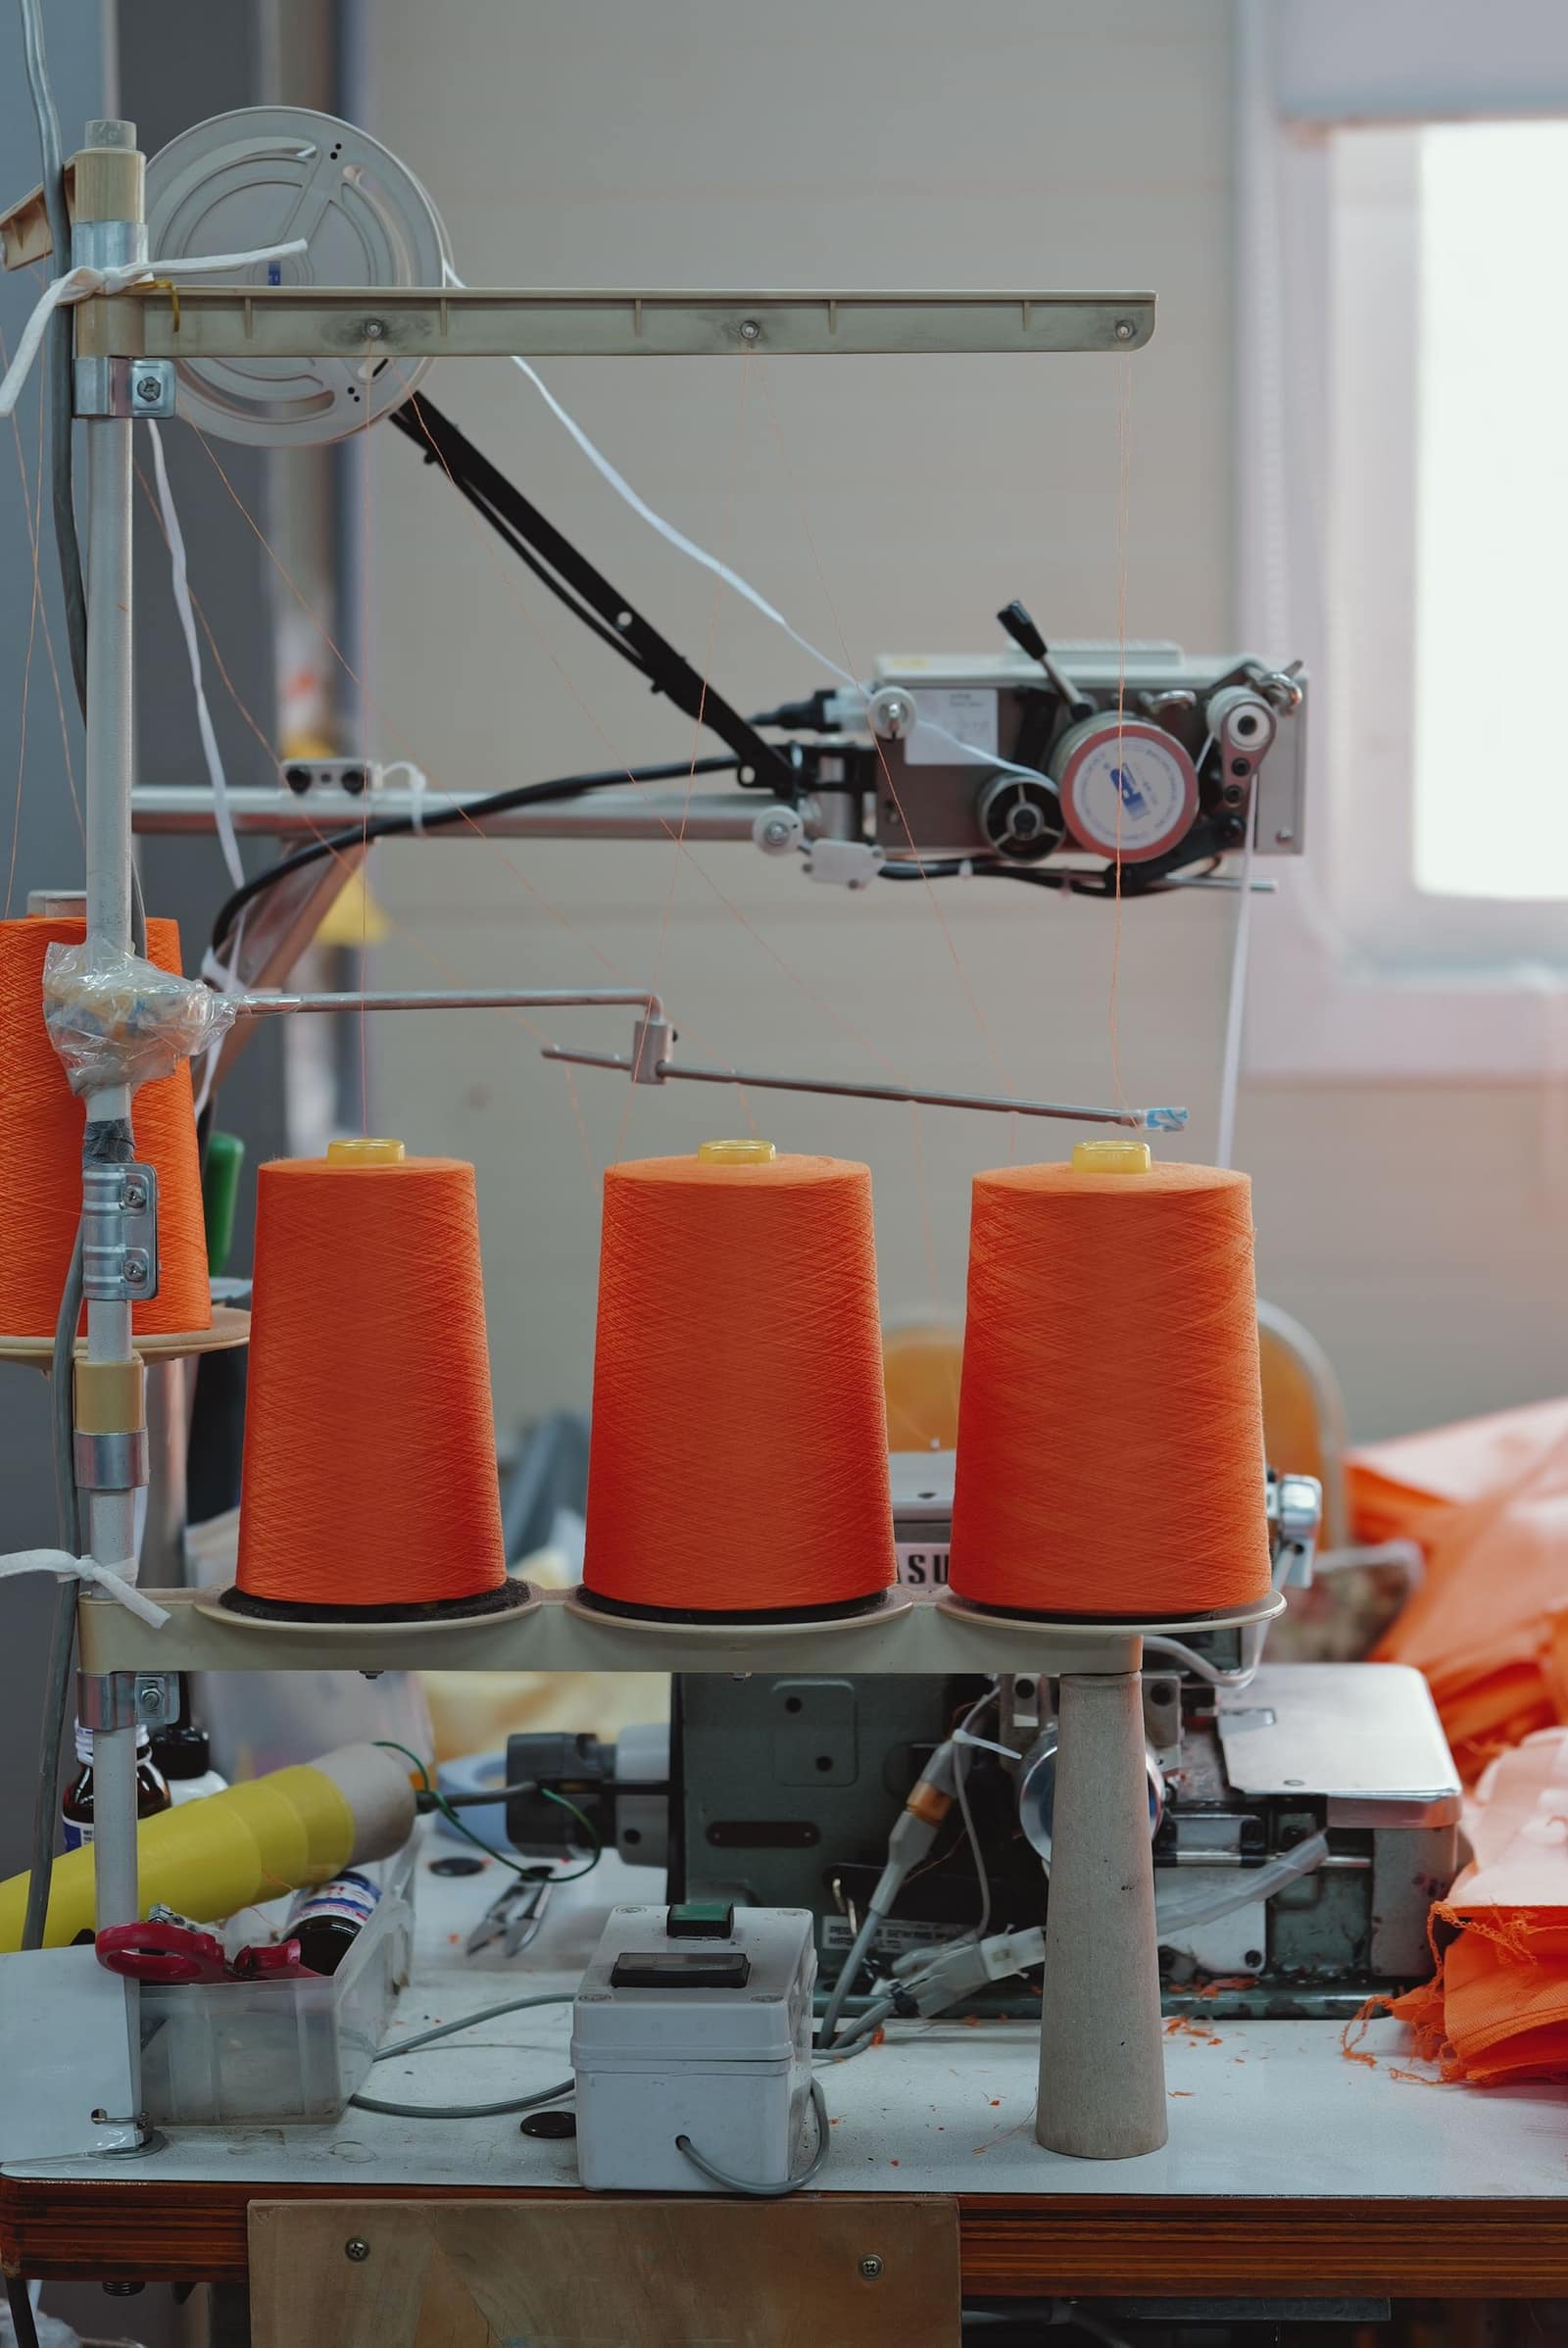 Free to exportTextiles & apparelPolyester and synthetic yarnPolyester filament and spun yarns from Surat, Silvassa and Bhilwara, sold to weavers and knitters abroad.HS5402Exports 2025-26US$ 1.06 bn ↓16.8%
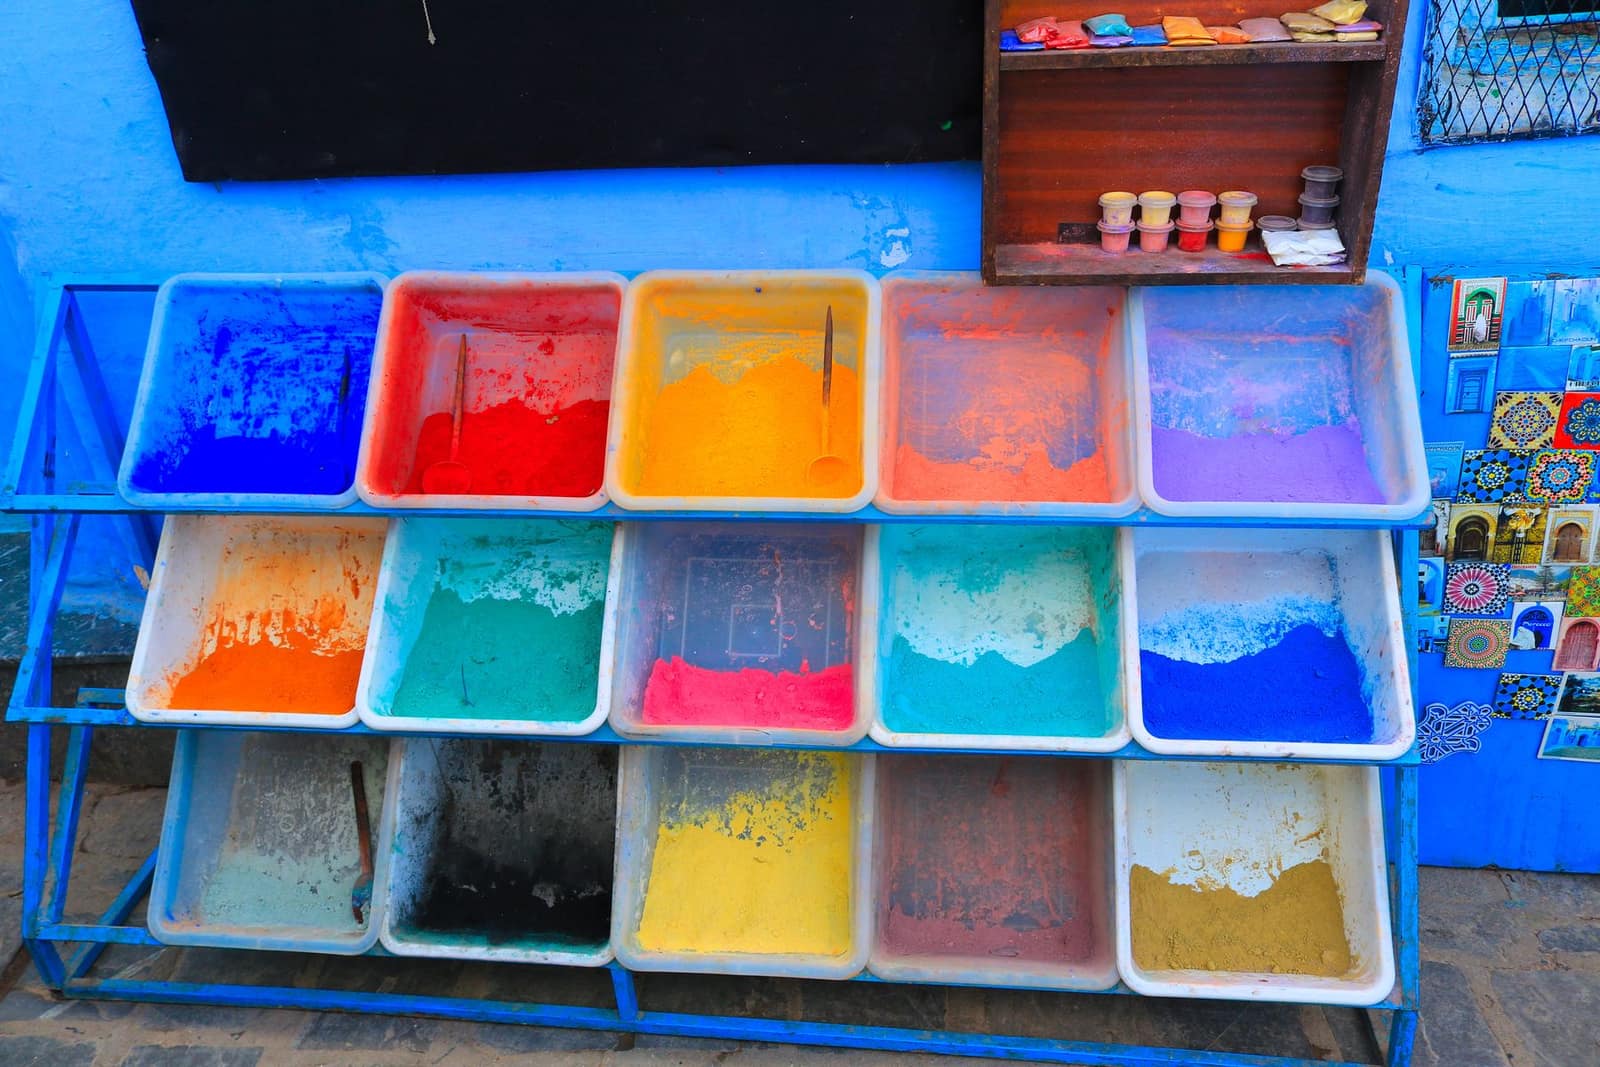 Free to exportPharma & chemicalsDyes and pigmentsReactive and disperse dyes and organic pigments from Gujarat and Maharashtra; textile hubs in Asia and Europe buy them.HS3204Exports 2025-26US$ 2.46 bn ↓8.7%
More in Americas
 USDWashington, D.C.United States of AmericaIndia's largest single-country export market. Strict FDA rules for food; extra 10% US duty on most goods since July 2026.From India 2025-26US$ 87.3 bn
 CADOttawaCanadaLarge Indian diaspora market. Importer needs a CFIA licence for food; labels in English and French.From India 2025-26US$ 4.67 bn
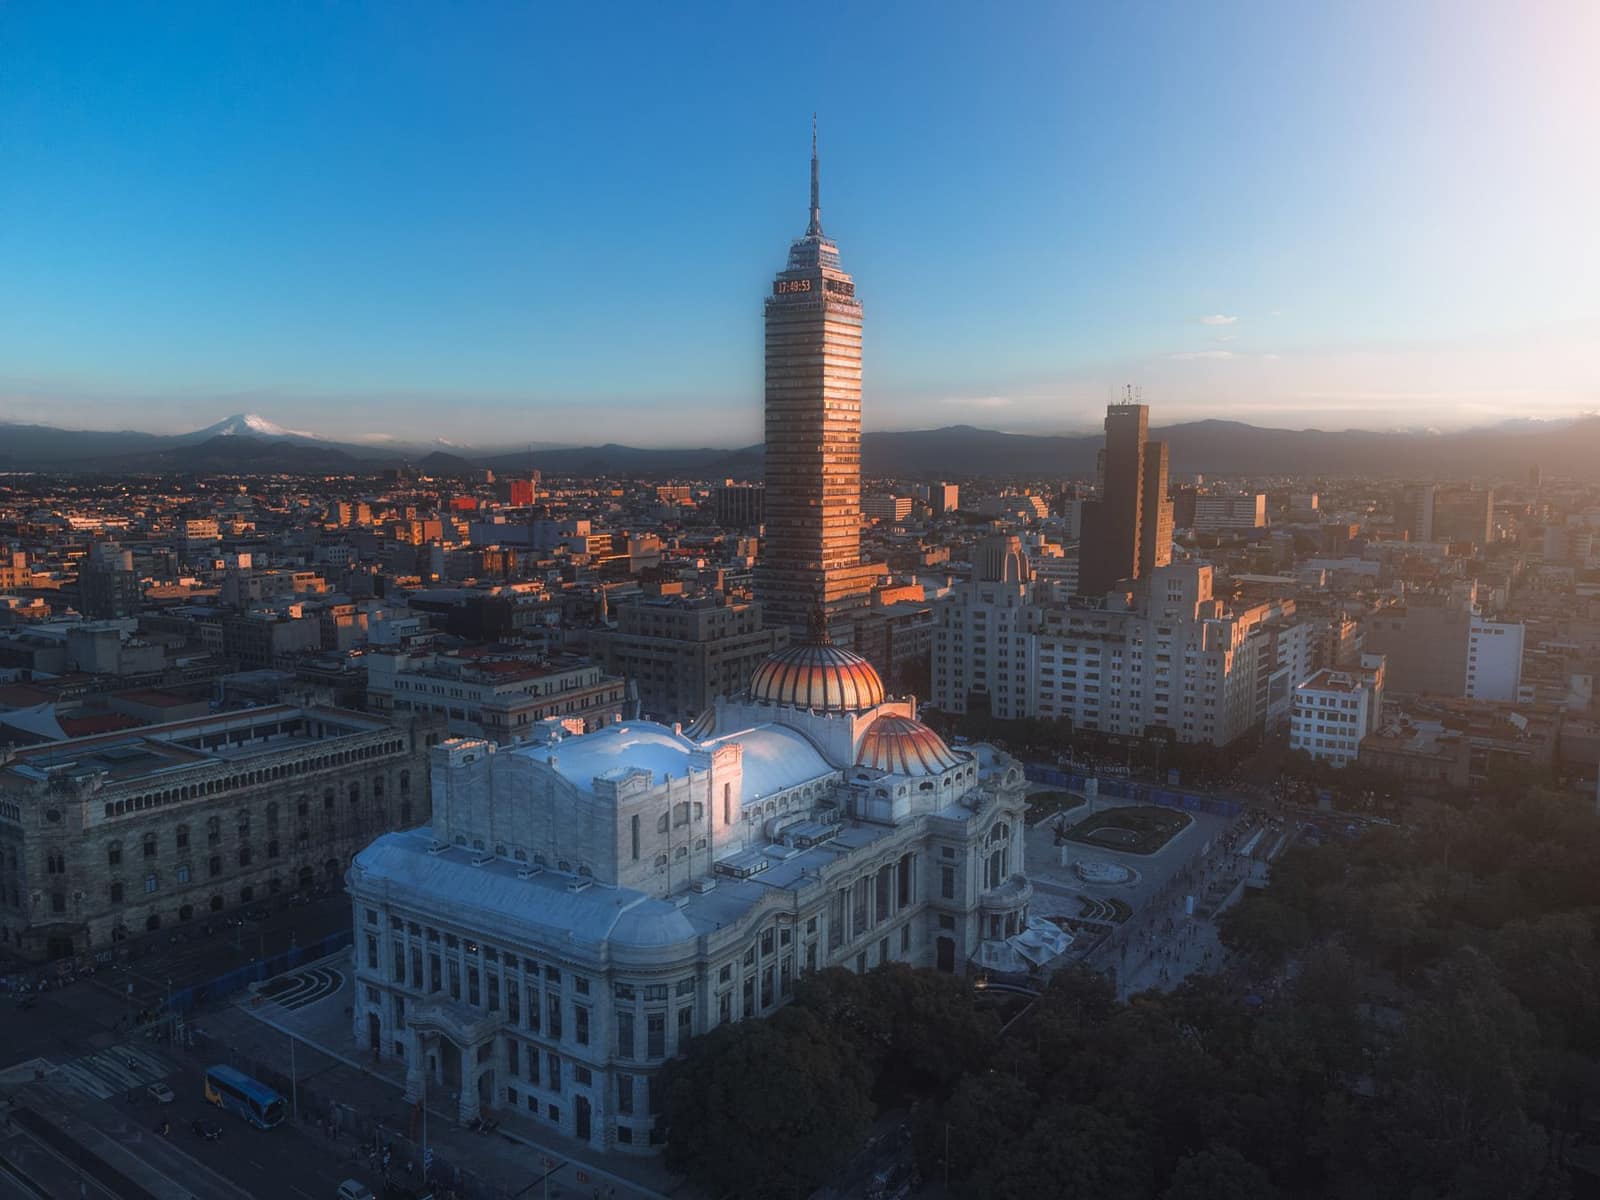 MXNMexico CityMexicoLarge Latin American market for Indian vehicles, auto parts and chemicals. Higher duties on non-FTA goods since January 2026.From India 2025-26US$ 5.73 bn
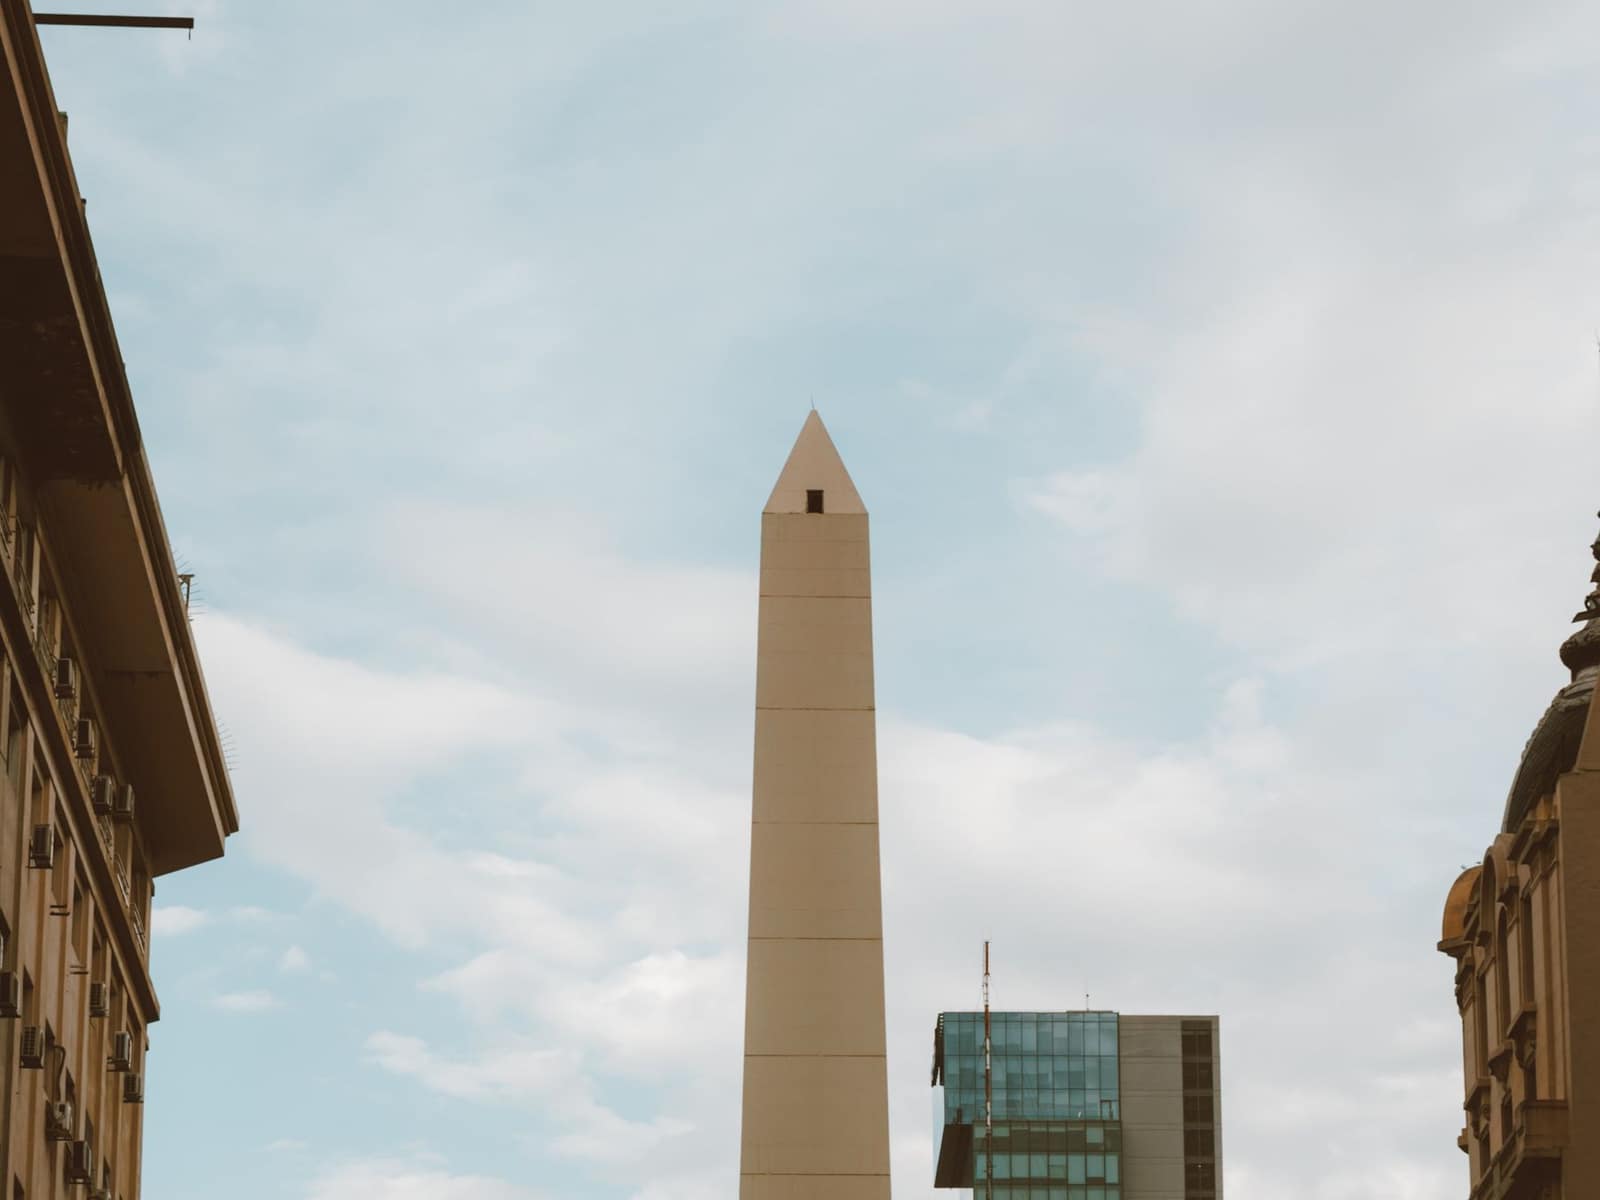 PTAARSBuenos AiresArgentinaBig South American market for Indian chemicals, agrochemicals, vehicles and medicines. Import and currency rules change often.From India 2025-26US$ 1.01 bn