

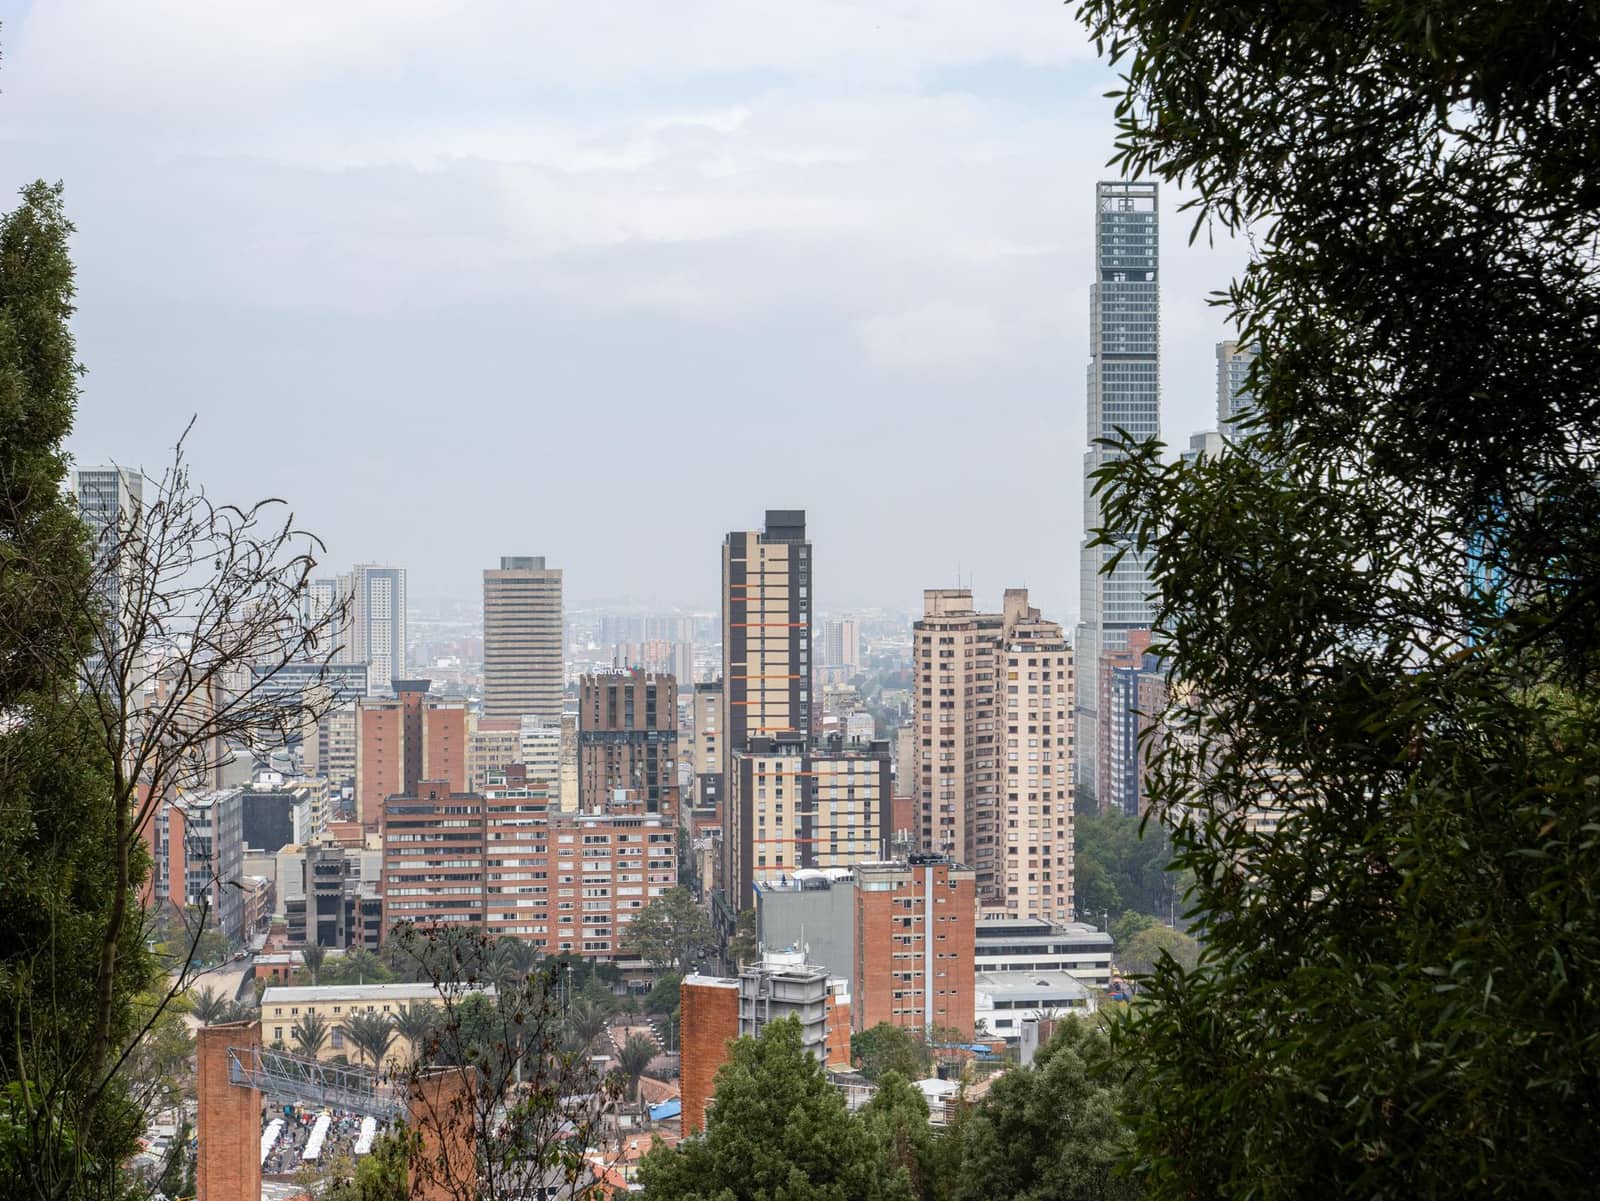
Americas
Export to Colombia
Growing Andean market for Indian two-wheelers, medicines, chemicals and yarn. No trade agreement; INVIMA and ICA rules apply.
- Capital
- Bogotá
- Currency
- COP
- Trade agreement with India
- None
- Main ports
- Cartagena, Buenaventura, Barranquilla
Colombia has no trade agreement with India, so normal duties apply. Indian motorcycles are widely sold there, and medicines, chemicals, yarn and auto parts are steady exports. Ports on both the Caribbean and Pacific coasts make it a useful entry point to the Andean region.
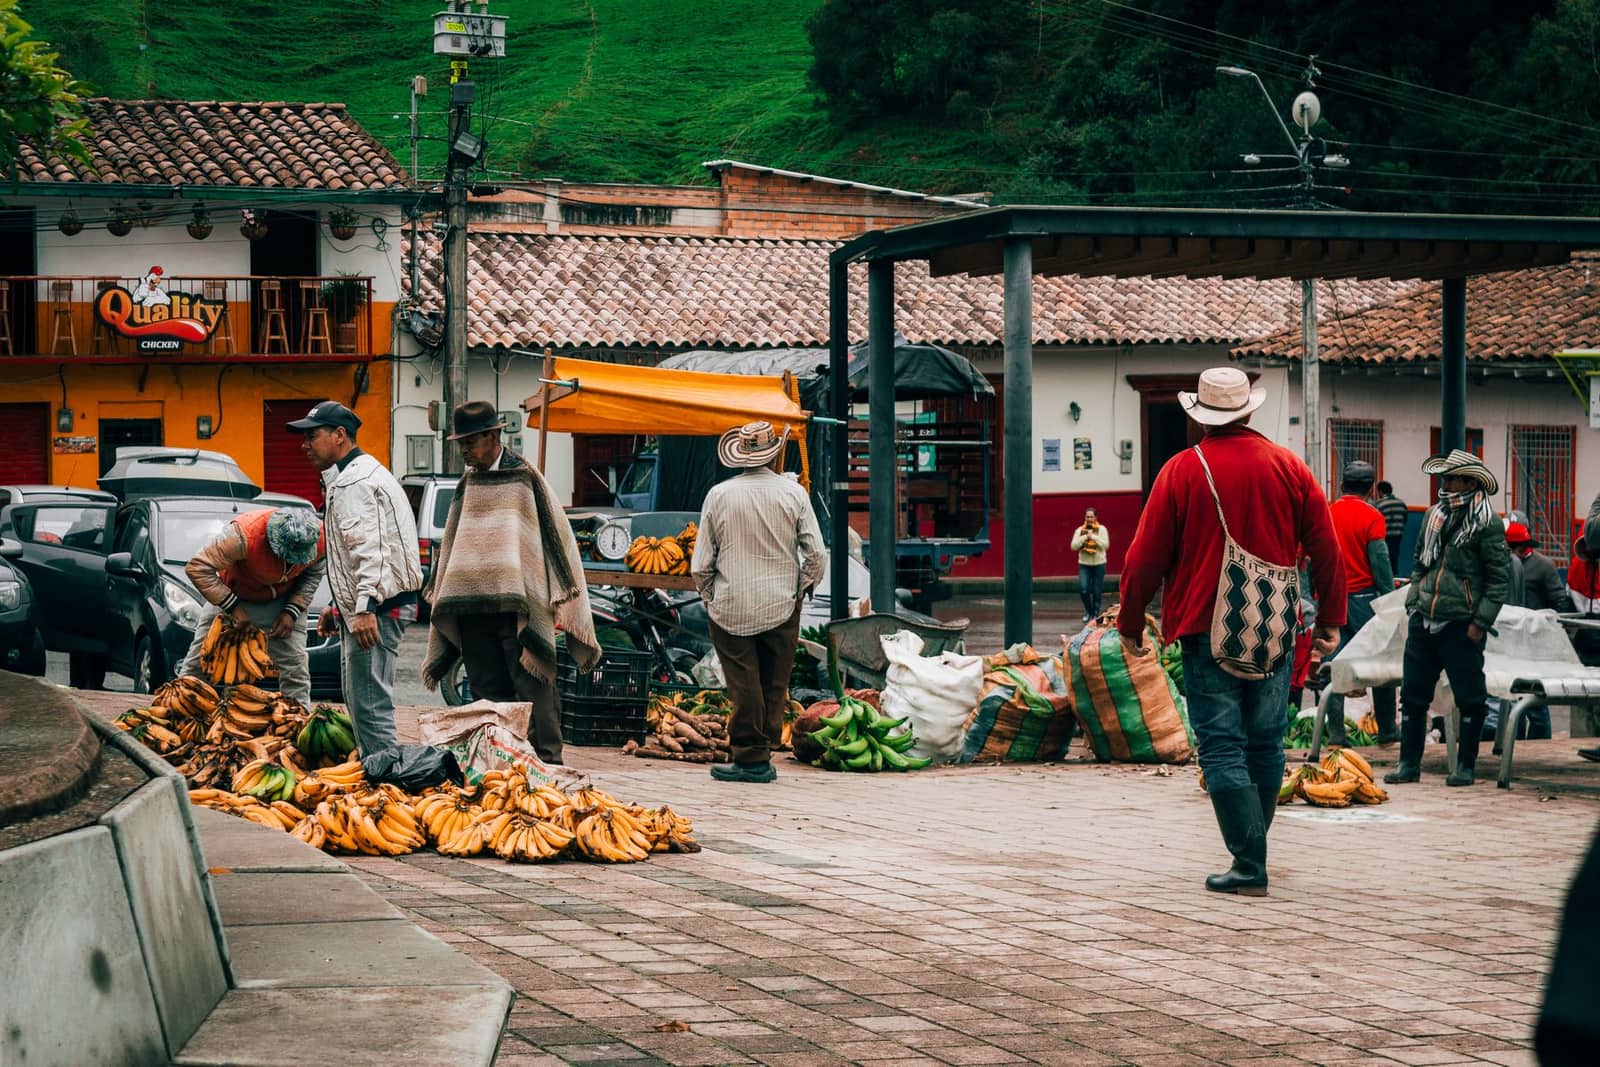
What it buys from India
- Motorcycles, vehicles and auto parts
- Medicines and organic chemicals
- Cotton and synthetic yarn and fabrics
- Agrochemicals, machinery and steel products
Import rules on their side
- Medicines, food, cosmetics and medical devices need a sanitary registration from INVIMA before import.
- Plant and animal products need ICA phytosanitary or zoosanitary import documents and an inspection at entry.
- Customs is run by DIAN; labels must be in Spanish, and some products need technical-regulation certificates.
Practical tips
- Cartagena is a major transhipment hub; ask your forwarder whether Pacific (Buenaventura) or Caribbean routing is faster for your buyer.
- INVIMA registration is in the importer's name; agree in writing who owns it if you later change distributors.
- Ask for an advance or an LC for a first order; check ECGC cover before giving credit.
Trade data
India’s exports to Colombia in numbers
From the Department of Commerce’s TradeStat (Indian financial years, April–March), the country’s imports from the world from UN Comtrade, and its basics from the World Bank.
- India’s exports here, 2025-26
- US$ 1.81 bn No. 41 of our 80 countries
- Change from 2024-25
- ↑ +22.7% US$ 1.47 bn → US$ 1.81 bn
- Share of all Indian exports
- 0.41%
- Its imports from the world
- —
What India sells here most
By HS chapter, 2025-26. Change is against 2024-25.
What is rising and what is falling
Chapters where India sells at least US$ 5 million. Change from 2024-25 to 2025-26.
↑ High demand
- CopperUS$ 1 mn → US$ 13.5 mn↑+1,252%
- Vehicles and partsUS$ 528 mn → US$ 828 mn↑+56.8%
- Iron and steel articlesUS$ 14.4 mn → US$ 20.6 mn↑+43.2%
- Woven garmentsUS$ 7.3 mn → US$ 9.5 mn↑+30.3%
- Instruments, medical devicesUS$ 18.5 mn → US$ 23.6 mn↑+28%
- Ceramics and tilesUS$ 31.3 mn → US$ 39.9 mn↑+27.4%
- Fuels and petroleum productsUS$ 16.1 mn → US$ 20.3 mn↑+25.9%
- MachineryUS$ 67.1 mn → US$ 83.9 mn↑+25%
↓ Low demand
- Other chemical productsUS$ 72.2 mn → US$ 42.5 mn↓-41.2%
- Electrical and electronicsUS$ 77.5 mn → US$ 49.2 mn↓-36.6%
- Man-made staple fibresUS$ 24.4 mn → US$ 18.9 mn↓-22.6%
Our product guides that sell here
India’s exports of each product to this country, 2025-26.
The 20 biggest export lines
4-digit HS lines, 2025-26, with their Harmonized System descriptions.
What India buys from Colombia
India’s imports from this country in 2025-26 by HS chapter, from TradeStat — this country can be your supplier too.
- India’s imports, 2025-26
- US$ 2.9 bn US$ 3.25 bn → US$ 2.9 bn
- India’s exports, 2025-26
- US$ 1.81 bn
- Trade balance
- −US$ 1.1 bn exports minus imports
- Change in imports
- -10.6%
The country at a glance
- Population
- 53.4 mn 2025
- GDP
- US$ 457.4 bn 2025
- GDP per person
- US$ 8,562 2025
- Imports (goods and services)
- US$ 93.2 bn 2025
Sources: TradeStat — Export Import Data Bank, Department of Commerce · World Bank — World Development Indicators · Figures taken 29 October 2026.
What to send to Colombia
All products →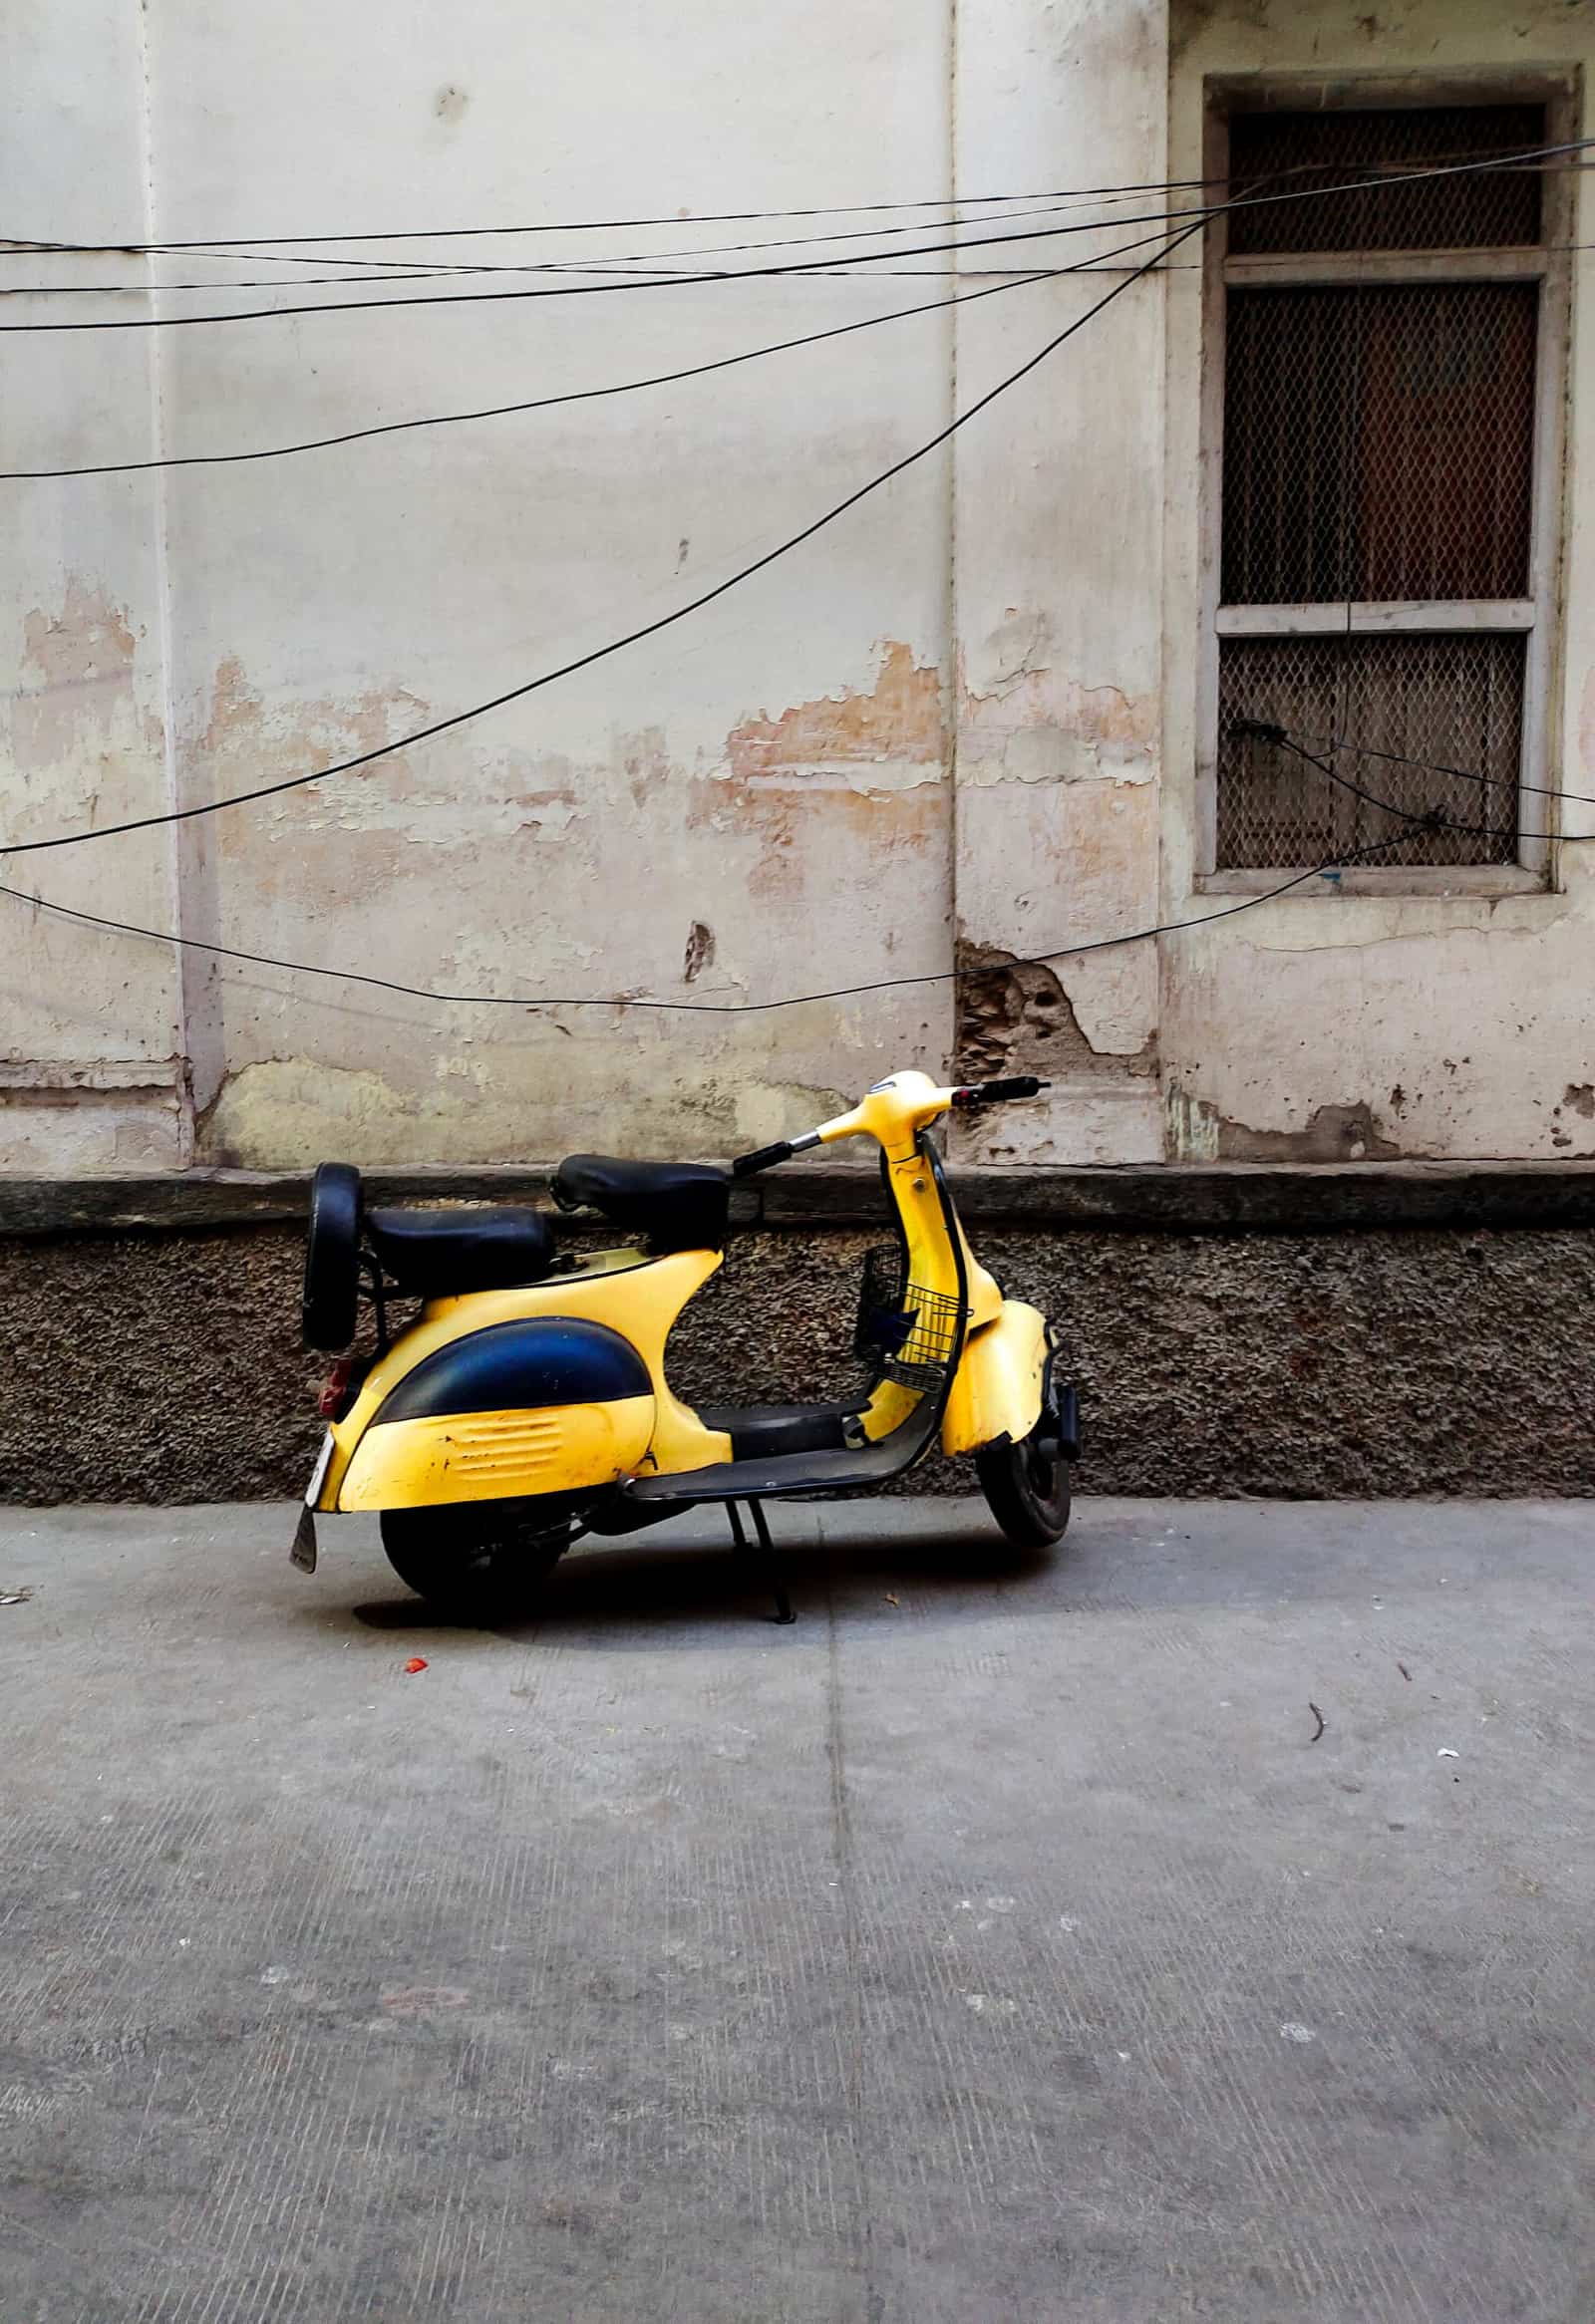 Free to exportEngineering goodsMotorcycles and scootersCommuter motorcycles and scooters for Latin America, Africa and South Asia; India is a top exporter.HS8711Exports 2025-26US$ 3.98 bn ↑24.2%
 Free to exportEngineering goodsAuto parts and componentsOEM and aftermarket vehicle parts; the USA, Germany and Italy buy most, with strong demand in Latin America.HS8708Exports 2025-26US$ 7.64 bn ↑1.8%
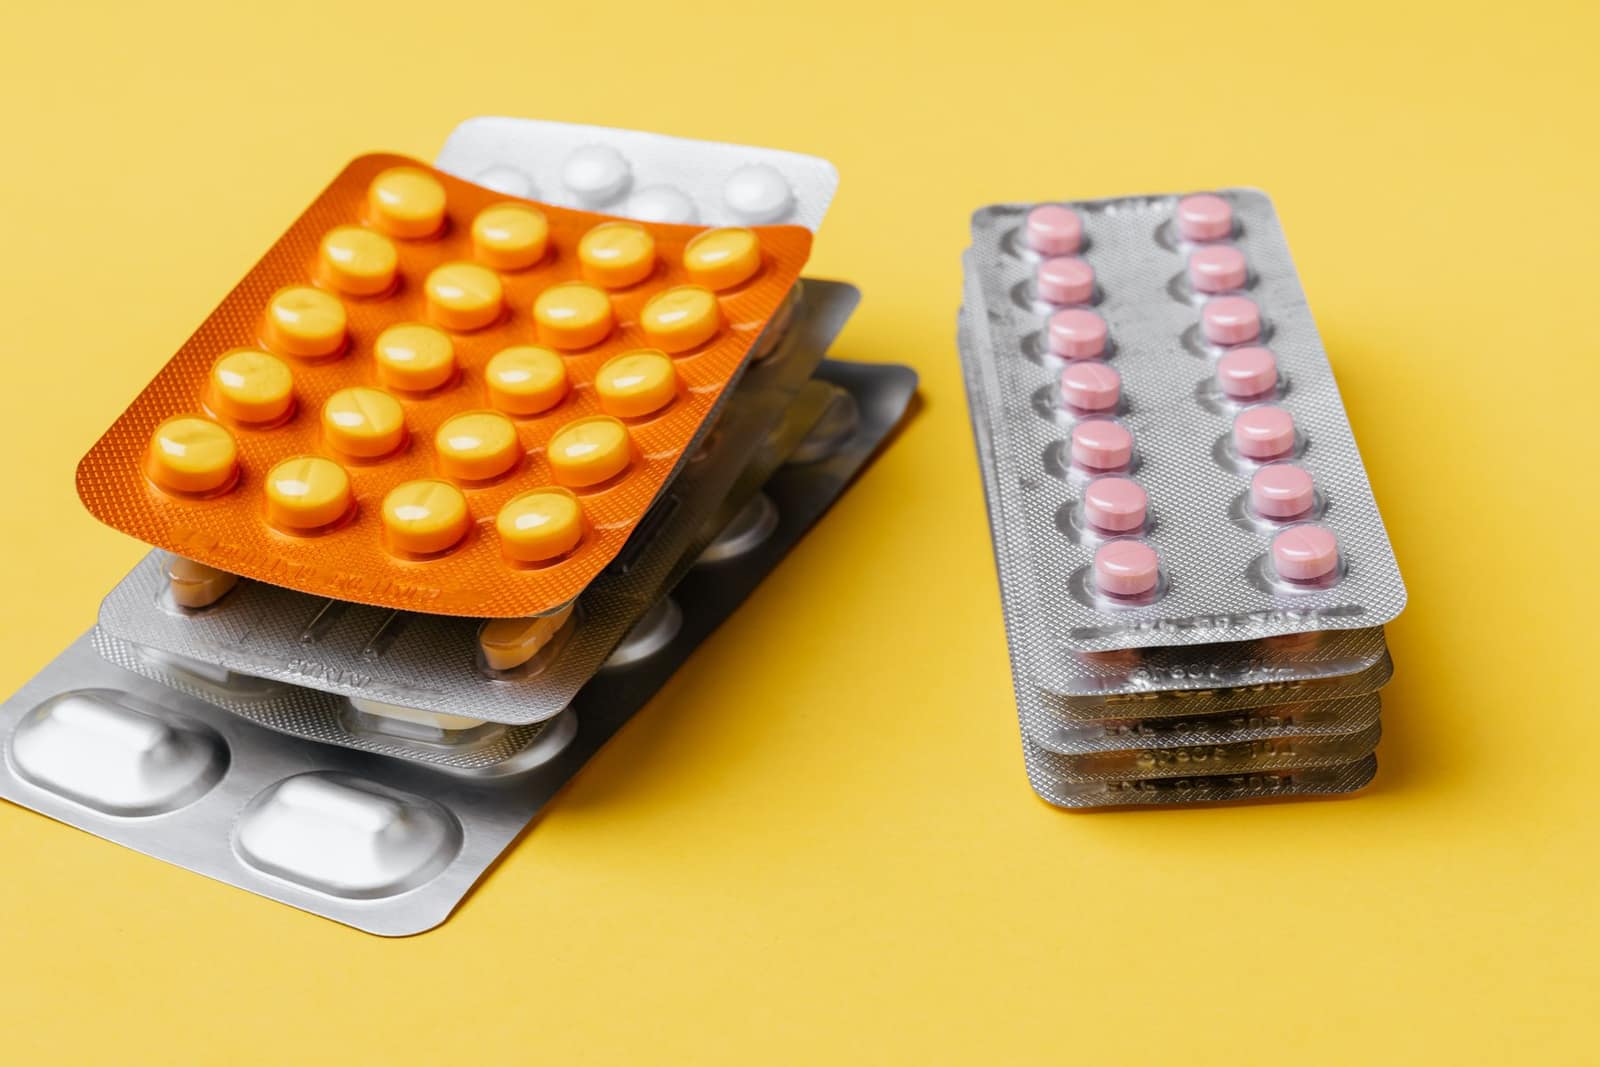 Free to exportPharma & chemicalsGeneric medicines (formulations)Tablets, capsules and injectables; every market needs product registration. The USA buys the most.HS3004Exports 2025-26US$ 21.9 bn ↓0.7%
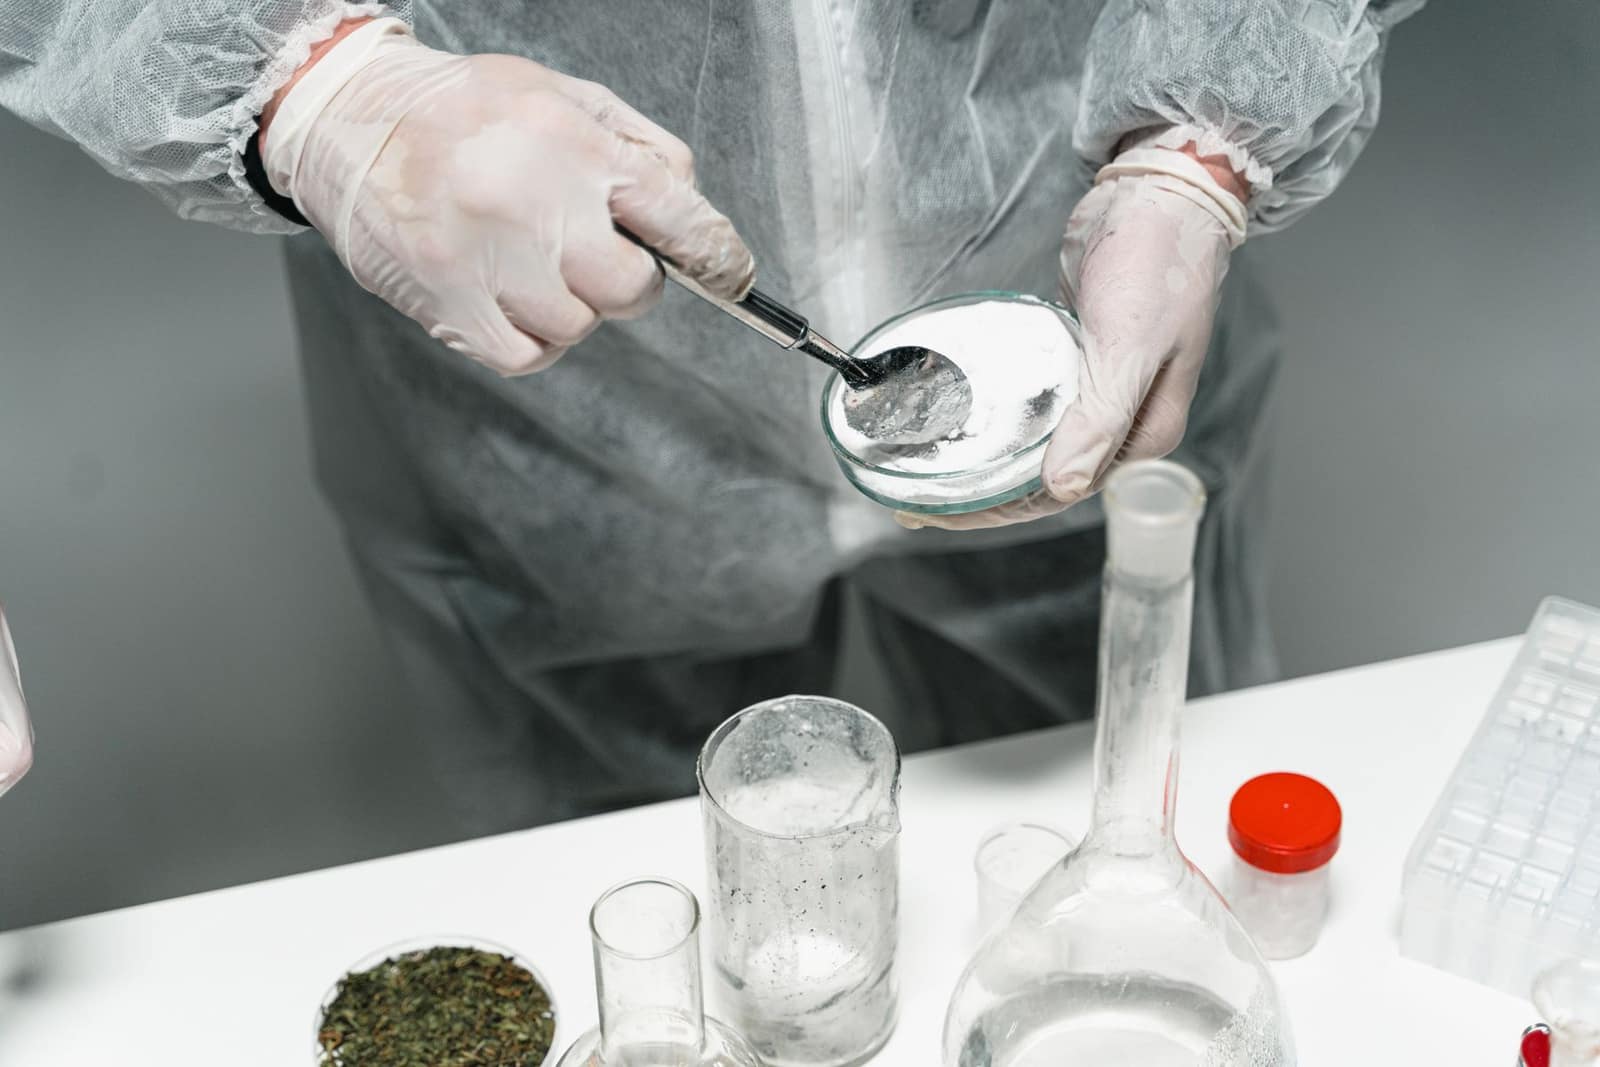 Free to exportPharma & chemicalsBulk drugs (APIs)APIs and intermediates from Hyderabad, Visakhapatnam and Gujarat; regulated buyers need DMFs and GMP inspections.HS2933Exports 2025-26US$ 7.78 bn ↓0.6%
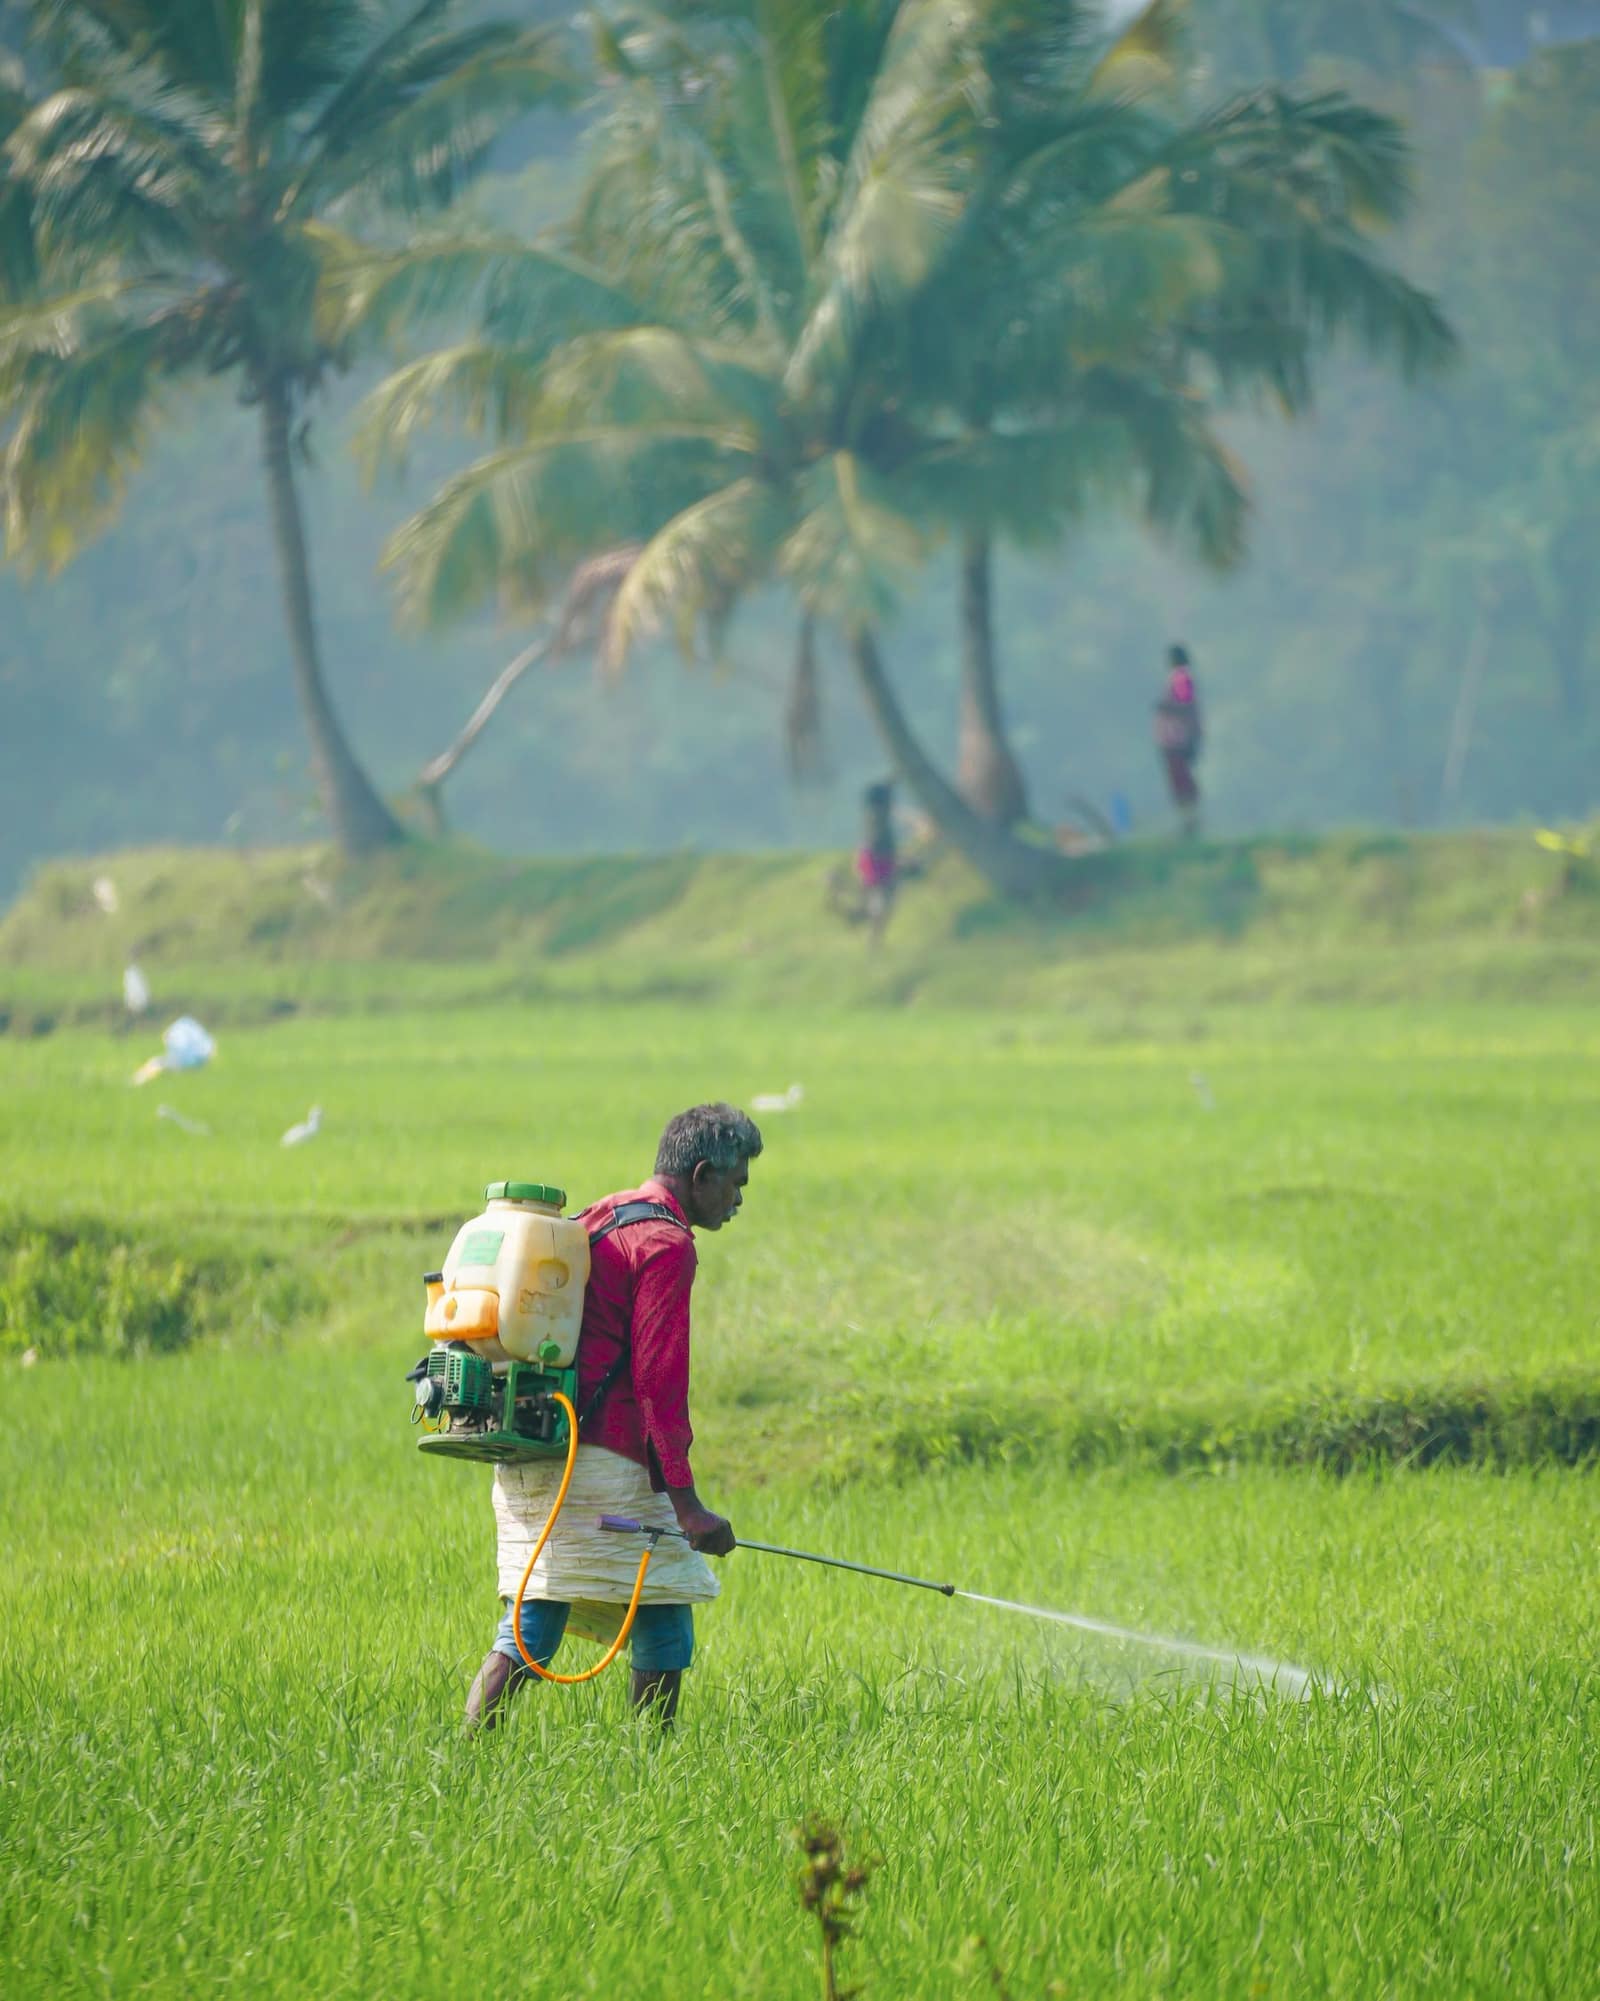 Free to exportPharma & chemicalsAgrochemicals (pesticides)Generic insecticides, fungicides and herbicides; Brazil and the USA are by far the largest buyers.HS3808Exports 2025-26US$ 3.87 bn ↓9.4%
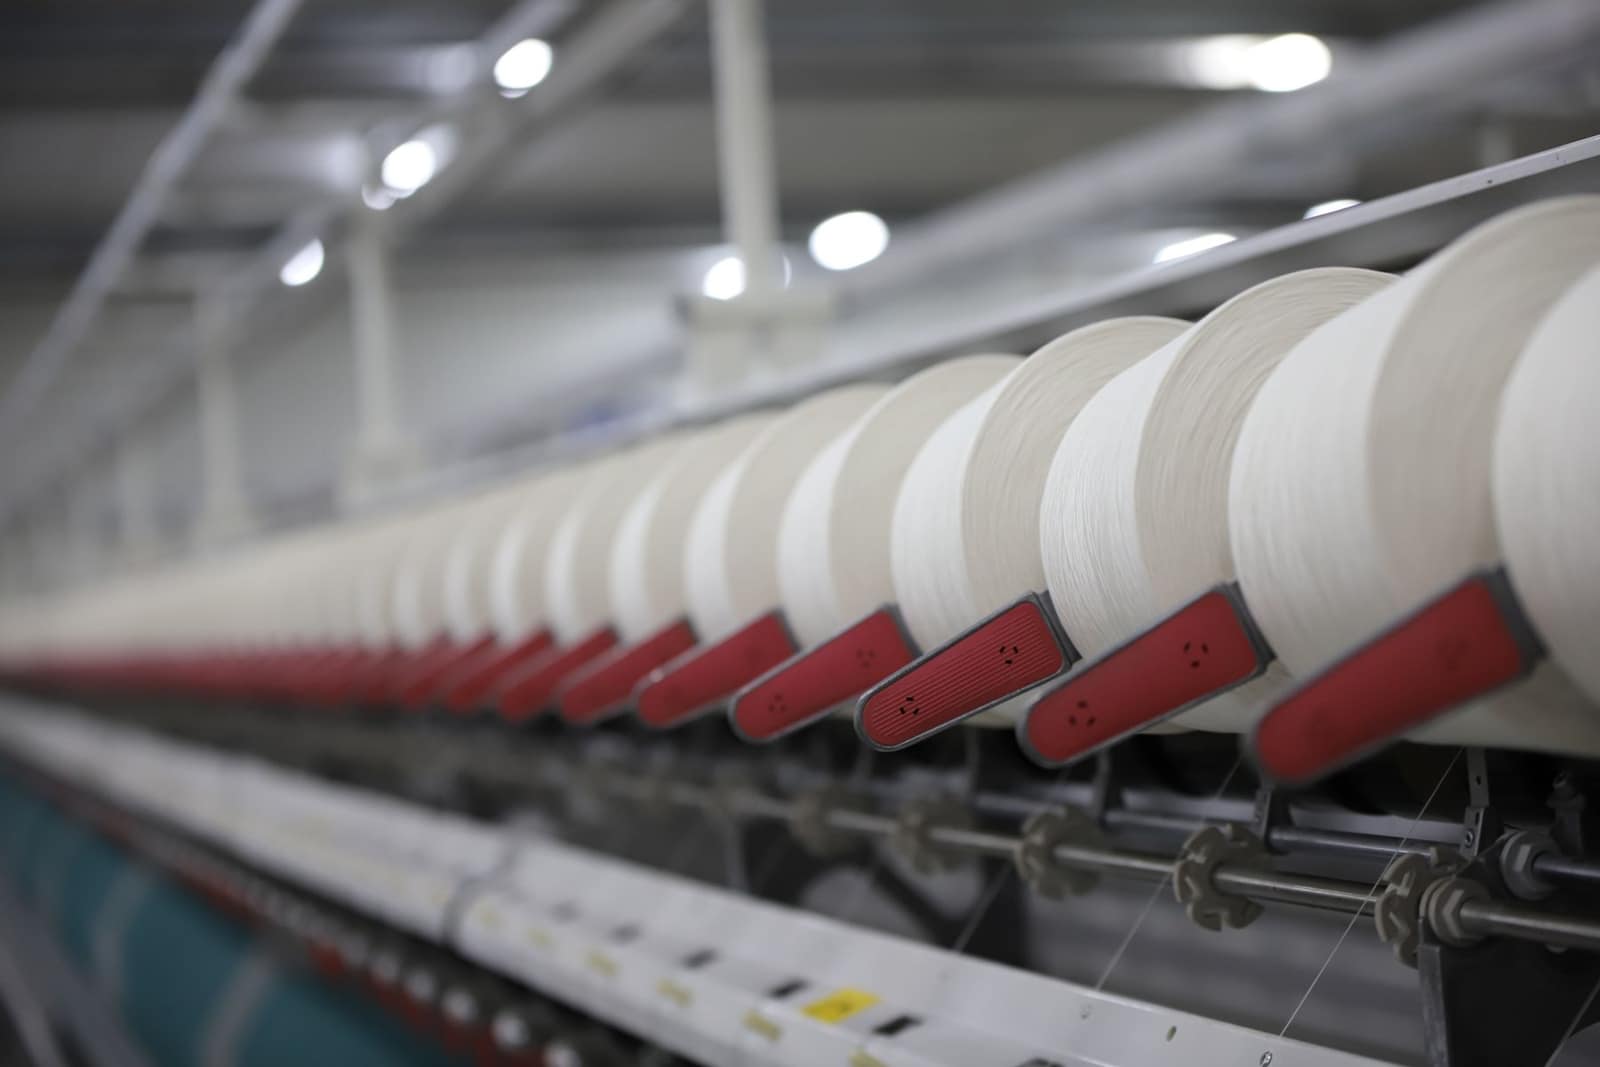 Free to exportTextiles & apparelCotton yarnBulk cotton yarn sold to weaving and knitting mills abroad; Bangladesh is by far the largest buyer.HS5205Exports 2025-26US$ 3.22 bn ↓4.1%
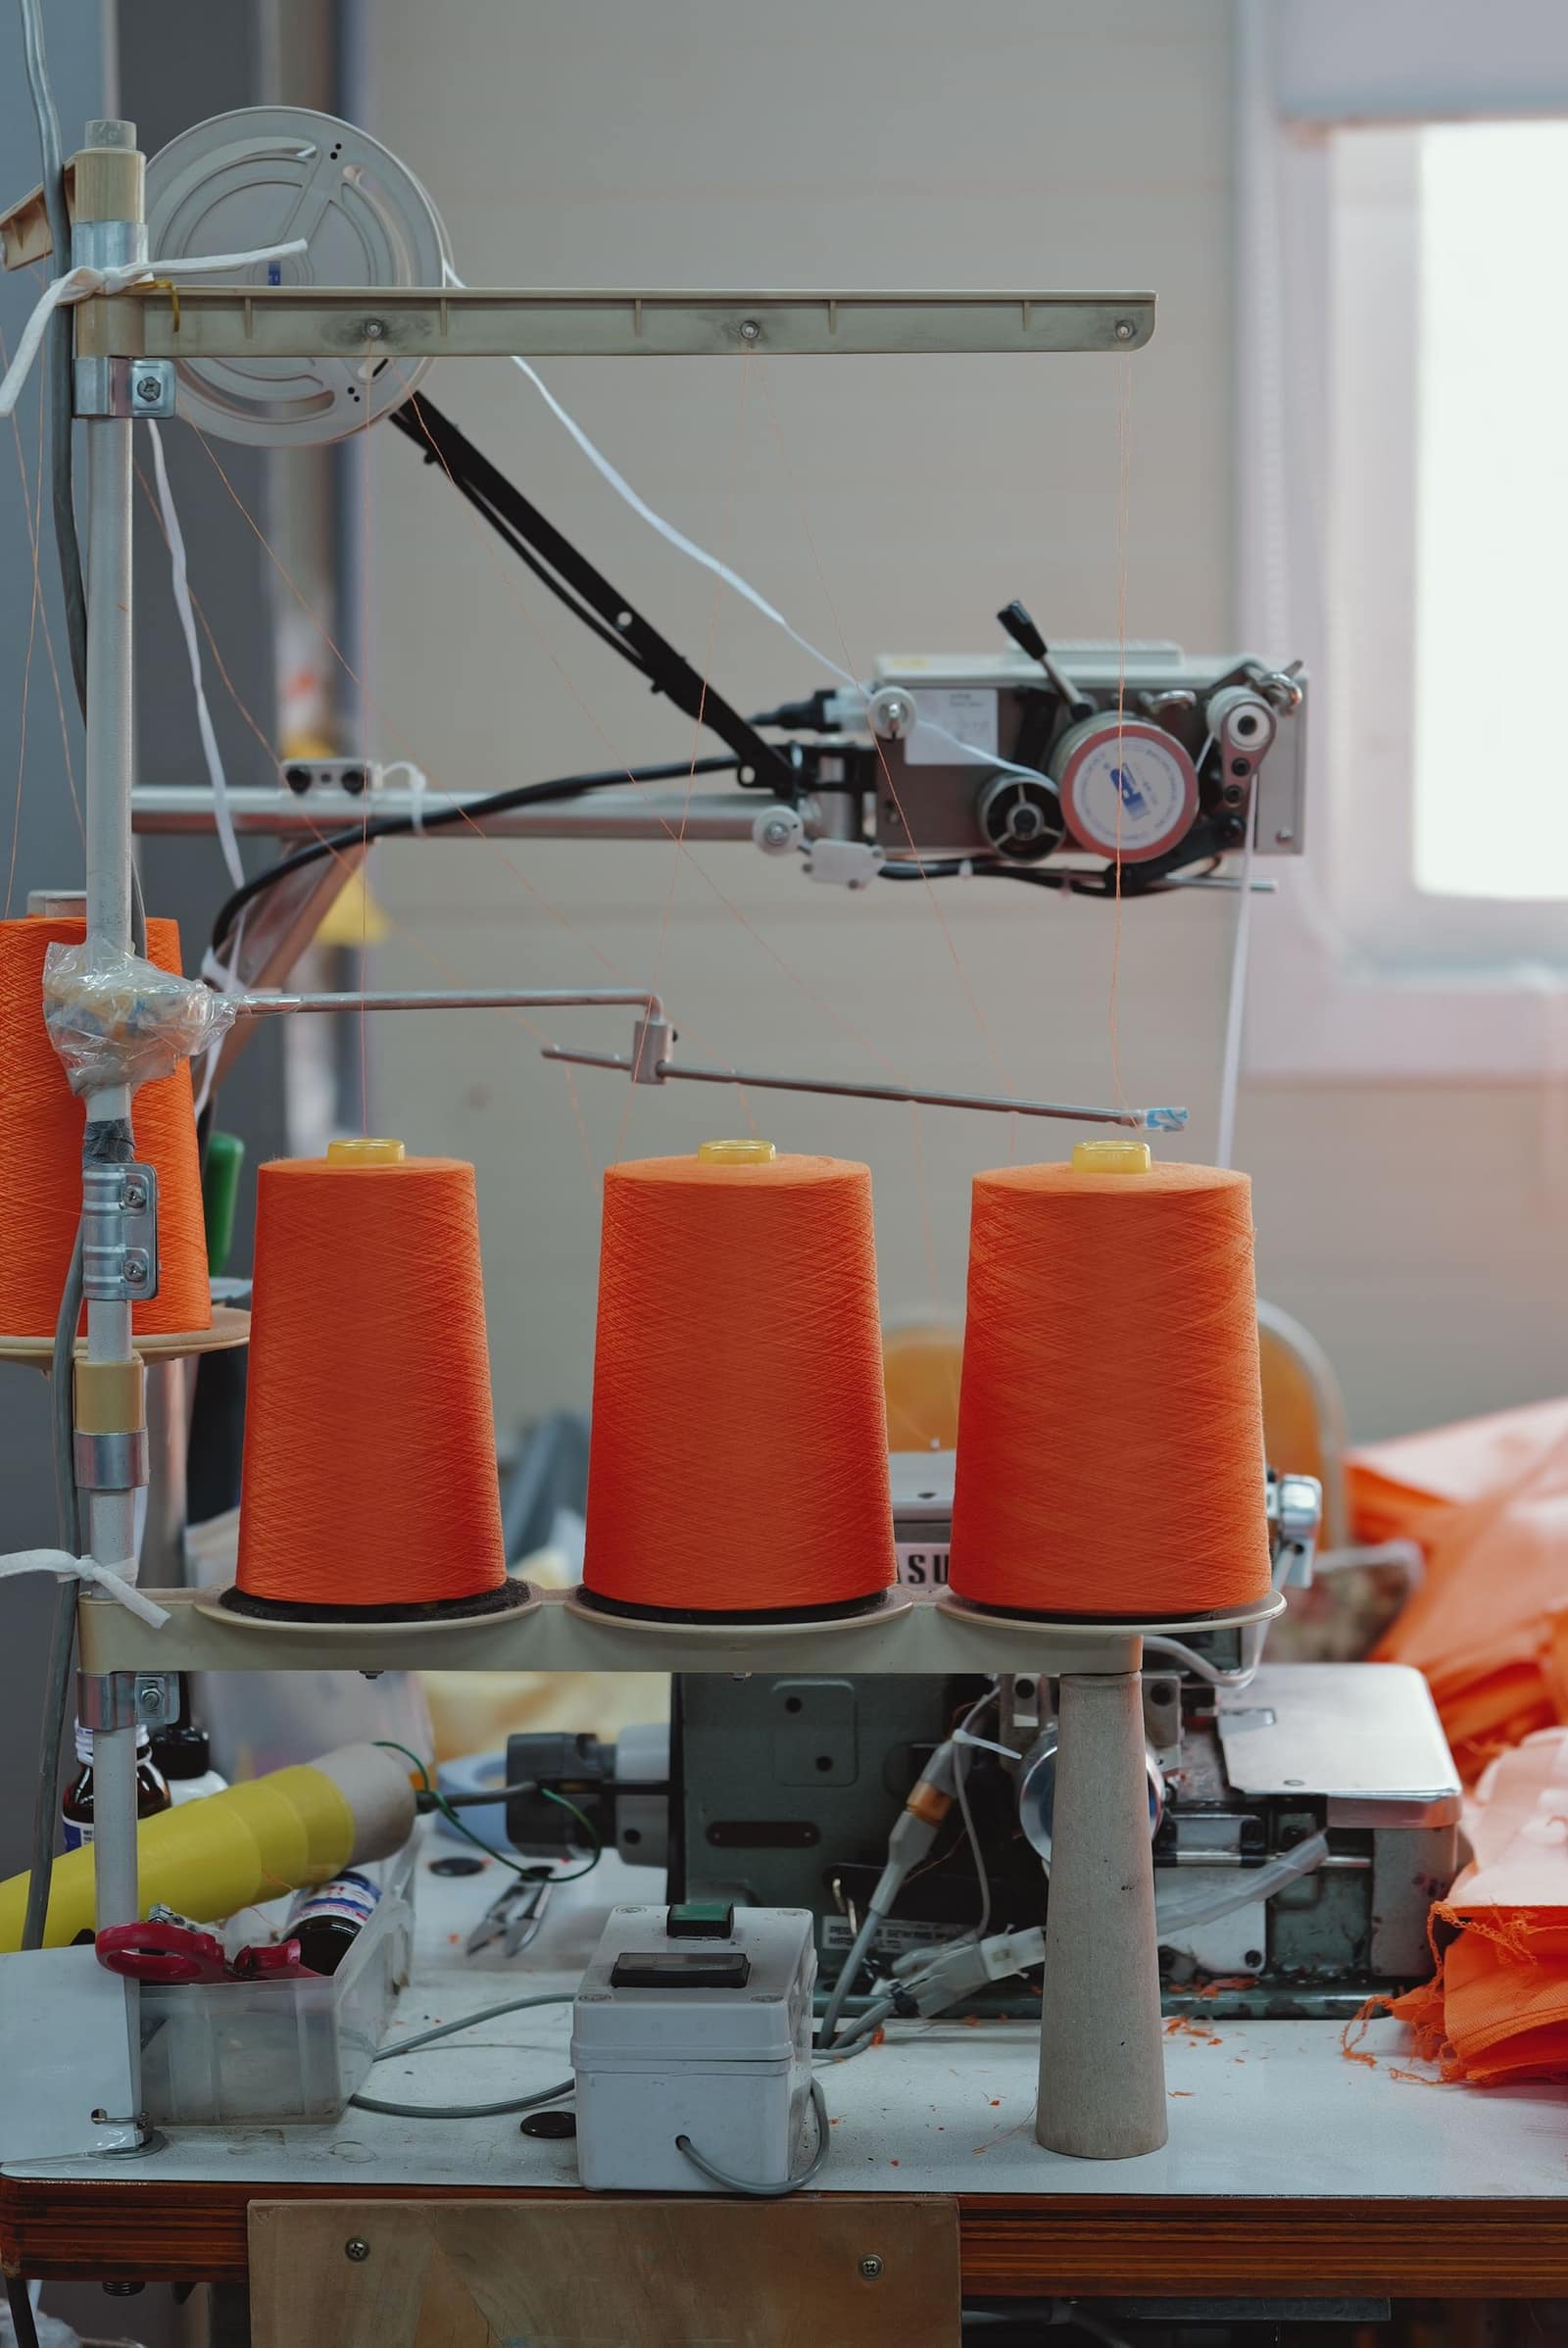 Free to exportTextiles & apparelPolyester and synthetic yarnPolyester filament and spun yarns from Surat, Silvassa and Bhilwara, sold to weavers and knitters abroad.HS5402Exports 2025-26US$ 1.06 bn ↓16.8%
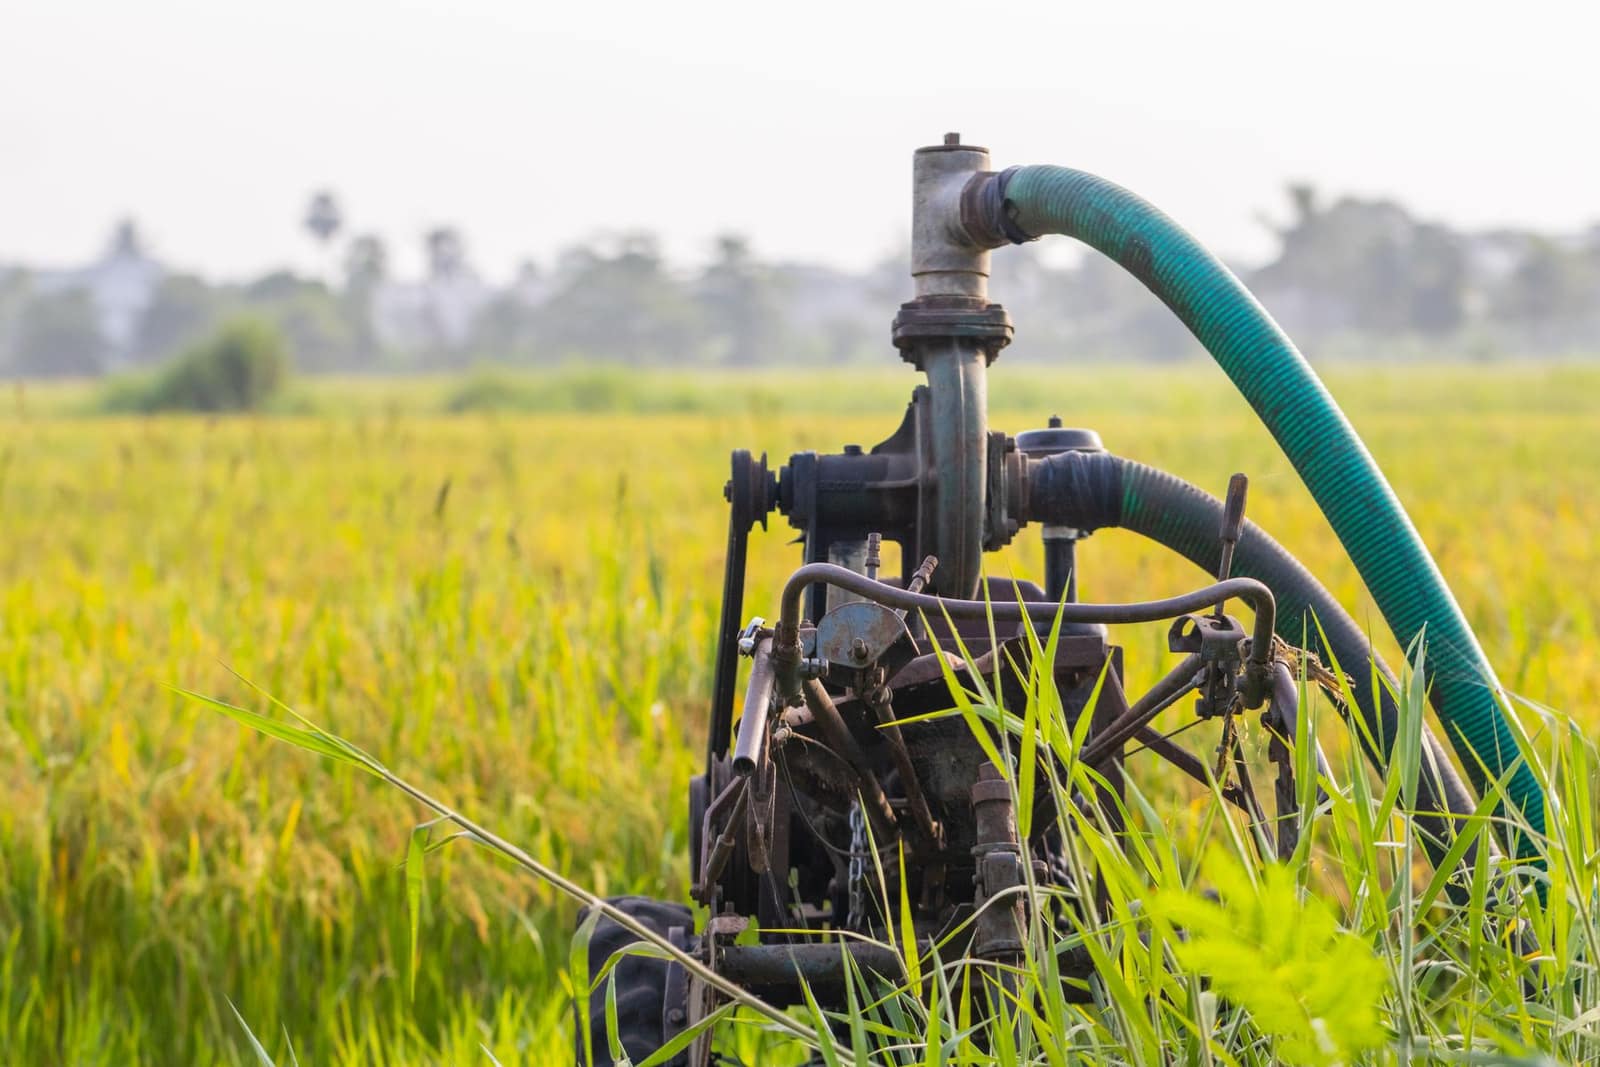 Free to exportEngineering goodsPumpsAgricultural, domestic and industrial pumps from Coimbatore, Rajkot and Ahmedabad; the USA leads.HS8413Exports 2025-26US$ 1.6 bn ↑5.2%
More in Americas
 USDWashington, D.C.United States of AmericaIndia's largest single-country export market. Strict FDA rules for food; extra 10% US duty on most goods since July 2026.From India 2025-26US$ 87.3 bn
 CADOttawaCanadaLarge Indian diaspora market. Importer needs a CFIA licence for food; labels in English and French.From India 2025-26US$ 4.67 bn
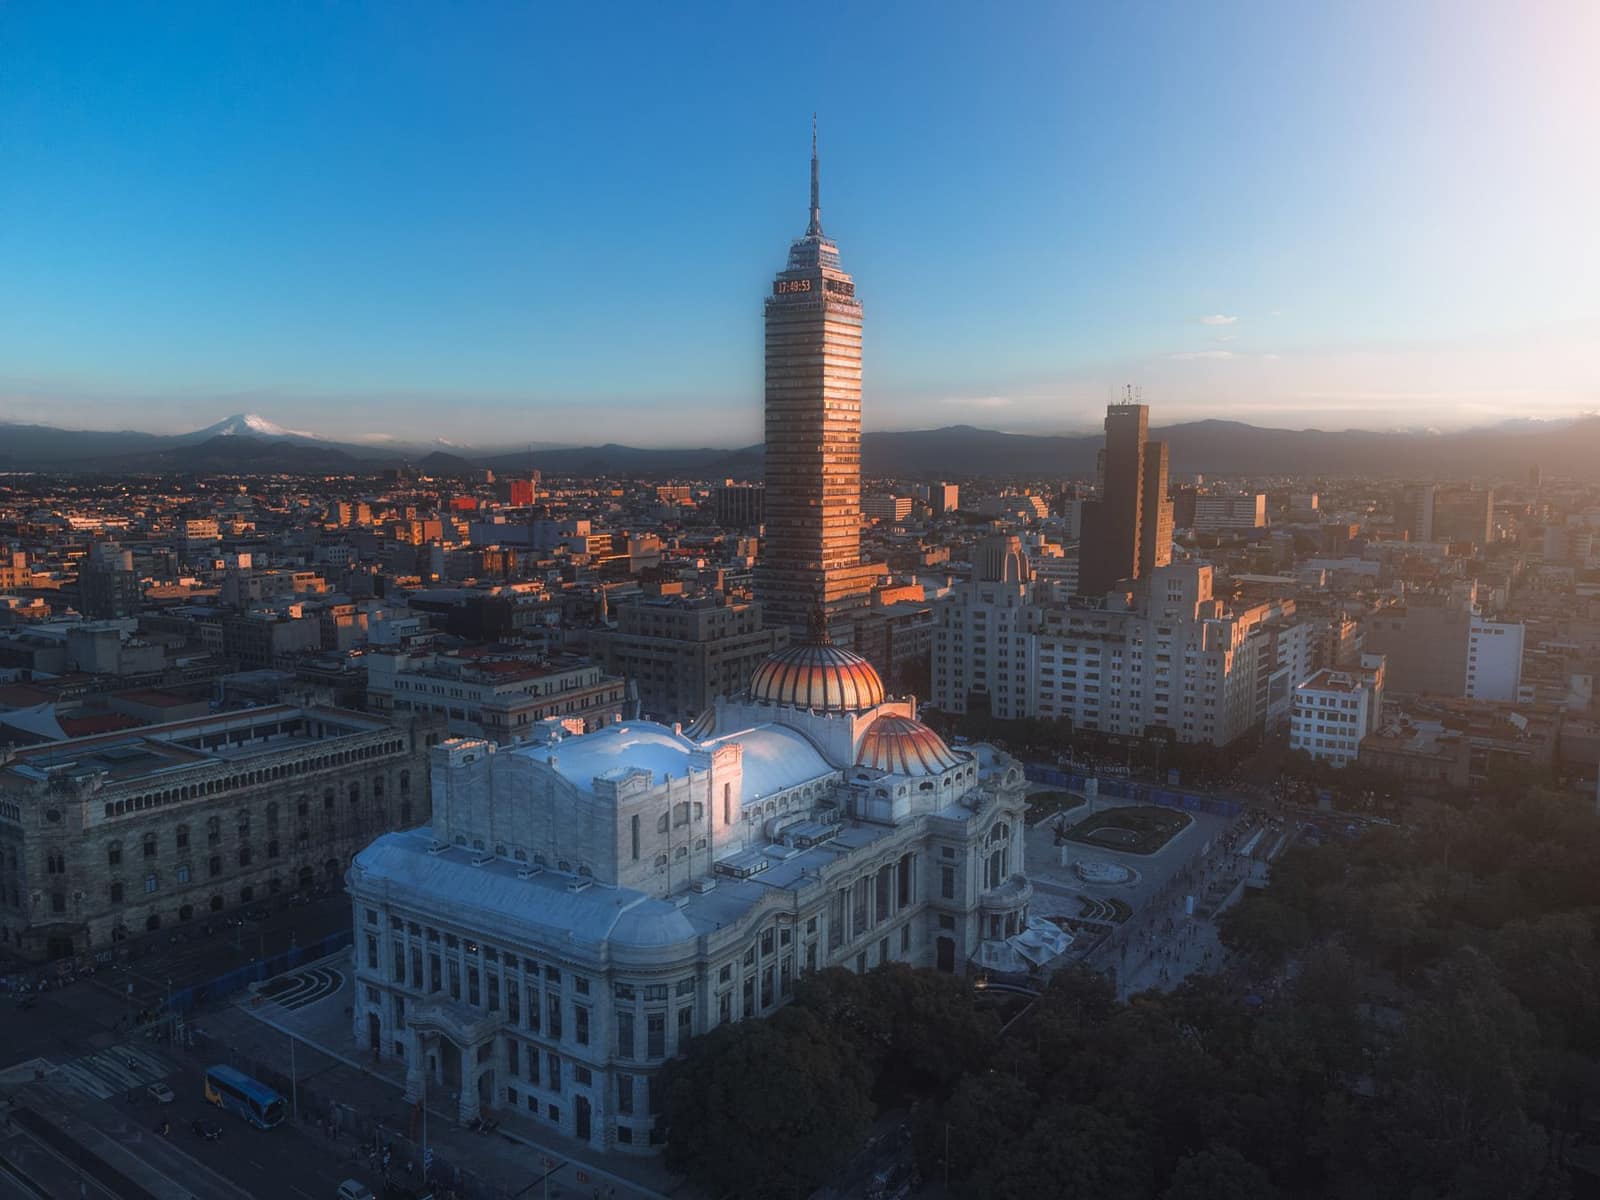 MXNMexico CityMexicoLarge Latin American market for Indian vehicles, auto parts and chemicals. Higher duties on non-FTA goods since January 2026.From India 2025-26US$ 5.73 bn
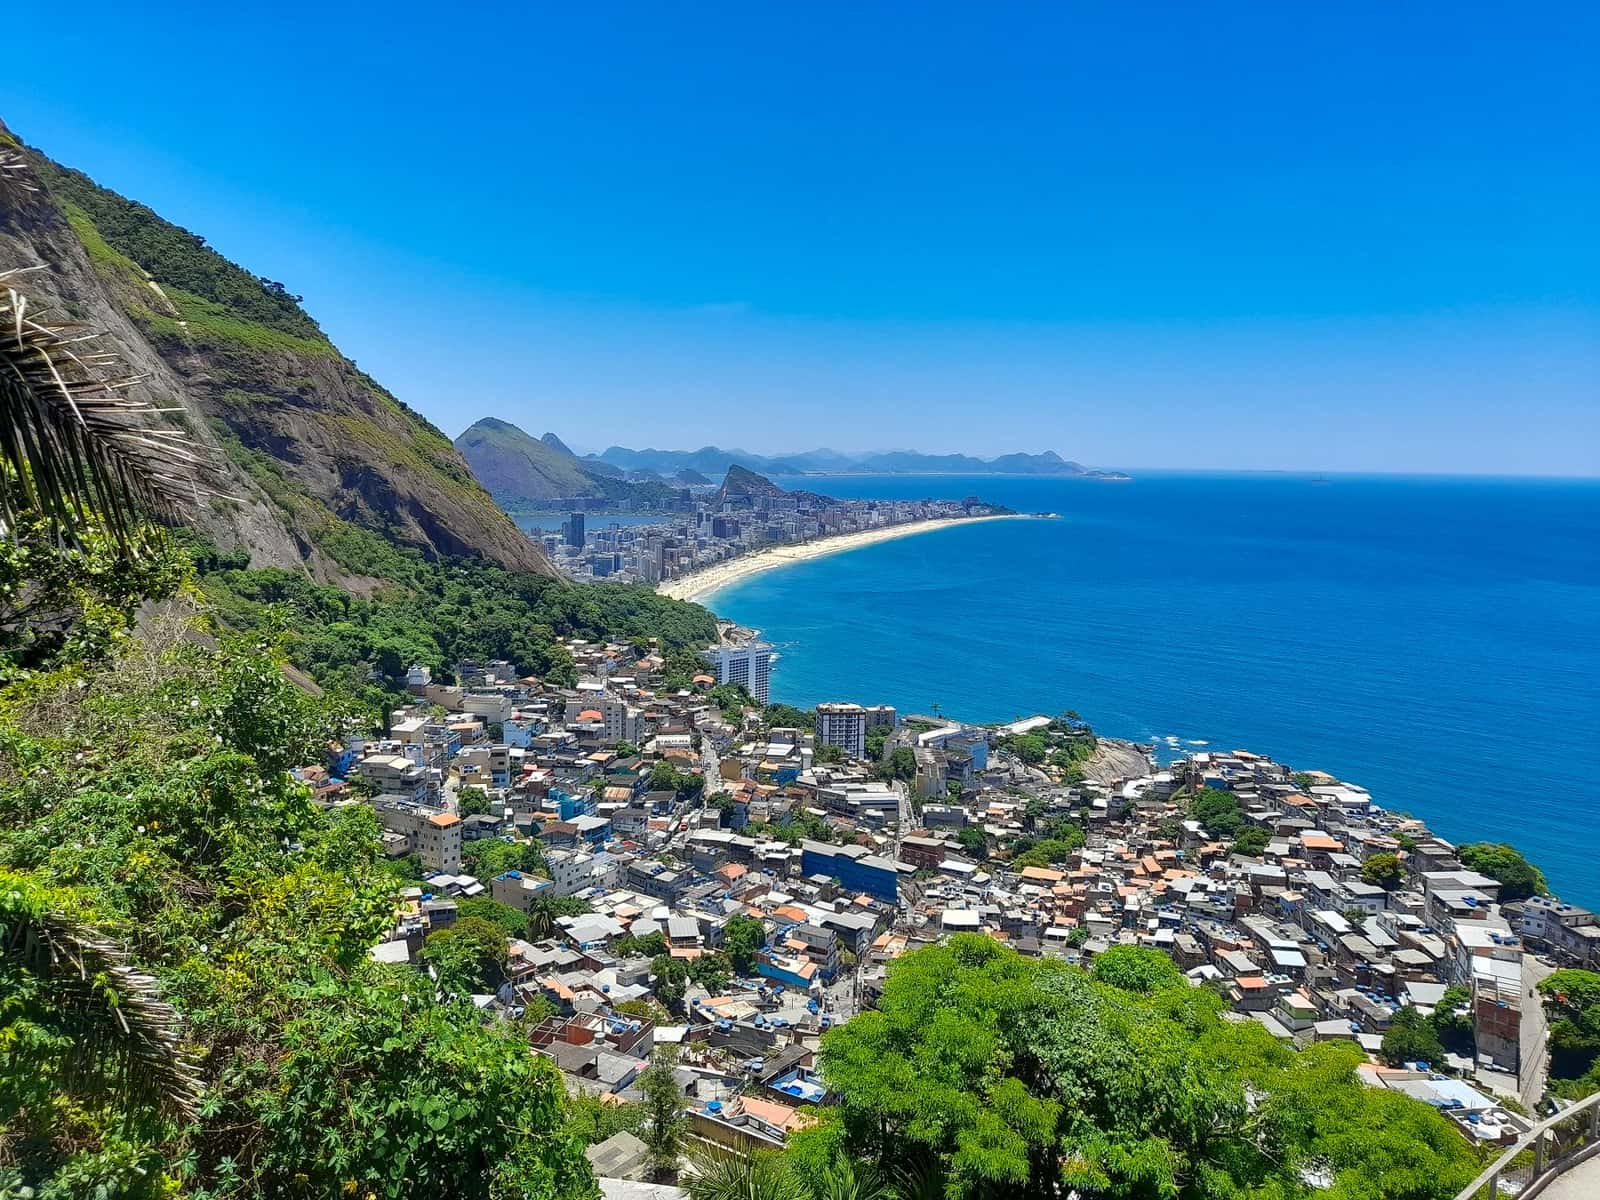 PTABRLBrasíliaBrazilLatin America's largest economy. Buys Indian fuels, agrochemicals, medicines, vehicles and yarn; MERCOSUR PTA applies.From India 2025-26US$ 7.02 bn