


Engineering goods
Export copper wire and products
Copper wire, strip and tubes from Gujarat and Silvassa; Saudi Arabia is by far the largest buyer of wire.
- HS code
- 7408 Copper wire (7408); also copper plates, sheets and strip (7409) and copper tubes and pipes (7411).
- Export policy
- Free to export Free to export under ITC(HS) Schedule 2 as checked in November 2026. Copper scrap and waste are covered by separate entries; check them if you deal in scrap. Confirm your exact 8-digit line on the DGFT ITC(HS) search before you ship.
- Registrations
- 3 IEC, GST and those below
- India’s exports, 2025-26
- US$ 1.27 bn to 114 countries
What is exported
India makes copper rod and wire from smelters in Gujarat and Jharkhand and from wire and tube mills in Silvassa, Gujarat and Maharashtra. In 2025-26 India exported about US$ 1 billion of copper wire (HS 7408), of which Saudi Arabia took nearly 90%; Nepal, Qatar and Sri Lanka followed. Copper tubes (7411) go mainly to the USA and Canada for air-conditioning and plumbing.
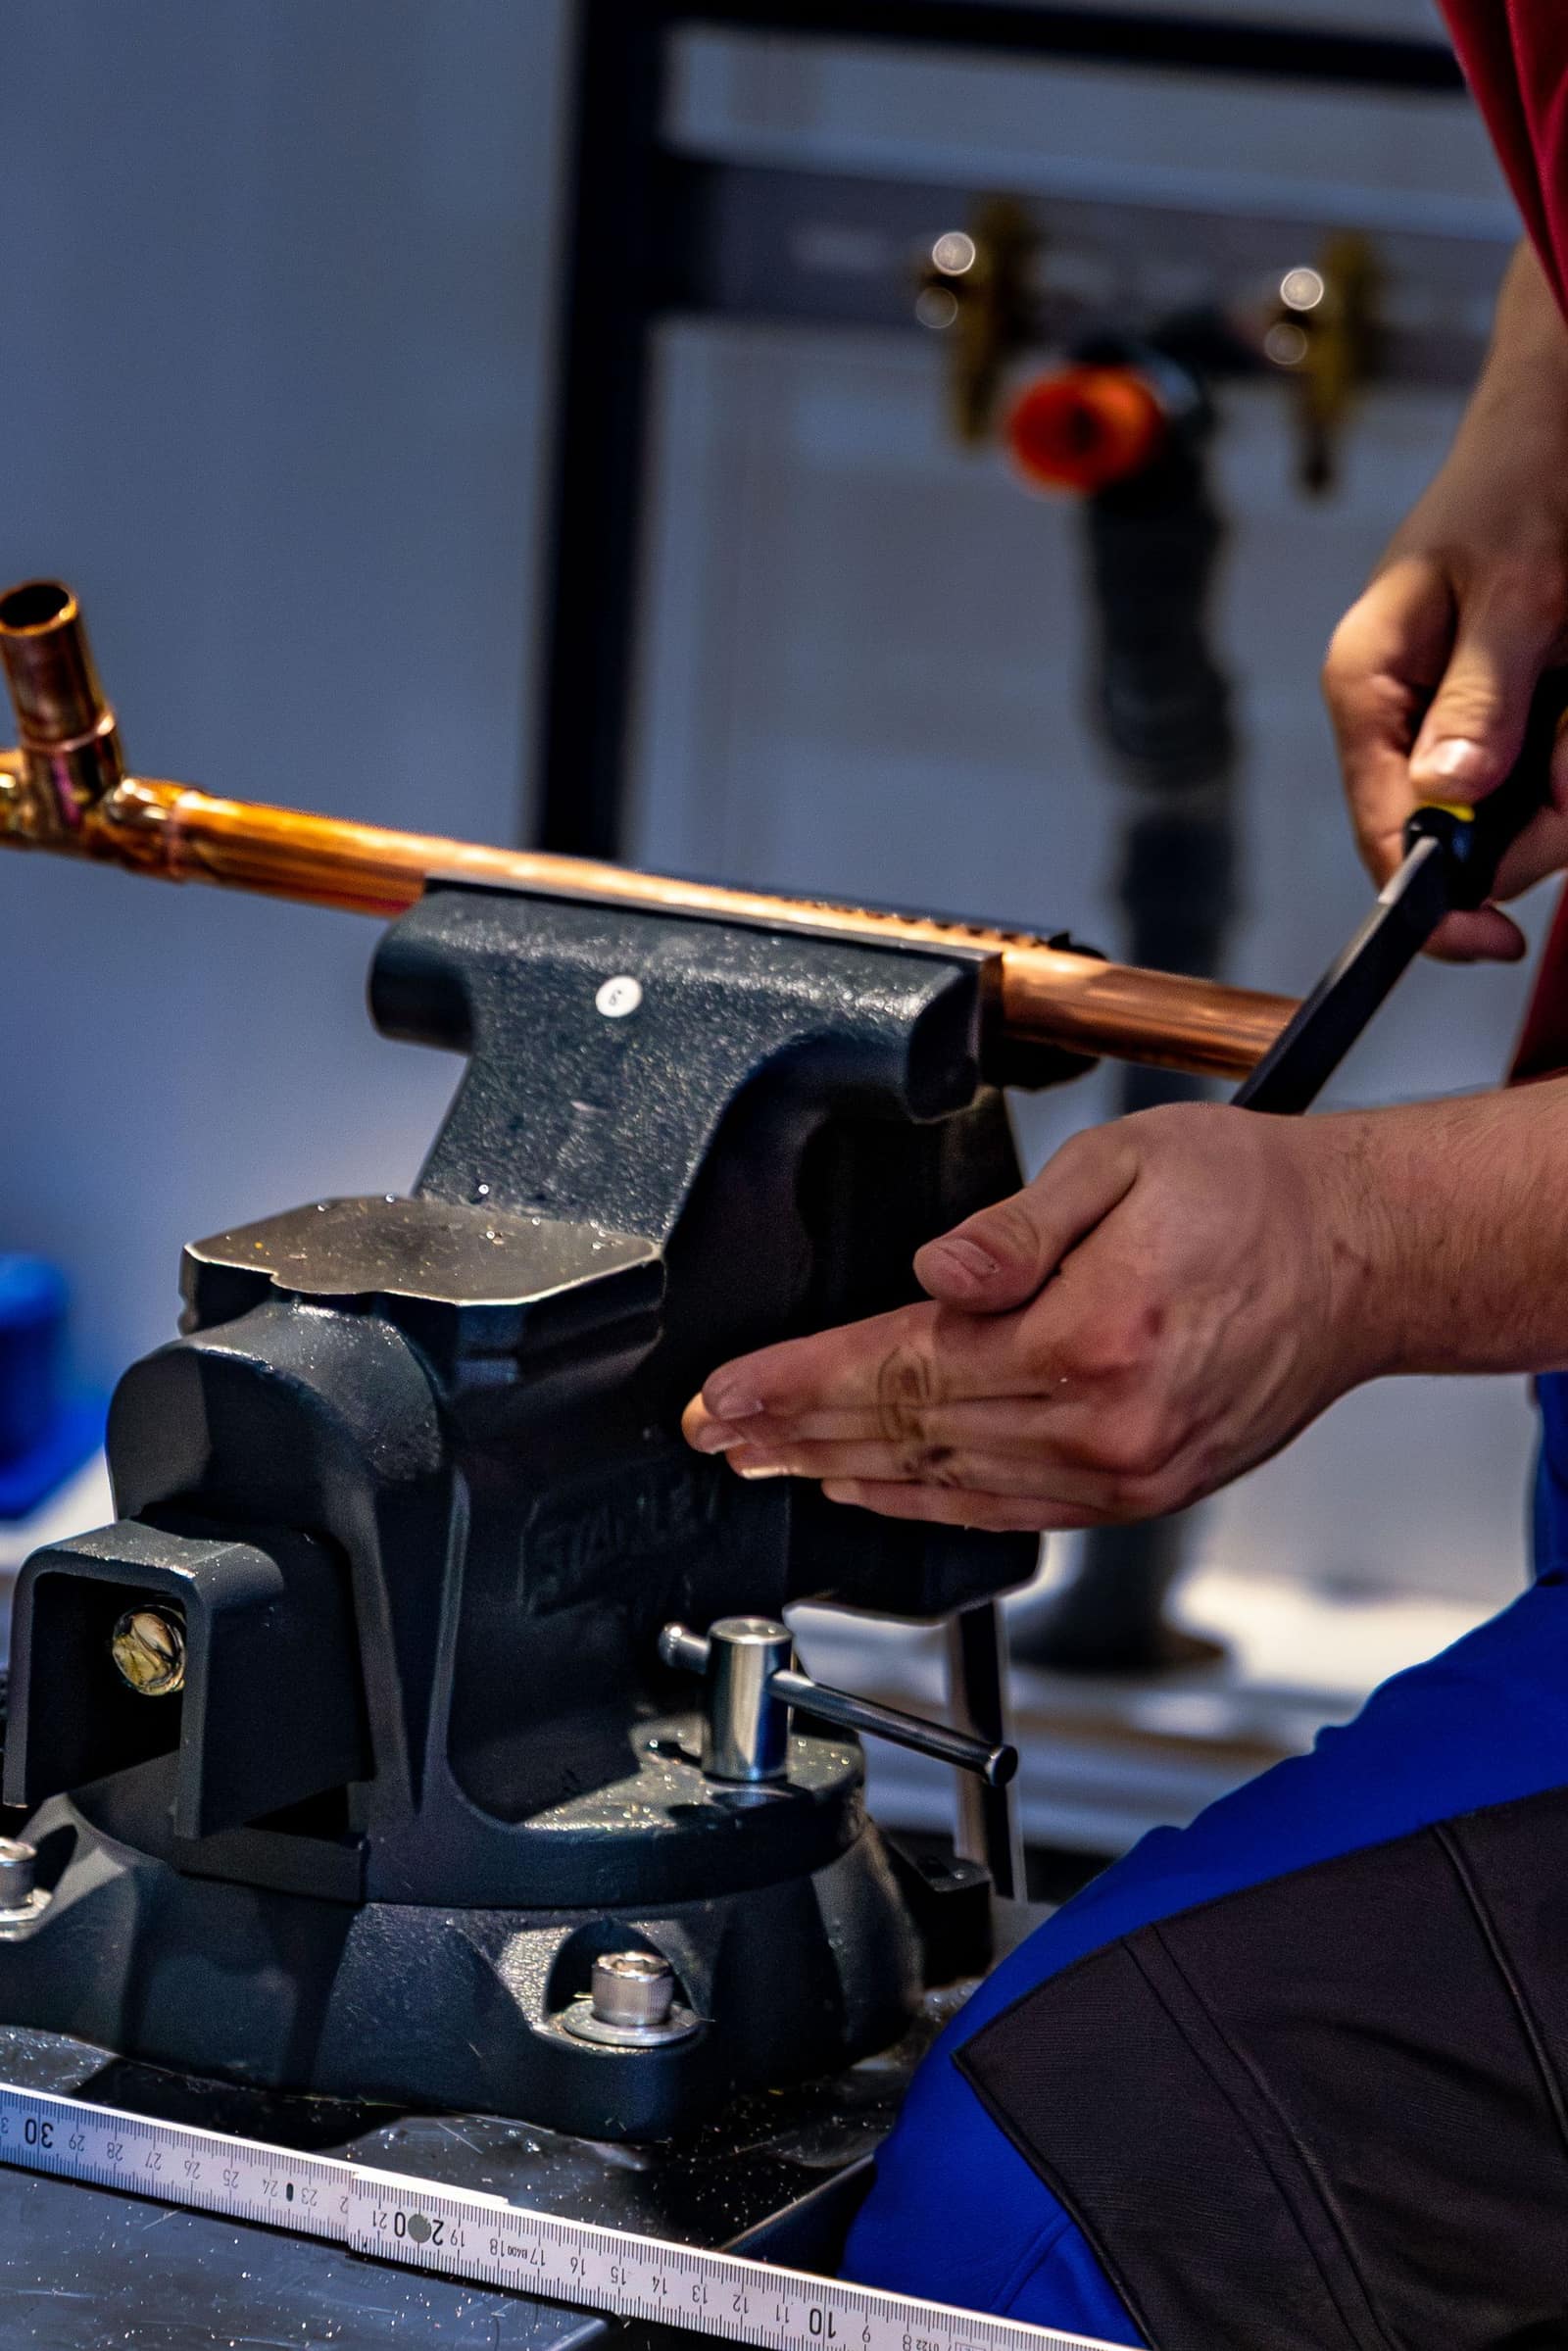
Varieties, grades and forms
- Copper rod and bare wireETP copper wire rod and drawn wire for cables.
- Enamelled winding wireFor motors, transformers and fans.
- Strip, sheet and foilFor electrical, roofing and electronics uses.
- Tubes and pipesAir-conditioning and refrigeration (ACR) and plumbing tubes.
Where it is grown or made
- GujaratDahej (smelter), Jamnagar and Rajkot
- Dadra & Nagar Haveli and Daman & DiuSilvassa and Daman — wire, strip and tube mills
- JharkhandGhatsila — copper mining and smelting
- MaharashtraMumbai, Pune and Nashik
The quality buyers ask for
- Copper grade
- ETP (Cu-ETP / C11000, 99.90% Cu min.) or DHP for tubes (C12200)
- Conductivity
- 100% IACS or higher for electrical wire (annealed)
- Size and tolerance
- Diameter or thickness with tolerance per ASTM B3/B49, EN 13601 or IS 613
- Enamel grade
- Thermal class and insulation build per IEC 60317 for winding wire
- Tubes
- ASTM B280 (ACR) or EN 12735; cleanliness and pressure tests
Certificates
- Mill test certificateRequiredChemistry, conductivity and mechanical results per lot.
- SASO conformity via SABER (Saudi Arabia)Often askedProduct and shipment certificates for regulated goods entering Saudi Arabia.
- UL recognition (winding wire, USA)Often askedAsked for by US motor and transformer makers.
- ISO 9001Often askedBasic quality system.
Shipping, storage and shelf life
Copper is dense: a 20-ft container typically reaches its weight limit (about 24–26 tonnes) before it is full.
Sea freight; road to Nepal and Bhutan.
Dry, covered storage; wrap coils to prevent oxidation.
What goes on the pack and carton
- Coil or spool tag: grade, size, net weight, lot number, producer and country of origin.
- Saudi Arabia: Arabic or bilingual labelling as the SASO regulation requires.
NABL-accredited metallurgical and electrical labs test chemistry, conductivity and enamel properties. CPRI, Bengaluru, tests conductors and cables for the power sector.
Benefits of exporting this product
- RoDTEP: 0.5% of FOB
Tariff item 7408 11 90 (wire of refined copper) earns 0.5% of FOB value, with no rupee cap, as a duty credit scrip on ICEGATE. Plates, sheets and strip (7409) and tubes (7411) carry 0.3%. These rates continue to 31 Dec 2026 (DGFT Notification 41/2026-27). Confirm your exact 8-digit line on the DGFT RoDTEP page before you price an order.
DGFT — Appendix 4R, RoDTEP schedule for DTA exports w.e.f. 10.10.2024 (Notification 32/2024-25); rates continued to 31.12.2026 by Notification 41/2026-27 ↗ - Duty drawback: 1.2% of FOB
Drawback item 7408 (copper wire) has an All Industry Rate of 1.2% of FOB, paid into your bank account. It is not available on exports under Advance Authorisation or from EOU/SEZ units. Copper strip (7409) and copper tubes and pipes (7411) also have 1.2%. Check the current schedule on the CBIC drawback page before shipping.
Gazette of India — Notification 77/2023-Customs (N.T.) dated 20.10.2023: All Industry Rates of duty drawback ↗ - Zero duty into the UK (CETA)
The India-UK CETA came into force on 15 July 2026 and gives zero-duty access to nearly 99% of India's exports; the Commerce Ministry named engineering goods among the sectors that gain. Claim it with a CETA certificate of origin and check the line for your code on the UK Trade Tariff.
PIB — India-UK CETA enters into force (15 Jul 2026): zero-duty access for nearly 99% of India's exports ↗
Where to register
- EEPC IndiaNon-ferrous metals and their products are listed under EEPC in Appendix 2T; take your RCMC from EEPC.eepcindia.org ↗
Quality and checks
- Purity and conductivity certificate (for example ETP copper, 99.9% Cu, IACS conductivity) per coil or lot.
- Dimensions, tolerance and temper to the standard named in the contract (ASTM B3/B8, EN 13601, IS 613 or buyer specification).
- Saudi Arabia: products must meet SASO technical regulations and be registered on the SABER platform before shipment.
Copper trading runs on thin margins and LME-linked prices. A newcomer can start with enamelled winding wire, copper strip or tubes from a certified mill for Gulf or South Asian cable and motor makers, on LC or advance terms.
Where new exporters go wrong
- Fixed prices on long contracts without LME cover; copper prices swing sharply.
- Oxidised or tarnished coils from poor packing — use sealed, moisture-proof wrapping.
- Missing SABER certificates for Saudi shipments; goods are held at port.
Documents this product needs
Schemes that apply
- RoDTEP Remission of Duties and Taxes on Exported Products
- Drawback Duty Drawback (All Industry Rates)
- Advance Authorisation Advance Authorisation
- EPCG Export Promotion Capital Goods Scheme
- ECGC ECGC export credit insurance for small exporters
- LUT Letter of Undertaking for zero-rated exports under GST
- Status Holder Status Holder certificate (One to Five Star Export House)
Trade data
Indian copper wire and products exports in numbers
From the Department of Commerce’s TradeStat, country by country. US$, Indian financial years (April–March).
- Exports in 2025-26
- US$ 1.27 bn +57.4% a year on average, 2020-21 to 2025-26
- Change from 2024-25
- ↑ +57.3% US$ 808 mn → US$ 1.27 bn
- Buyer countries
- 114
- Average export price
- US$ 11.37 per kg · 1,11,793 tonnes shipped · US$ 9.99 the year before
The price cycle
India’s average export price per kg each year (total value ÷ total quantity). Highest in 2025-26, lowest in 2020-21 — a 43% swing between them. Keep this swing in mind when you quote.
What next: a projection from the trend
The past trend carried forward — not a forecast by any authority. Sudden changes in policy, prices or demand are not in it.
Likely range US$ 2.16 bn to US$ 6.28 bn.
- Trend
- +53.8% a year
- Fit (R²)
- 0.87
- Based on
- 6 years of official figures
Method: a straight line through the logarithm of yearly exports (log-linear regression); range = ±1 standard error.
Biggest buyer countries
By value in 2025-26. Change is against 2024-25.
Where demand is rising and falling
Only countries that buy at least US$ 1 million or 1% of India’s exports of this product. Change from 2024-25 to 2025-26.
↑ High demand
- QatarUS$ 970k → US$ 24.8 mn↑+2,451.5%
- Saudi ArabiaUS$ 504 mn → US$ 885 mn↑+75.8%
- NepalUS$ 30.7 mn → US$ 53.5 mn↑+74.1%
- NetherlandsUS$ 9.4 mn → US$ 14.7 mn↑+56.9%
- United Arab EmiratesUS$ 21.5 mn → US$ 29.4 mn↑+36.5%
- CanadaUS$ 23 mn → US$ 29.4 mn↑+27.9%
- Sri LankaUS$ 12.1 mn → US$ 13.9 mn↑+15.1%
↓ Low demand
No sizeable country falls in this list this year.
Which forms sell, and at what price
India’s exports by 8-digit tariff line, 2025-26. Average price = total value ÷ total quantity (TradeStat): the average of every shipment on that line, not the price of any one deal.
| Tariff line | Value 2025-26 | Change | Quantity | Average price |
|---|---|---|---|---|
Other coppr wire with max crs-sec diamtr>6mm7408 11 90 · Copper, wire, of refined copper, of which the maximum cross-sectional dimension exceeds 6mm | US$ 977 mn | ↑+80.7% | 87,857 tonnes | US$ 11.12 per kgwas US$ 9.50 |
Tubes and pipes of refined copper7411 10 00 · Copper, tubes and pipes, of refined copper | US$ 89.5 mn | ↑+33.6% | 6,898 tonnes | US$ 12.98 per kgwas US$ 11.69 |
Other plates,sheets etc. of refined copper7409 19 00 · Copper, plates and sheets, of a thickness exceeding 0.15mm, of refined copper, not in coils | US$ 42.3 mn | ↑+32.2% | 3,573 tonnes | US$ 11.84 per kgwas US$ 10.52 |
Plates,sheets etc. of refind copr in coils7409 11 00 · Copper, strip, of a thickness exceeding 0.15mm, of refined copper, in coils | US$ 40.2 mn | ↑+52.5% | 3,272 tonnes | US$ 12.29 per kgwas US$ 10.90 |
Plates sheets and strip of copper-zinc base alloys(brass)in coils7409 21 00 · Copper, strip, of a thickness exceeding 0.15mm, of copper-zinc base alloys, in coils | US$ 31.7 mn | ↓-37.8% | 3,308 tonnes | US$ 9.59 per kgwas US$ 8.96 |
Tubes and pipes of copr-znc base aloys(bras)7411 21 00 · Copper, tubes and pipes, of copper-zinc base alloys | US$ 26.5 mn | ↓-9.3% | 2,170 tonnes | US$ 12.23 per kgwas US$ 11.18 |
Tubes andpips of copr-nckl bas aloys(cupro- nckl)/copr-nckl-znc base aloy(nckl-silvr)7411 22 00 · Copper, tubes and pipes, of copper-nickel base alloys or copper-nickel-zinc base alloys | US$ 19 mn | ↓-12.7% | 1,229 tonnes | US$ 15.42 per kgwas US$ 14.45 |
Plats etc..of copr-nckl base aloys(cupro- nckl)/copr-nckl-znc base aloy(nckl-silvr)7409 40 00 · Copper, plates, sheets and strip, of a thickness exceeding 0.15mm, of copper-nickel base alloys or… | US$ 12.1 mn | ↑+289.7% | 1,170 tonnes | US$ 10.33 per kgwas US$ 10.07 |
Others with cross section<=6mm7408 19 90 · Copper, wire, of refined copper, of which the maximum cross-sectional dimension is 6mm or less | US$ 7.9 mn | ↑+18.6% | 630 tonnes | US$ 12.54 per kgwas US$ 10.20 |
Plates,sheets etc..of other copper alloys7409 90 00 · Copper, plates, sheets and strip, of a thickness exceeding 0.15mm, of copper alloys | US$ 6.7 mn | ↓-36.3% | 259 tonnes | US$ 25.78 per kgwas US$ 22.09 |
Wire of copper-zinc base alloys(brass) cross-sectional dimension <= 6mm7408 21 90 · Copper, wire, of copper-zinc base alloys | US$ 6.1 mn | ↑+14.2% | 571 tonnes | US$ 10.68 per kgwas US$ 9.81 |
Other wire of copper-nckl base aloys or copper-nckl-zinc base aloys7408 22 90 · Copper, wire, of copper-nickel base alloys or copper-nickel-zinc base alloys | US$ 3.2 mn | ↓-28.9% | 164 tonnes | US$ 19.44 per kgwas US$ 19.39 |
Plates,sheetsandstrip of copper-zinc base (alloys brass) not in coils7409 29 00 · Copper, plates and sheets, of a thickness exceeding 0.15mm, of copper-zinc base alloys, not in coils | US$ 3 mn | ↑+5% | 315 tonnes | US$ 9.41 per kgwas US$ 8.92 |
Other wire of other copper alloys7408 29 90 · Copper, wire, of copper alloys | US$ 2.9 mn | ↑+20.7% | 113 tonnes | US$ 25.75 per kgwas US$ 20.37 |
The world market
Each country’s own recorded exports and imports in UN Comtrade, 2023 (the latest year nearly every country has reported).
- World imports
- US$ 44.3 bn 2023
- India among exporters
- #16 of 135 countries
- India’s share of world exports
- 2.4% US$ 1.09 bn
- Left for others to win
- US$ 44.1 bn exported by other countries
Top exporters — your competitors
- 1GermanyUS$ 6.9 bn 15.3%
- 2ChinaUS$ 4.05 bn 9%
- 3United Arab EmiratesUS$ 3.37 bn 7.5%
- 4USAUS$ 2.33 bn 5.2%
- 5CanadaUS$ 1.98 bn 4.4%
- 6BelgiumUS$ 1.85 bn 4.1%
- 7JapanUS$ 1.77 bn 3.9%
- 8PolandUS$ 1.68 bn 3.7%
- 9ThailandUS$ 1.66 bn 3.7%
- 10Rep. of KoreaUS$ 1.59 bn 3.5%
Biggest buyers in the world
- 1USAUS$ 4.34 bn 9.8%
- 2ItalyUS$ 2.61 bn 5.9%
- 3IndiaUS$ 2.09 bn 4.7%
- 4ChinaUS$ 2.06 bn 4.6%
- 5MexicoUS$ 1.87 bn 4.2%
- 6GermanyUS$ 1.77 bn 4%
- 7Saudi ArabiaUS$ 1.71 bn 3.9%
- 8FranceUS$ 1.66 bn 3.7%
- 9TürkiyeUS$ 1.4 bn 3.2%
- 10CzechiaUS$ 1.32 bn 3%
Opportunity: what these countries buy from the world, and from India
Each country’s own recorded imports in UN Comtrade, latest year it has reported. The long light part of each bar is demand other countries are filling today.
TradeStat’s 2023-24 quantities are double-counted, so that year is left out of the price. Sources: TradeStat — Export Import Data Bank, Department of Commerce · UN Comtrade database (United Nations Statistics Division) · Figures taken 29 October 2026.
Step by step
How to export copper wire and products
India refines copper and has a large wire and cable industry, and its copper wire exports are heavily concentrated in Saudi Arabia. Chile and Peru dominate mined copper; China, Japan, Korea and Germany lead in refined and semi-finished products. Demand comes from power grids, buildings, electric motors, air-conditioning and electric vehicles. Openings for smaller exporters are in enamelled winding wire, strip for electrical parts and ACR tubes for the Gulf and North America.
- 01Choose product and buyer
Cable makers, motor rewinders or HVAC firms each need different specs.
- 02Fix price basis
LME copper plus fabrication premium, fixed on an agreed date.
- 03Certify
Arrange SABER certificates for Saudi Arabia and UL where needed.
- 04Produce and test
Conductivity, elongation and dimension tests per lot.
- 05Pack and ship
Moisture-proof wrapping, pallets, weight-limited containers.
- 06Claim benefits
RoDTEP and drawback on the shipping bill.
- 07Payment
LC or advance; copper value per container is high.
Meet buyers
Trade fairs
- Every two years, spring — check the next editionwire DüsseldorfDüsseldorf, Germanywire.de ↗
- Usually April — check datesMiddle East EnergyDubai, UAEmiddleeast-energy.com ↗
- Every two years — check the next editionELECRAMA (IEEMA)Greater Noida, Indiaelecrama.com ↗
- Usually November — check datesBig 5 GlobalDubai, UAEbig5global.com ↗
Questions
Questions about exporting copper wire and products
Why is Saudi Arabia such a big buyer?
What is SABER?
Which council?
What drawback rate applies?
How do I avoid oxidised coils?
Sources (5)
- EEPC India — official site
- NABL — search for accredited testing laboratories
- Central Power Research Institute (CPRI), Bengaluru
- Gazette of India — Notification 77/2023-Customs (N.T.) dated 20.10.2023: All Industry Rates of duty drawback
- Department of Commerce, Export Import Data Bank — India's exports of HS 7408 by country, 2025-26
Who buys Indian copper wire and products
All countries →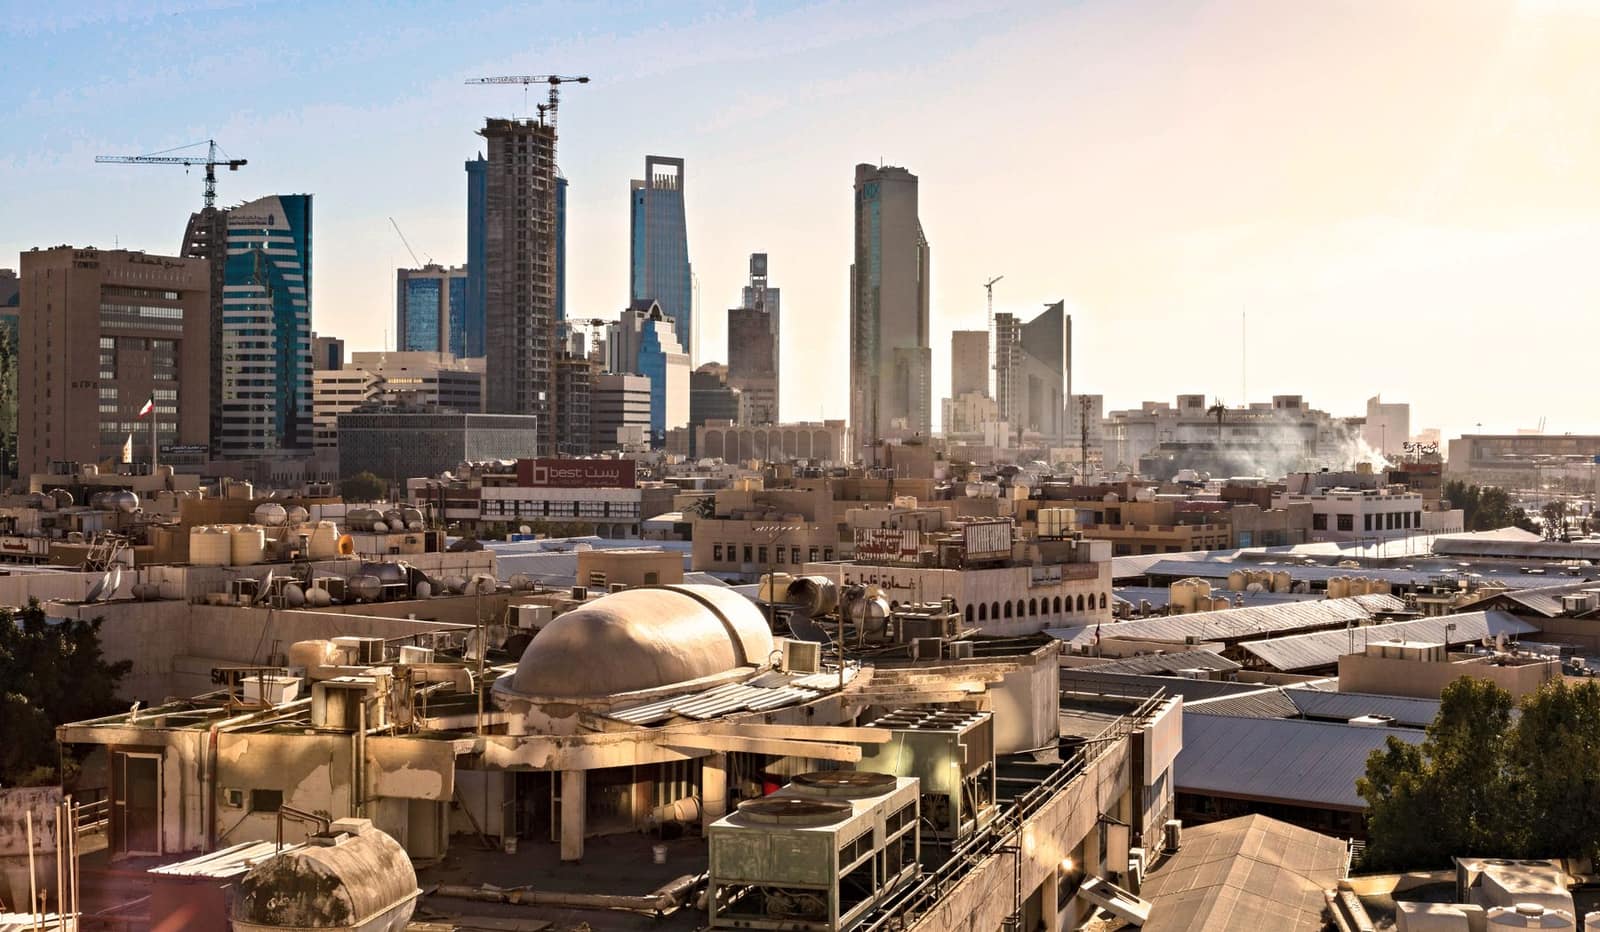 SARRiyadhSaudi ArabiaLarge Gulf market for rice, food and engineering goods. Strict SFDA food rules and SABER certification for regulated goods.From India 2025-26US$ 10.3 bn
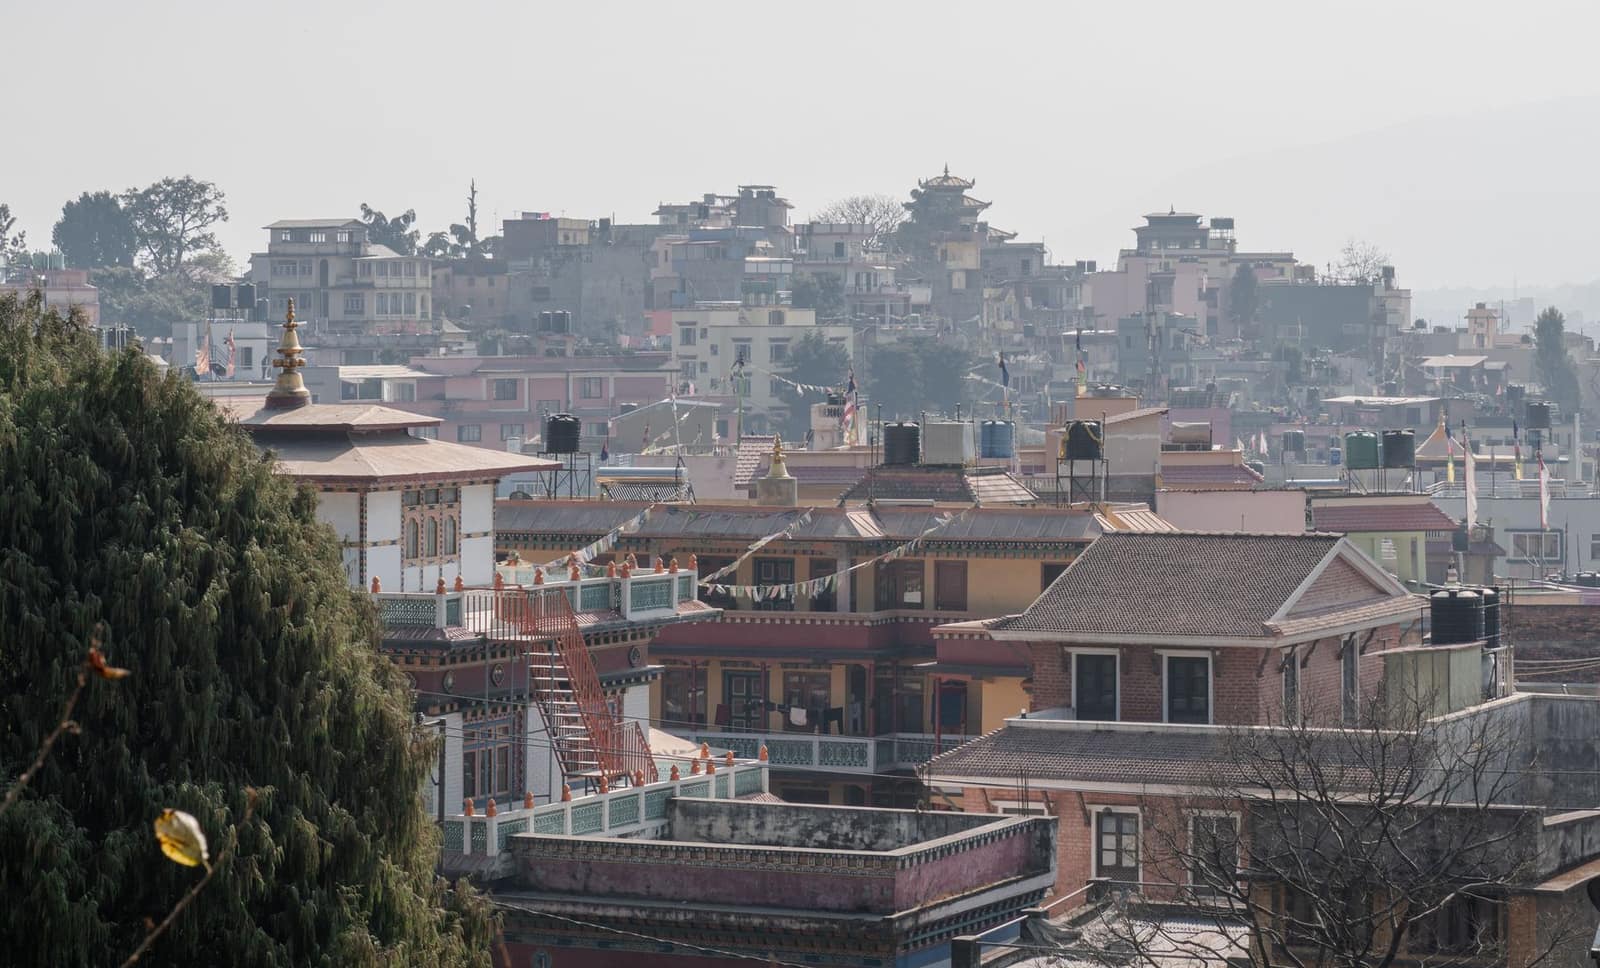 SAFTANPRKathmanduNepalOpen land border, rupee payments and a market that relies on Indian goods — an easy first market by road.From India 2025-26US$ 7.45 bn
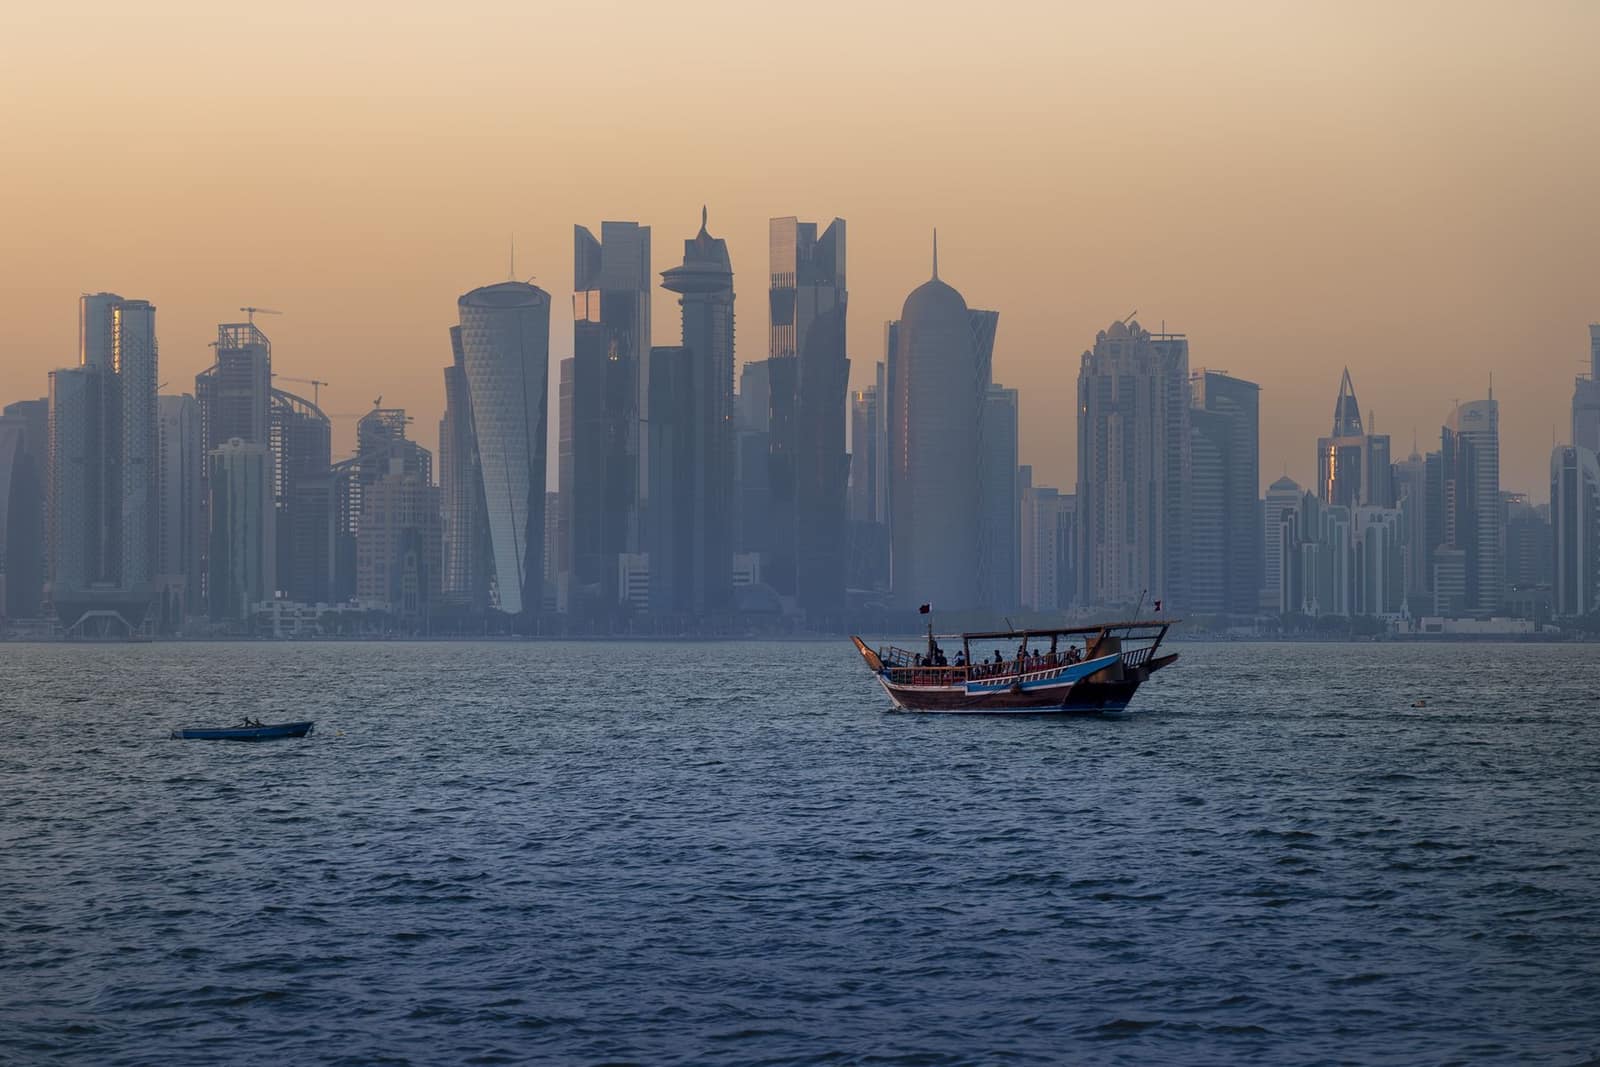 QARDohaQatarSmall, wealthy Gulf market with a huge Indian workforce. Imports nearly all its food.From India 2025-26US$ 1.62 bn
 ISFTALKRSri Jayawardenepura Kotte (Colombo is the commercial capital)Sri LankaClose island market with India's oldest FTA. Buys food, medicines, vehicles, yarn and building materials.From India 2025-26US$ 5.52 bn
 KESNairobiKenyaEast Africa's trade gateway via Mombasa. Buys medicines, vehicles, steel and rice; KEBS pre-shipment checks apply.From India 2025-26US$ 4.02 bn
 USDWashington, D.C.United States of AmericaIndia's largest single-country export market. Strict FDA rules for food; extra 10% US duty on most goods since July 2026.From India 2025-26US$ 87.3 bn
 CEPAAEDAbu DhabiUnited Arab EmiratesIndia's biggest Gulf buyer and a re-export hub for the Middle East and Africa. CEPA in force since 2022.From India 2025-26US$ 37.4 bn
 CADOttawaCanadaLarge Indian diaspora market. Importer needs a CFIA licence for food; labels in English and French.From India 2025-26US$ 4.67 bn
More in engineering goods
All products → Free to exportEngineering goodsAuto parts and componentsOEM and aftermarket vehicle parts; the USA, Germany and Italy buy most, with strong demand in Latin America.HS8708Exports 2025-26US$ 7.64 bn ↑1.8%
 Free to exportEngineering goodsIron and steel castingsGrey and ductile iron and steel castings from Kolhapur, Rajkot, Coimbatore and Howrah; the USA leads.HS7325Exports 2025-26US$ 1.25 bn ↑3.2%
 Free to exportEngineering goodsHand toolsHammers, wrenches, pliers and garden tools from Jalandhar and Ludhiana; the USA buys most.HS8205Exports 2025-26US$ 161 mn ↓7%
 Free to exportEngineering goodsPumpsAgricultural, domestic and industrial pumps from Coimbatore, Rajkot and Ahmedabad; the USA leads.HS8413Exports 2025-26US$ 1.6 bn ↑5.2%