


Europe
Export to Norway
High-income Nordic buyer covered by India–EFTA TEPA since October 2025. Strict food and product-safety rules.
- Capital
- Oslo
- Currency
- NOK
- Trade agreement with India
- India–EFTA Trade and Economic Partnership Agreement (TEPA) 1 October 2025
- Main ports
- Oslo, Bergen, Stavanger
Norway is a small but wealthy market. It is not in the EU, but as a member of the European Economic Area it applies most EU rules on food safety, chemicals and product safety. TEPA removes or cuts duty on most Indian industrial goods, while farm products stay heavily protected.

Norway is one of the four EFTA countries. Under TEPA the EFTA side offered market access on 92.2% of its tariff lines, covering 99.6% of India's exports, including all non-agricultural products. Claim the lower duty with a TEPA certificate of origin from DGFT's online platform and check the rules of origin for your product.
What it buys from India
- Garments, home textiles and other textile products
- Machinery, electrical equipment and metal products
- Organic chemicals and medicines
- Rice, spices, tea and processed food for South Asian and mainstream shops
Import rules on their side
- Food must meet EU-level rules on pesticide residues, contaminants and labelling; the Norwegian Food Safety Authority (Mattilsynet) checks imports, and labels must be in Norwegian.
- Consumer goods such as toys, electrical items and machinery must carry CE marking and meet EEA product-safety and chemicals (REACH) rules.
- Norwegian Customs (Tolletaten) collects duty and 25% general VAT at import; the importer must be registered with customs.
Practical tips
- Buyers expect proof of social and environmental compliance (factory audits, chemical test reports). Keep these ready before the first meeting.
- Much Norwegian trade passes through Swedish, Danish or German importers; an EU distributor can be a practical first step.
- Payment on open account is common with established buyers; for a new buyer ask for an advance or an LC and take ECGC cover.
Trade data
India’s exports to Norway in numbers
From the Department of Commerce’s TradeStat (Indian financial years, April–March), the country’s imports from the world from UN Comtrade, and its basics from the World Bank.
- India’s exports here, 2025-26
- US$ 472 mn No. 74 of our 80 countries
- Change from 2024-25
- ↑ +11% US$ 425 mn → US$ 472 mn
- Share of all Indian exports
- 0.11%
- Its imports from the world
- —
What India sells here most
By HS chapter, 2025-26. Change is against 2024-25.
What is rising and what is falling
Chapters where India sells at least US$ 5 million. Change from 2024-25 to 2025-26.
↑ High demand
- Vehicles and partsUS$ 4.5 mn → US$ 38.5 mn↑+746.9%
- AluminiumUS$ 3.2 mn → US$ 8.8 mn↑+176.1%
- MachineryUS$ 18.1 mn → US$ 25.2 mn↑+39.2%
- Leather goods, bagsUS$ 5.5 mn → US$ 7.4 mn↑+35.3%
- Ships and boatsUS$ 33.4 mn → US$ 43.4 mn↑+29.8%
- RubberUS$ 10.4 mn → US$ 13.1 mn↑+26.6%
- Knitted garmentsUS$ 4 mn → US$ 5.1 mn↑+26.2%
- FootwearUS$ 10.8 mn → US$ 13.6 mn↑+25.7%
↓ Low demand
- Flour, malt, starchUS$ 51.2 mn → US$ 31.4 mn↓-38.6%
- Home textiles, made-upsUS$ 29.3 mn → US$ 24.3 mn↓-17.2%
- Animal feed and food residuesUS$ 22.5 mn → US$ 18.9 mn↓-15.9%
- Woven garmentsUS$ 14.1 mn → US$ 12.2 mn↓-13%
- CarpetsUS$ 6.4 mn → US$ 5.6 mn↓-13%
Our product guides that sell here
India’s exports of each product to this country, 2025-26.
The 20 biggest export lines
4-digit HS lines, 2025-26, with their Harmonized System descriptions.
What India buys from Norway
India’s imports from this country in 2025-26 by HS chapter, from TradeStat — this country can be your supplier too.
- India’s imports, 2025-26
- US$ 635 mn US$ 633 mn → US$ 635 mn
- India’s exports, 2025-26
- US$ 472 mn
- Trade balance
- −US$ 163 mn exports minus imports
- Change in imports
- +0.4%
The country at a glance
- Population
- 5.6 mn 2025
- GDP
- US$ 530.8 bn 2025
- GDP per person
- US$ 94,594 2025
- Imports (goods and services)
- US$ 178.8 bn 2025
Sources: TradeStat — Export Import Data Bank, Department of Commerce · World Bank — World Development Indicators · Figures taken 29 October 2026.
What to send to Norway
All products →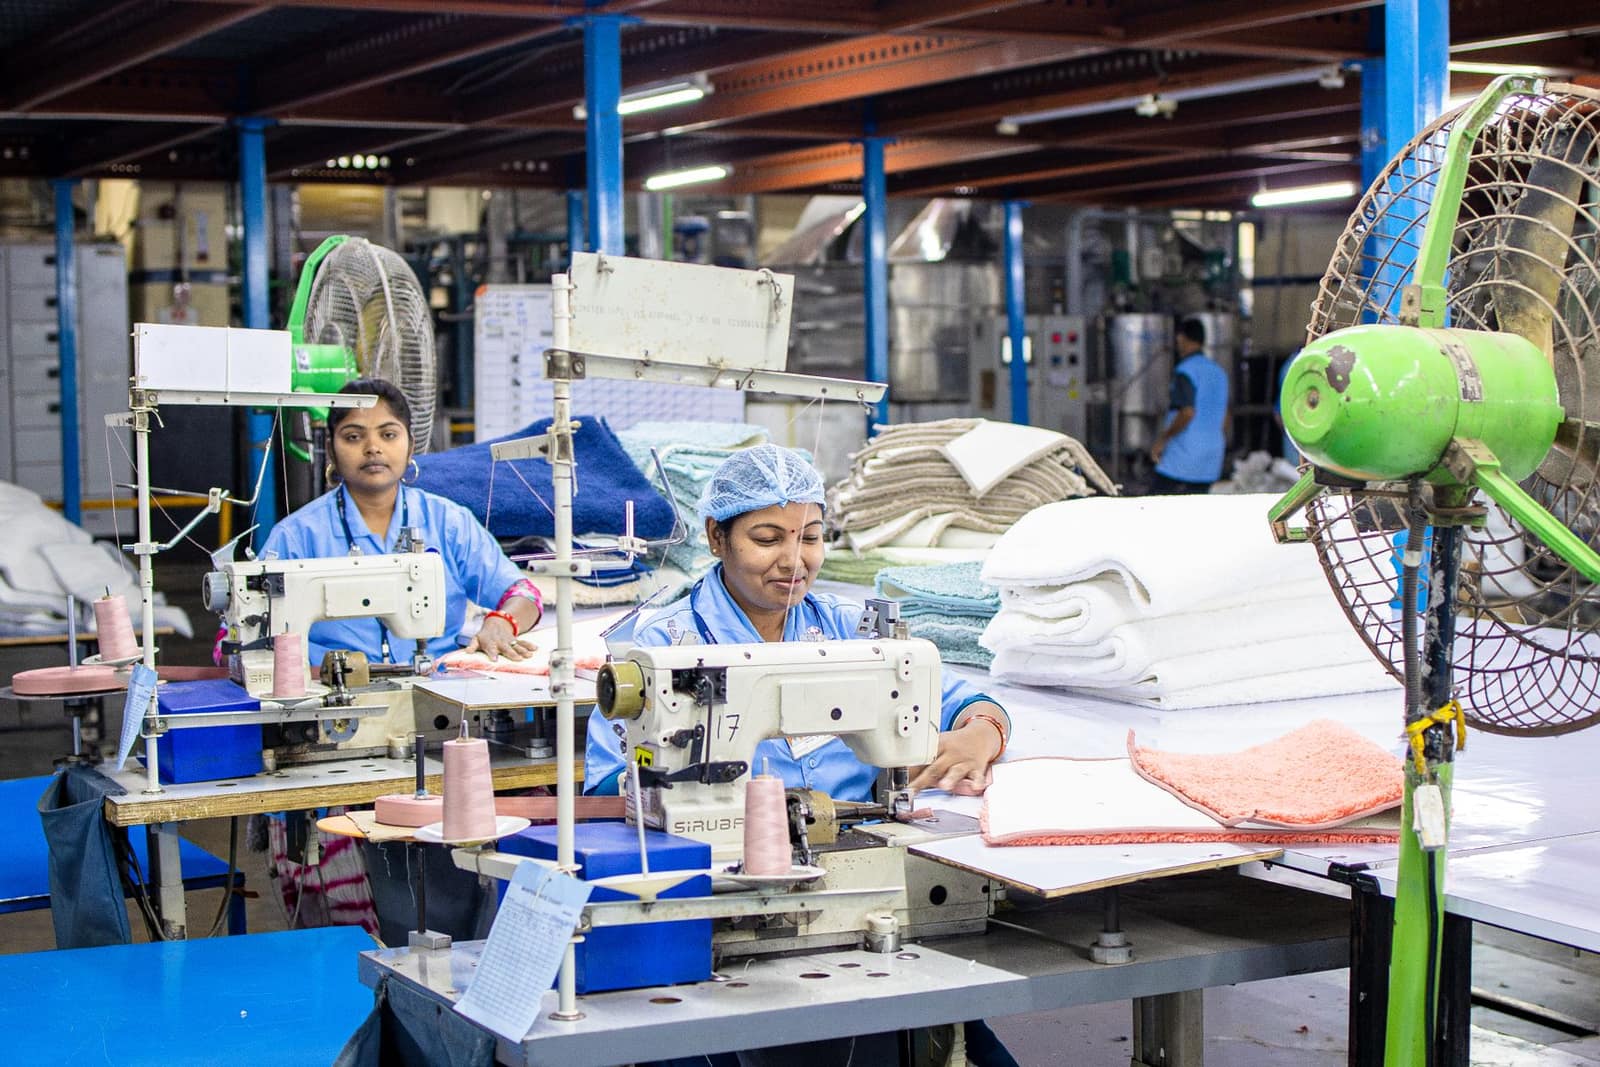 Free to exportTextiles & apparelReadymade garmentsKnitted and woven clothing for brands and retailers; the USA, UK, UAE and the EU are the big buyers.HS6109.10Exports 2025-26US$ 15.8 bn ↓1.2%
 Free to exportTextiles & apparelHome textiles (bed, bath and kitchen linen)Bedsheets, towels and kitchen linen for retailers; the USA buys more than half of India's exports.HS6302Exports 2025-26US$ 2.01 bn ↓5.7%
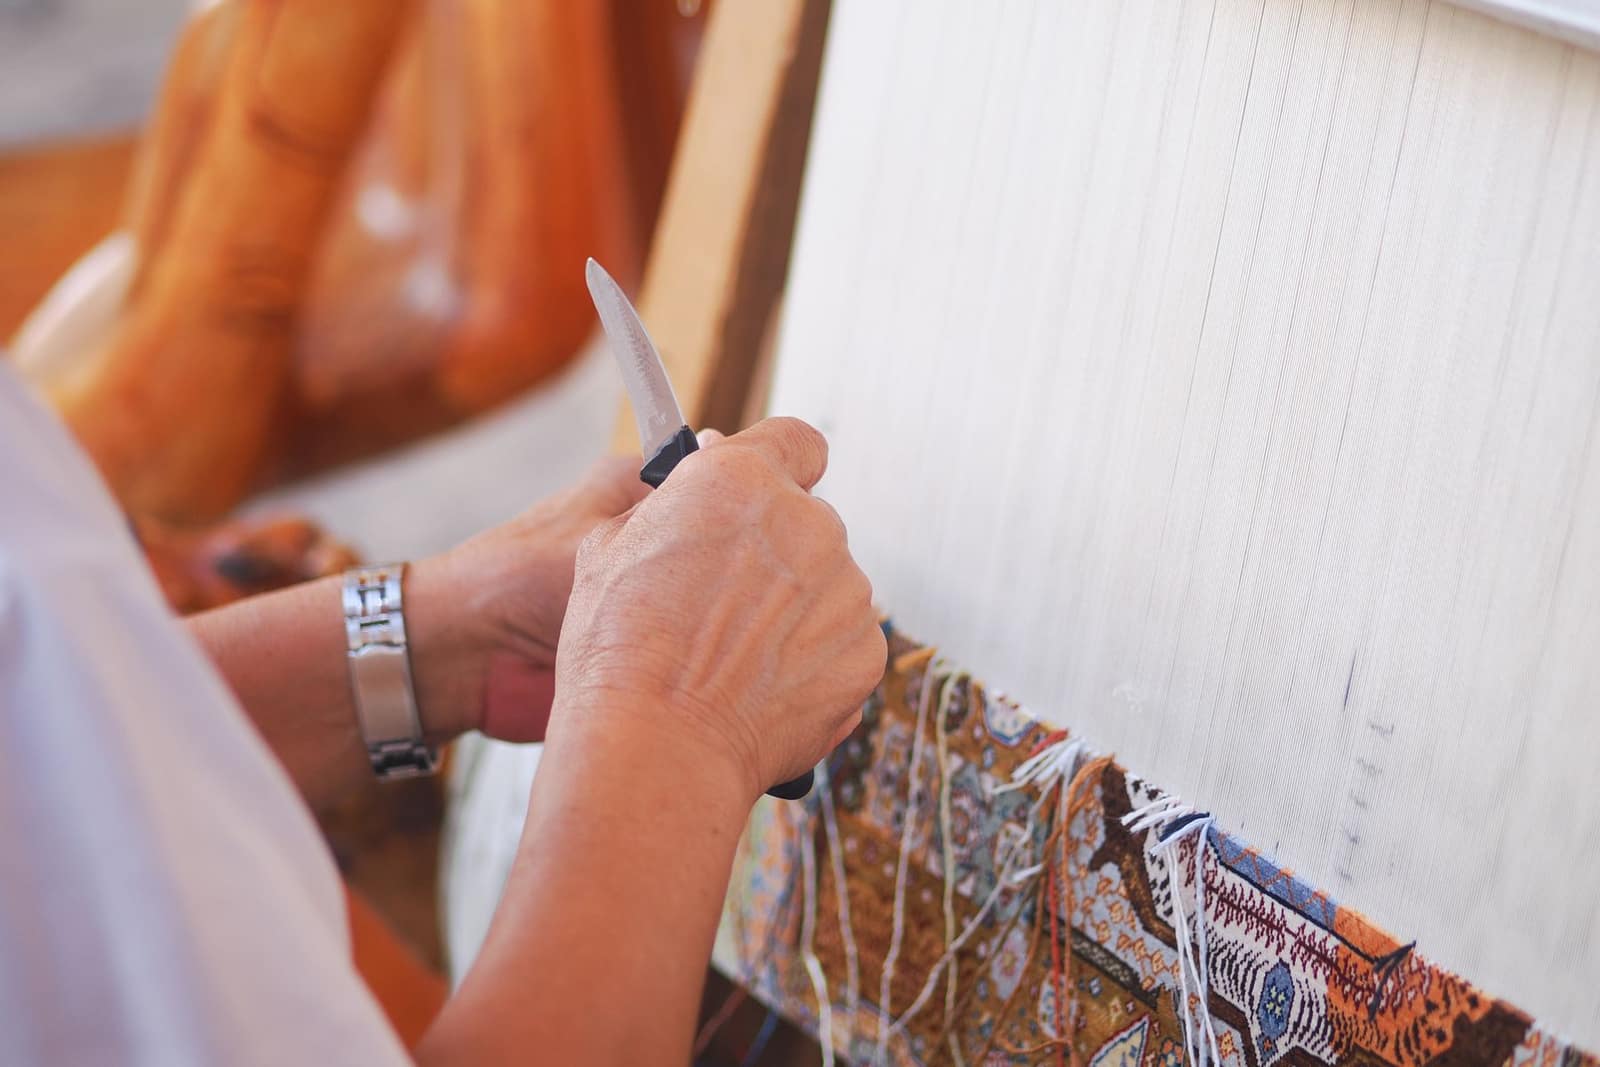 Free to exportTextiles & apparelCarpets and rugsHand-knotted, tufted and flat-woven rugs from Bhadohi, Jaipur and Panipat; the USA buys over half.HS5701Exports 2025-26US$ 1.97 bn ↓5.9%
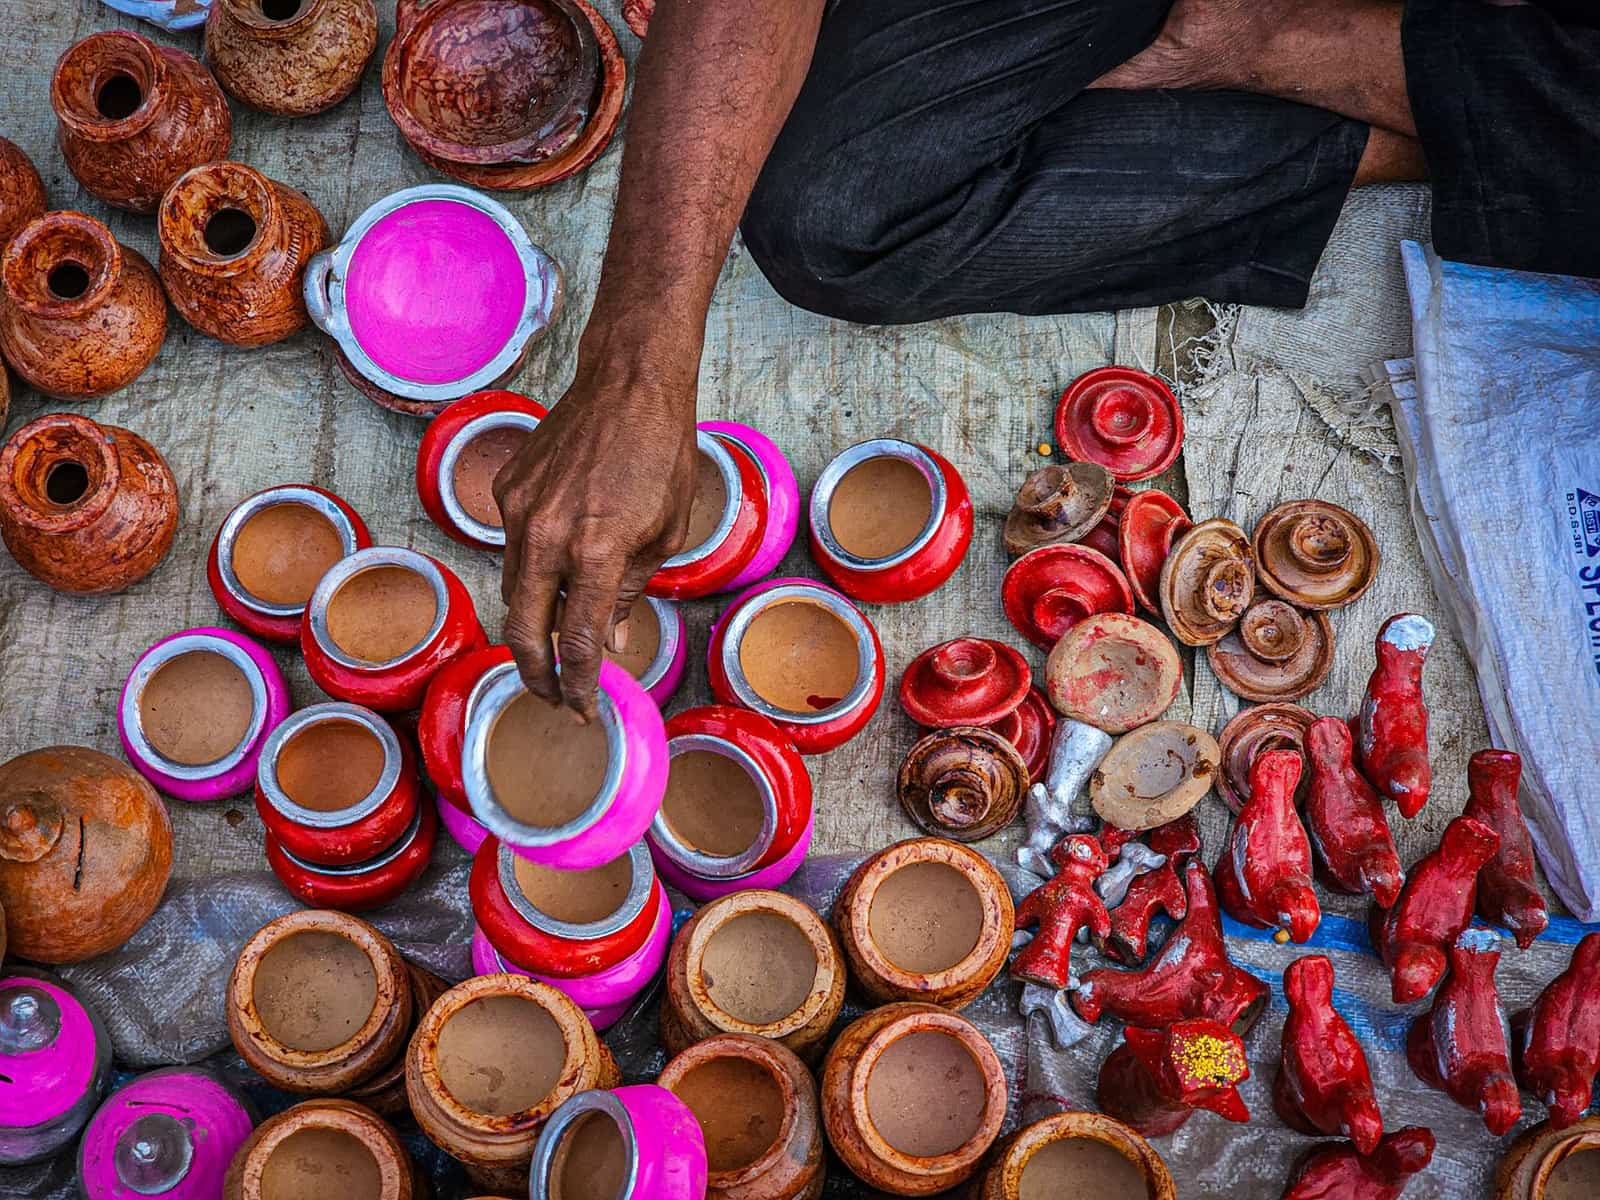 Free to exportHandicraftsHandicrafts (cane, bamboo, jute and natural fibre)Baskets, storage, lamps and décor from cane, bamboo and grasses, sold to home-décor importers.HS4602Exports 2025-26US$ 23.3 mn ↓20.7%
 Free, with conditionsLeather & footwearLeather goods (bags, wallets, belts)Leather handbags, wallets and travel goods for brands; the USA and Europe buy most.HS4202Exports 2025-26US$ 1.59 bn ↓1.8%
 Free to exportLeather & footwearFootwearLeather shoes, sandals and boots from Agra, Kanpur and Tamil Nadu; the USA, UK and Germany lead.HS6403Exports 2025-26US$ 1.69 bn ↓4.7%
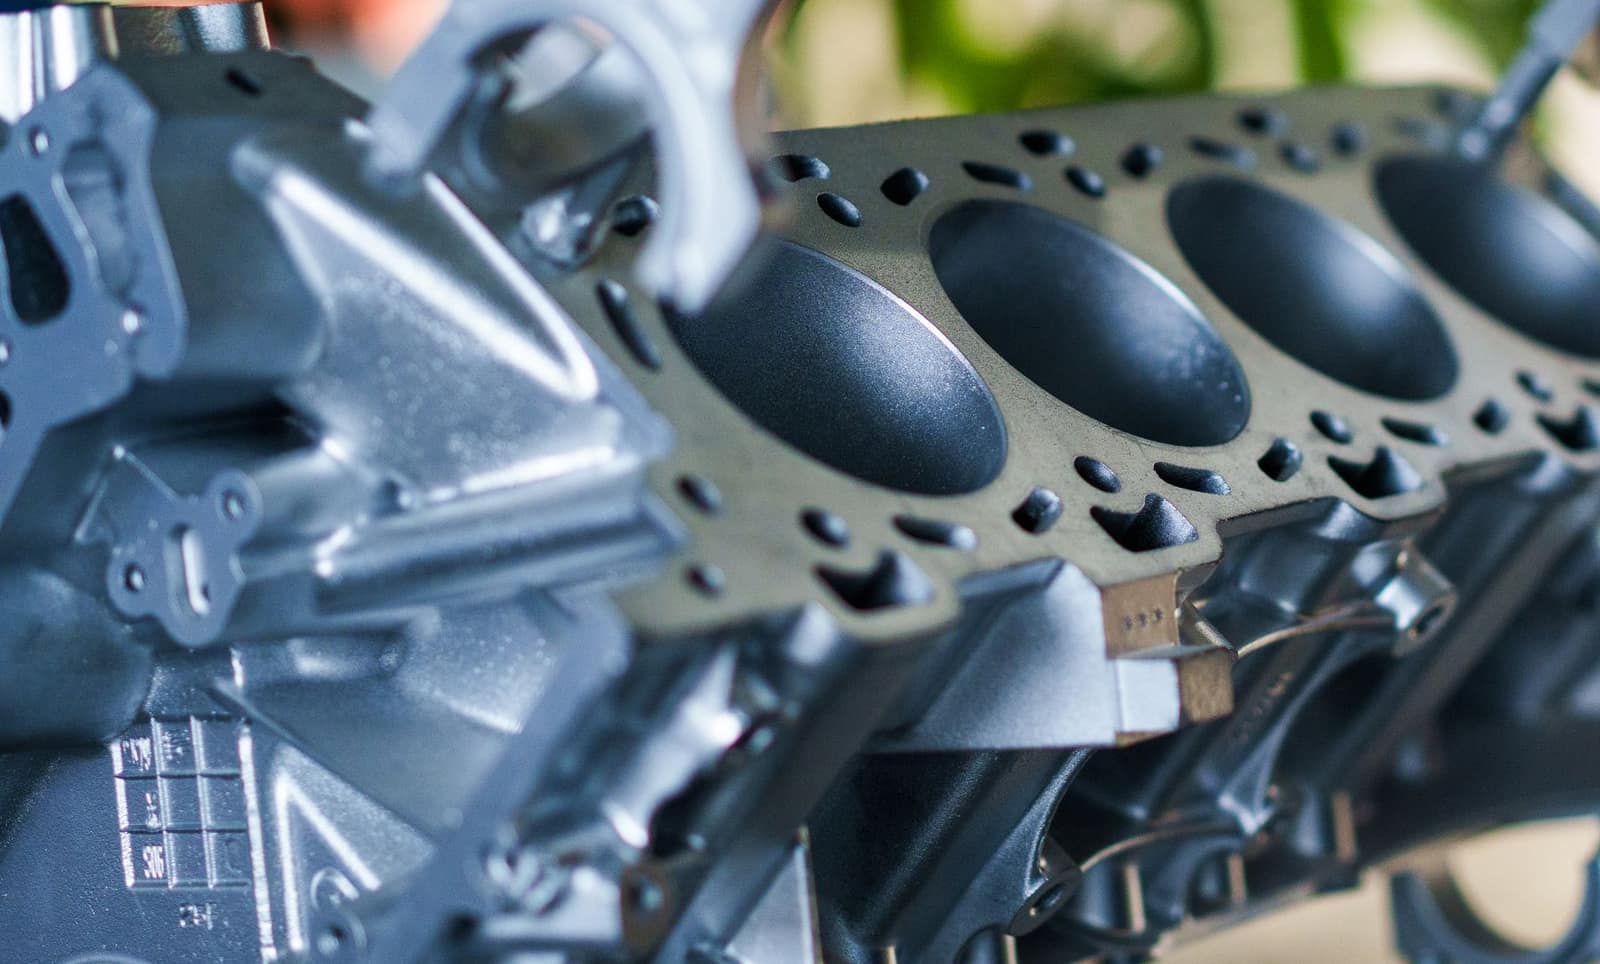 Free to exportEngineering goodsAuto parts and componentsOEM and aftermarket vehicle parts; the USA, Germany and Italy buy most, with strong demand in Latin America.HS8708Exports 2025-26US$ 7.64 bn ↑1.8%
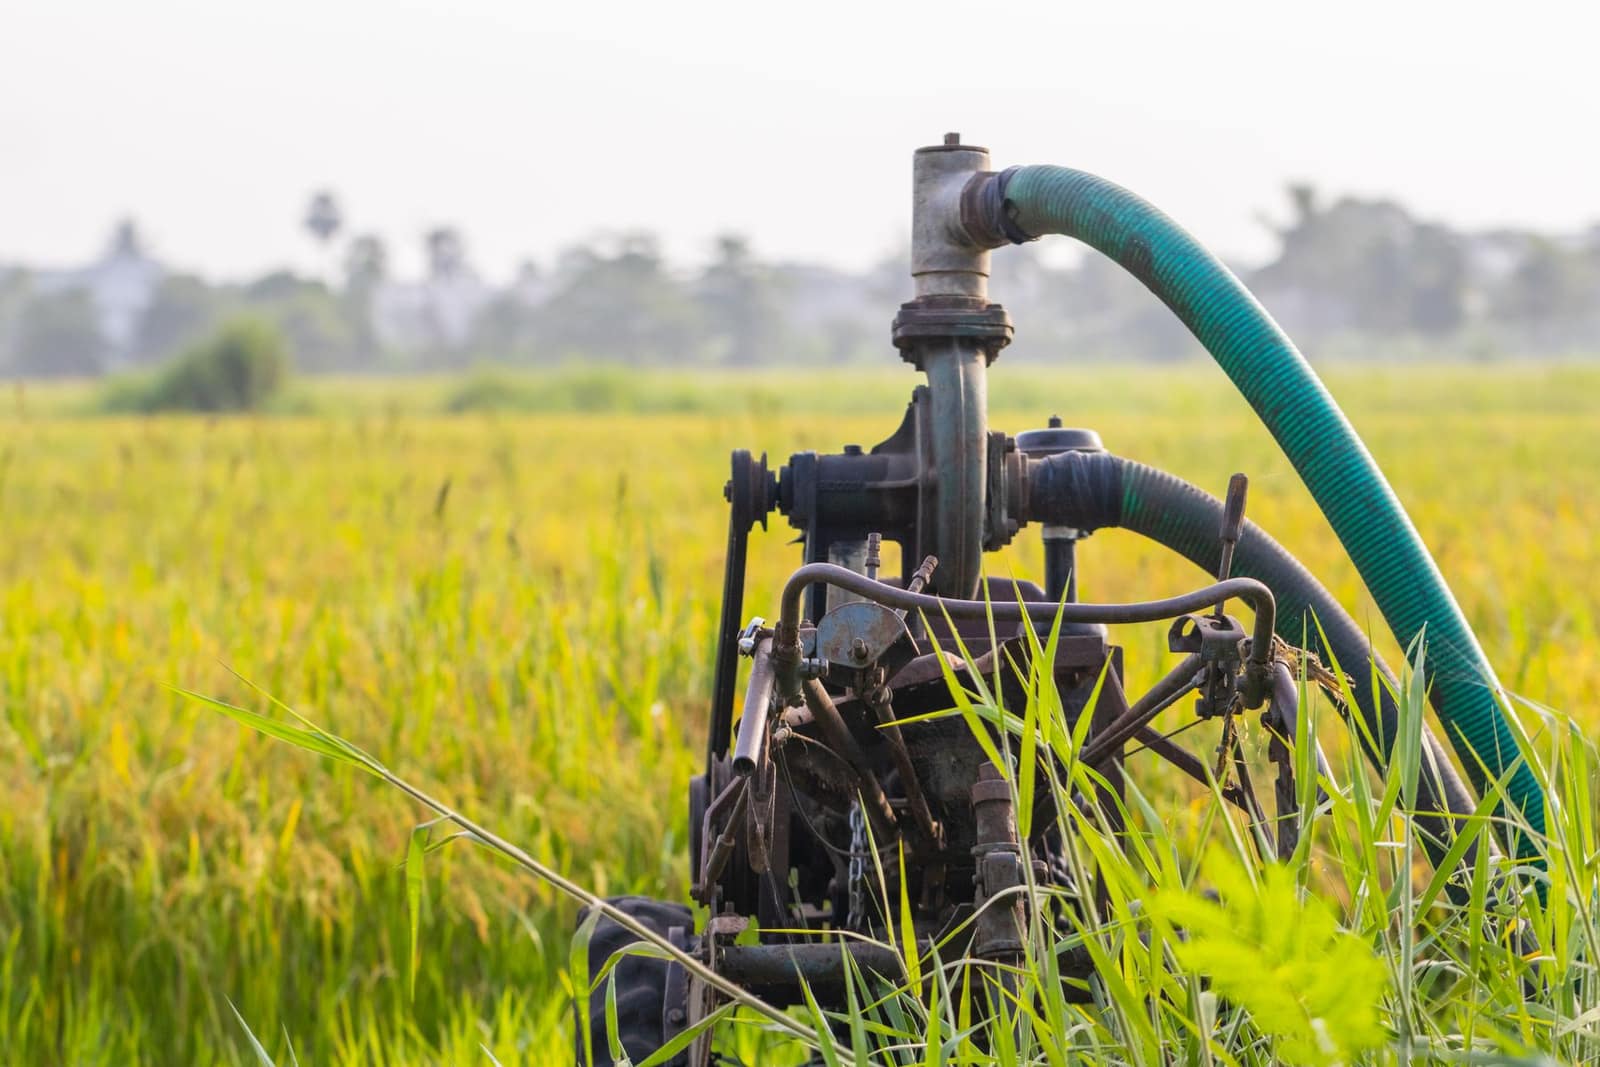 Free to exportEngineering goodsPumpsAgricultural, domestic and industrial pumps from Coimbatore, Rajkot and Ahmedabad; the USA leads.HS8413Exports 2025-26US$ 1.6 bn ↑5.2%
More in Europe
 CETAGBPLondonUnited KingdomNew CETA in force since July 2026 — most Indian goods now enter duty-free. Strong market for garments, food and engineering.From India 2025-26US$ 13.4 bn
 EURAmsterdamNetherlandsEurope's main gateway: Rotterdam handles goods for the whole EU. EU food-safety and residue rules apply.From India 2025-26US$ 17.5 bn
 EURBerlinGermanyEurope's largest economy and India's biggest EU partner. Values quality, certificates and supply-chain transparency.From India 2025-26US$ 11.5 bn
 EURParisFranceFashion, food and design market. EU rules plus French-language labels; SIAL Paris is a key food fair.From India 2025-26US$ 7.1 bn