

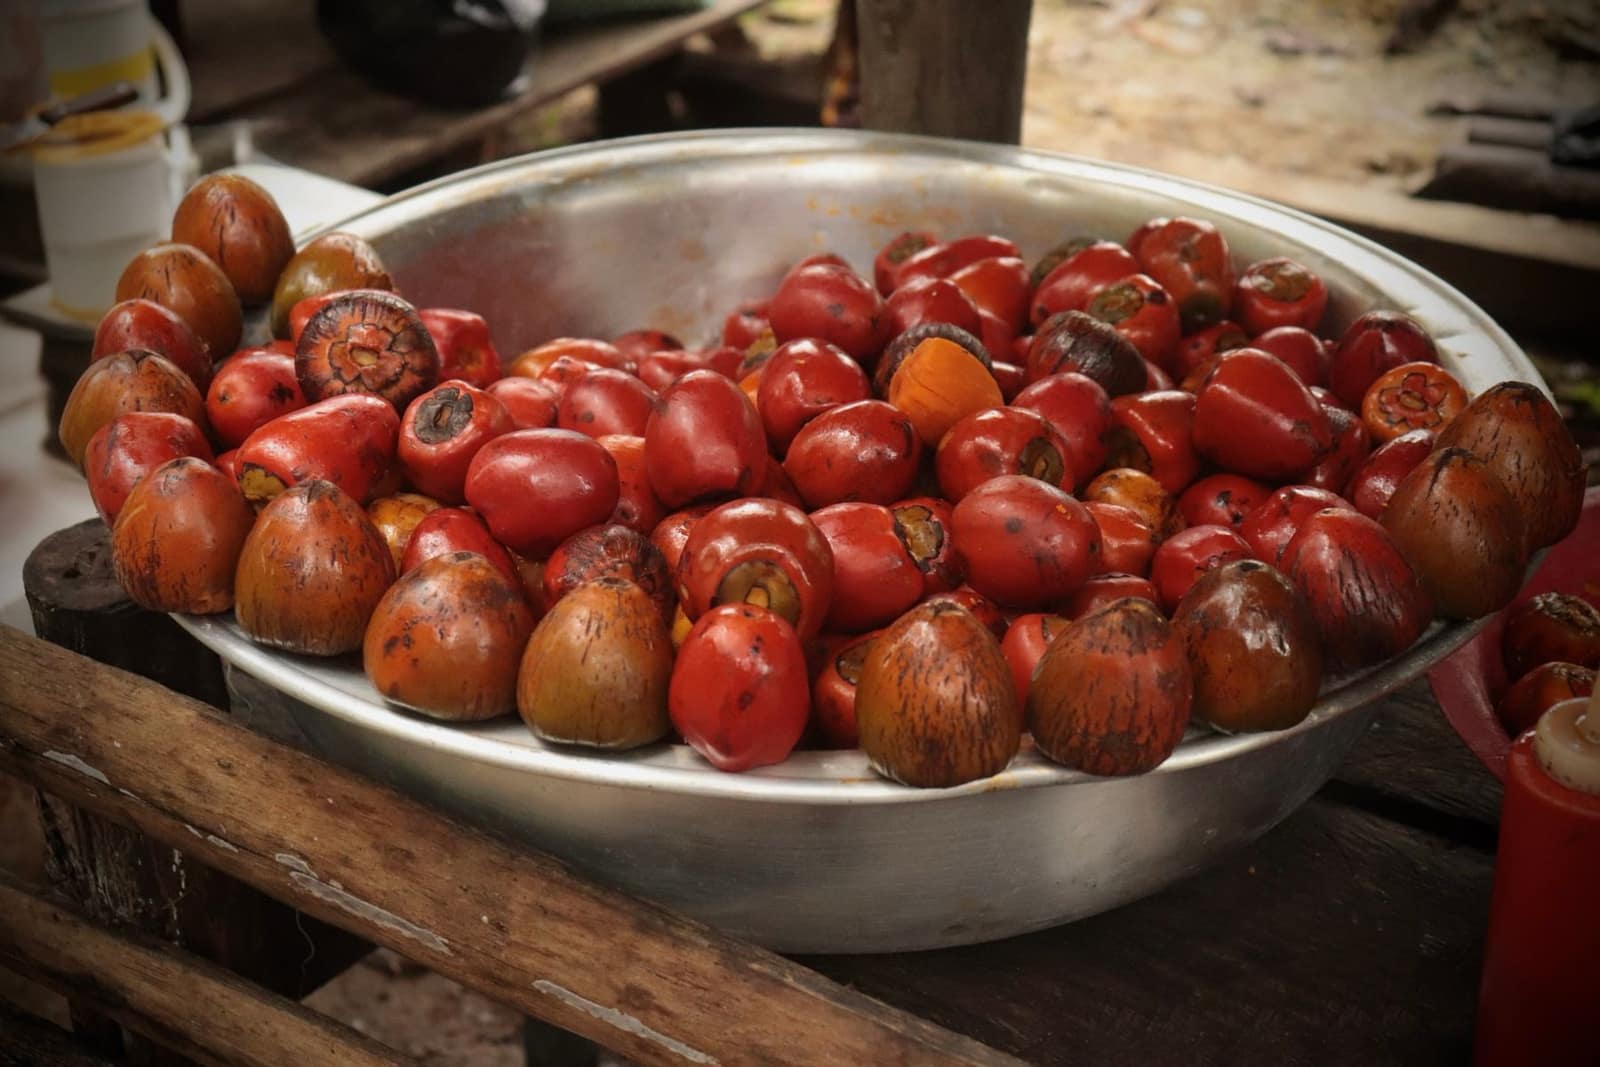
Food and farm goods
Import edible oils (palm, soybean, sunflower)
India’s biggest food import. Duty on crude oils was cut on 24 Sep 2026: 5% on crude palm and soybean, nil on crude sunflower.
- Basic customs duty
- 5–27.5% 5% crude palm and crude soybean; Nil crude sunflower; 27.5% refined palm and refined soybean; 22.5% refined sunflower
- Social welfare surcharge
- 10% of the duty (BCD + AIDC)
- IGST
- 5% 5%
- India’s imports, 2025-26
- US$ 19.1 bn from 48 countries
Notification 31/2026-Customs (in force 24 Sep 2026) amended 45/2025-Customs: crude soybean oil 10% → 5%, refined soybean 32.5% → 27.5%, crude palm oil 10% → 5%, refined palm 32.5% → 27.5%, crude sunflower 10% → Nil, refined sunflower 32.5% → 22.5%. Duty on edible oils is charged on the tariff value that CBIC notifies every fortnight, not on your invoice value. Government figures put the total on crude palm and soybean oil at about 11% after this cut; work out your own figure on ICEGATE. AIDC 5% on crude palm, soybean and sunflower oil — check the effective rate on ICEGATE. CBIC — Notification 31/2026-Customs (edible oil duty cut, in force 24 Sep 2026) ↗
What is imported
India buys most of its cooking oil from abroad. In FY 2025-26 imports were about US$ 9.6 billion of palm oil, US$ 6.2 billion of soybean oil and US$ 3.3 billion of sunflower and safflower oil (TradeStat). Palm oil comes from Indonesia and Malaysia, soybean oil from Argentina and Brazil (and Nepal under the trade treaty), and sunflower oil from Russia, Argentina and Ukraine. Most is imported crude by refiners in bulk tankers.
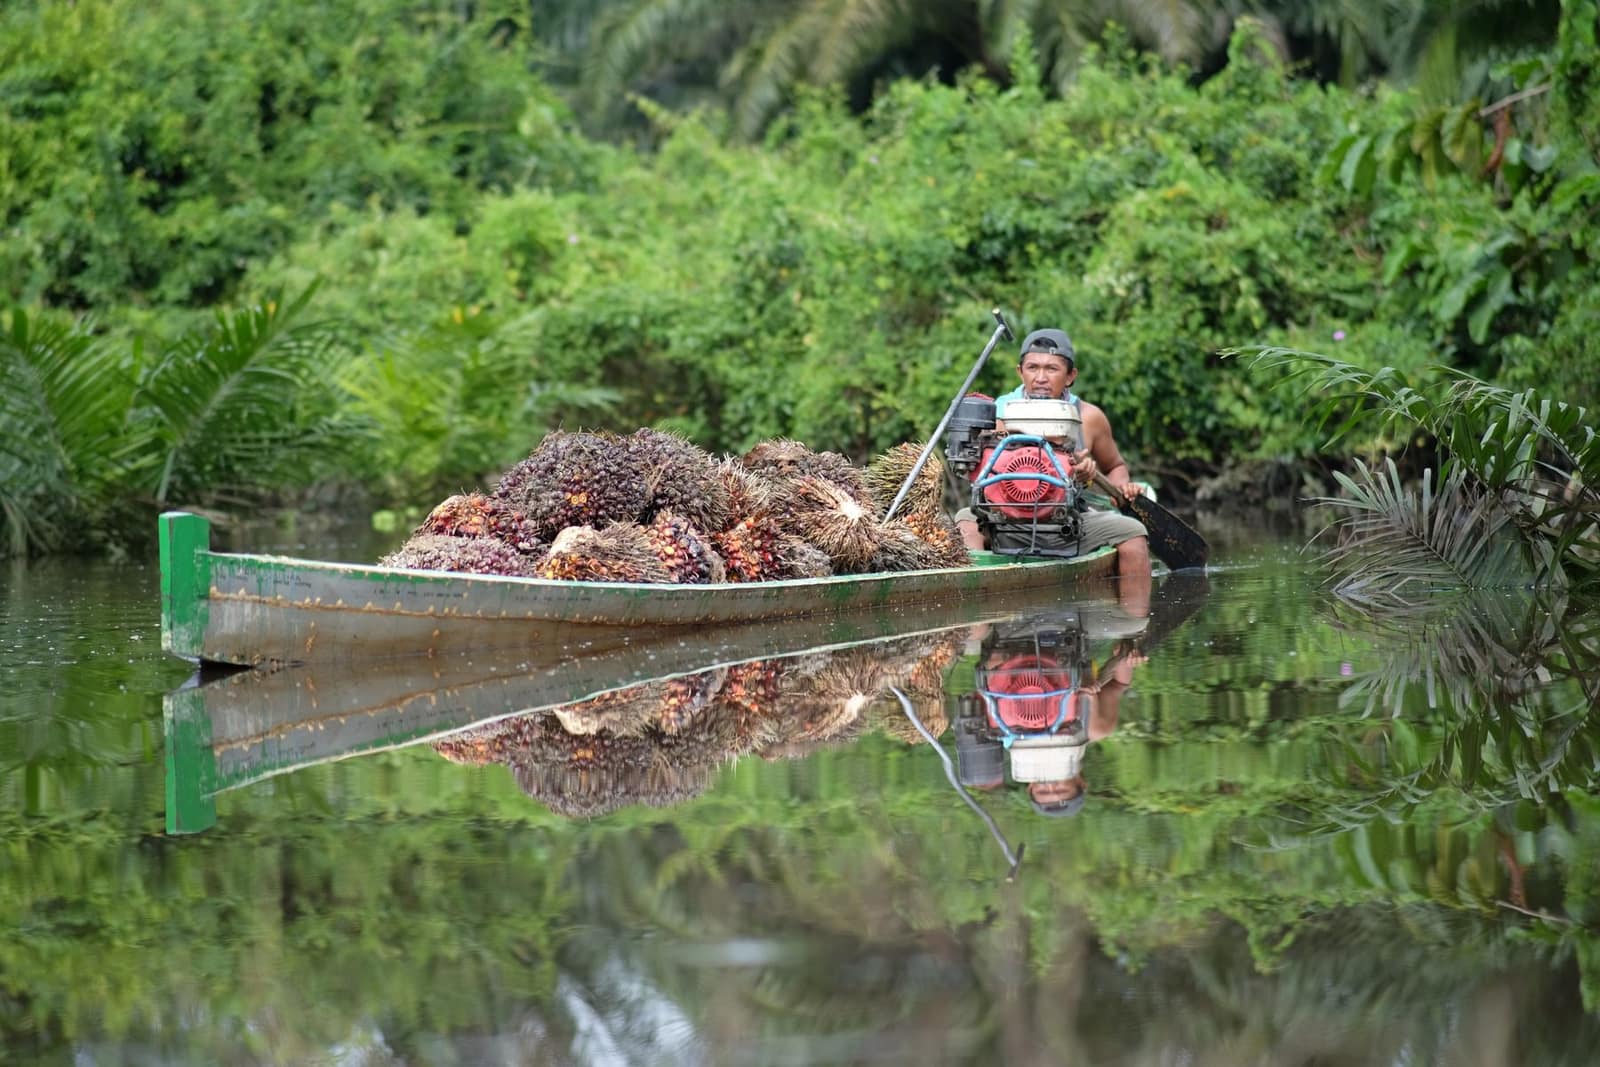
Crude edible oils are free under ITC(HS). The policy for refined palm oil and palmolein (1511 90) has changed several times in recent years — confirm the current status on the DGFT ITC(HS) page before you contract.
Licences and registrations you need
- FSSAICentral licence for food importers (FoSCoS), then a No Objection Certificate for each consignment through FICS at the port.fics.fssai.gov.in ↗
- Legal Metrology (Consumer Affairs)Importer registration under the Legal Metrology (Packaged Commodities) Rules if you import or sell retail packs.consumeraffairs.nic.in ↗
- DGFTCheck the ITC(HS) policy for your exact 8-digit code; refined palm products have had import conditions at times.dgft.gov.in ↗
What is checked at the port
- FSSAI sampling for free fatty acid, moisture, adulteration and labelling (for packed oil).
- Customs checks crude versus refined classification — the duty gap is large.
- Assessment on the notified tariff value for the date the bill of entry is filed.
Practical tips
- Small importers usually buy refined, packed oil from Indian refiners rather than importing bulk; direct import makes sense at tanker or flexitank scale.
- Track the fortnightly tariff value notification; it changes your duty even when the rate stays the same.
Where new importers go wrong
- Pricing a deal on the old rate — edible oil duty has changed several times between 2024 and 2026.
- Declaring partly refined oil as crude; customs labs test it and the difference in duty is recovered with penalty.
Sources (6)
- CBIC — Notification 31/2026-Customs (edible oil duty cut, in force 24 Sep 2026)
- CBIC — Customs Tariff of India (as on 30.06.2025)
- DGFT — ITC(HS) import policy (Schedule 1)
- FSSAI — Food Import Clearance System (FICS)
- Commerce Ministry TradeStat — commodity-wise imports by country (FY 2025-26)
- ICEGATE — Customs duty and tariff look-up
Import data
Where India buys edible oils (palm, soybean, sunflower)
India’s imports from the Department of Commerce’s TradeStat, country by country. US$, financial years.
- Imports, 2025-26
- US$ 19.1 bn
- Change from 2024-25
- ↑+11.9%
- Supplying countries
- 48
- Biggest supplier
- Indonesia 20%
Biggest supplying countries
Which sources are growing and shrinking
↑ Growing sources
↓ Shrinking sources
- SwitzerlandUS$ 329 mn → US$ 216 mn↓-34.5%
- RussiaUS$ 2.39 bn → US$ 1.66 bn↓-30.5%
- NetherlandsUS$ 264 mn → US$ 199 mn↓-24.8%
Which forms come in, and at what price
Imports by 8-digit tariff line, 2025-26. Average price = total value ÷ total quantity.
| Tariff line | Value 2025-26 | Change | Quantity | Average price |
|---|---|---|---|---|
Crude palm oil and its fractns1511 10 00 | US$ 9.05 bn | ↑+41.4% | 8.17 mn tonnes | US$ 1.11 per kg |
Soya bean crude oil whether or not degummed1507 10 00 | US$ 5.26 bn | ↑+12.8% | 4.71 mn tonnes | US$ 1.12 per kg |
Vegetable oils, sunflower seed or safflower oil and their fractions, crude, not chemically modified — sunflower seed oil crude1512 11 10 | US$ 3.25 bn | ↓-11.2% | 2.68 mn tonnes | US$ 1.21 per kg |
Soya bean oil of edible grade1507 90 10 | US$ 950 mn | ↑+145.8% | 6,51,701 tonnes | US$ 1.46 per kg |
Refined blchd deodrsed palmolein1511 90 20 | US$ 372 mn | ↓-79.3% | 3,42,549 tonnes | US$ 1.09 per kg |
Vegetable oils, palm oil and its fractions, other than crude, whether or not refined, but not chemically… — other refined palm oil1511 90 90 | US$ 90.7 mn | ↑+770.5% | 73,041 tonnes | US$ 1.24 per kg |
Sunflower oil edible grade1512 19 10 | US$ 66.4 mn | ↑+21.3% | 43,311 tonnes | US$ 1.53 per kg |
Refined bleached deodorised palm stearin1511 90 30 | US$ 63.8 mn | ↓-37.7% | 60,588 tonnes | US$ 1.05 per kg |
Refined bleached deodrsed palm oil1511 90 10 | US$ 12.3 mn | ↓-13.2% | 9,380 tonnes | US$ 1.31 per kg |
Cotton sd oil crud whether or not gosypl has been remvd1512 21 00 | US$ 2.2 mn | — | 1,943 tonnes | US$ 1.12 per kg |
Soya bean oil other than edible grade1507 90 90 | US$ 1.4 mn | ↑+21.1% | 252 tonnes | US$ 5.48 per kg |
Other cotton seed oil excludingd edble grade1512 29 90 | US$ 870k | ↑+262.5% | 15 tonnes | US$ 59.26 per kg |
Source: TradeStat — Export Import Data Bank, Department of Commerce · Figures taken 29 October 2026.
More in food and farm goods
All import guides → Free to importFood and farm goodsAlmondsIndia’s largest dry-fruit import. Fixed duty per kg, FSSAI clearance at the port, almost all of it from the USA.Basic duty₹35/kgIGST5%India imported 2025-26US$ 1.43 bn
 Free to importFood and farm goodsPistachios10% basic duty, FSSAI clearance, supply from the USA, Iran, the UAE and Afghanistan.Basic duty10%IGST5%India imported 2025-26US$ 262 mn
 Free to importFood and farm goodsDates20% duty on soft and hard dates, 30% on fresh. The UAE and Iraq are the main suppliers.Basic duty20–30%IGST5%India imported 2025-26US$ 341 mn
 Free to importFood and farm goodsRaw cashew nuts (in shell)Raw material for India’s cashew processing units. 2.5% duty; most comes from West Africa and Tanzania.Basic duty2.5%IGST5%India imported 2025-26US$ 2.29 bn