


Europe
Export to Ukraine
Wartime market that still imports Indian medicines, food and machinery. Insurance, routing and payment need extra care.
- Capital
- Kyiv
- Currency
- UAH
- Trade agreement with India
- None
- Main ports
- Odesa, Chornomorsk, Pivdennyi
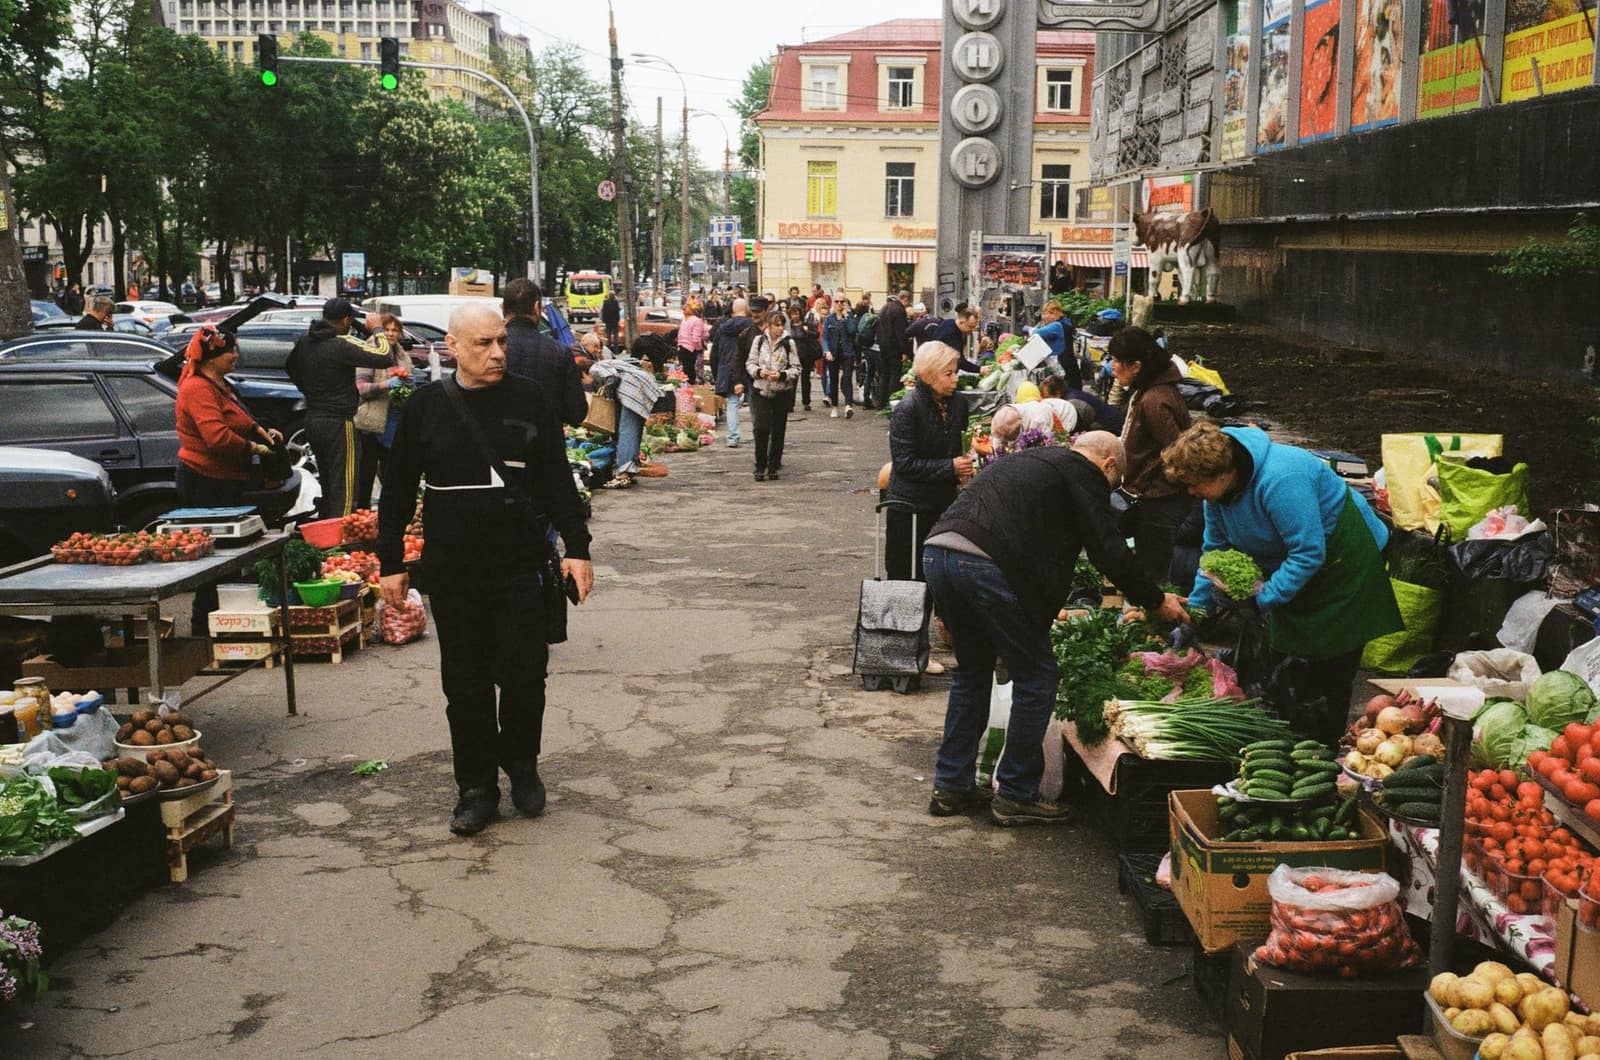
Ukraine has been at war since Russia’s full-scale invasion in February 2022, yet it continues to import medicines, food, machinery and consumer goods. Indian exports include medicines, tea, coffee, spices and machinery. Shipments often travel through EU ports such as Constanța or Gdańsk and then by road or rail, and insurance and payment terms must be agreed carefully.
What it buys from India
- Medicines and pharmaceutical products
- Tea, coffee, spices and other food
- Machinery and electrical equipment
Import rules on their side
- Medicines must be registered in Ukraine through a local importer; food and plant products are controlled by the State Service on Food Safety and Consumer Protection.
- Ukraine is aligning its product and food rules with the EU; check with the buyer which certificates are currently accepted.
- Labels must be in Ukrainian. Customs clearance is handled by the State Customs Service.
Practical tips
- Ukrainian airspace has been closed to civil flights since the invasion, so there is no direct air cargo; plan sea-plus-land routes through neighbouring EU countries.
- Take advance payment or an LC confirmed by a bank outside Ukraine, and check ECGC’s current cover for Ukraine before giving credit.
- Quote delivery at an EU border point (for example DAP Constanța) unless your insurer covers carriage inside Ukraine.
Sources (6)
- State Customs Service of Ukraine
- State Service of Ukraine on Food Safety and Consumer Protection
- ECGC Ltd — export credit insurance and country risk
- Ministry of External Affairs — travel and country advisories
- Department of Commerce — TradeStat export-import data bank
- Indian Trade Portal (FIEO / Department of Commerce) — market access by country
Trade data
India’s exports to Ukraine in numbers
From the Department of Commerce’s TradeStat (Indian financial years, April–March), the country’s imports from the world from UN Comtrade, and its basics from the World Bank.
- India’s exports here, 2025-26
- US$ 220 mn No. 79 of our 80 countries
- Change from 2024-25
- ↑ +17.5% US$ 187 mn → US$ 220 mn
- Share of all Indian exports
- 0.05%
- Its imports from the world
- —
What India sells here most
By HS chapter, 2025-26. Change is against 2024-25.
What is rising and what is falling
Chapters where India sells at least US$ 5 million. Change from 2024-25 to 2025-26.
↑ High demand
- Iron and steelUS$ 2.9 mn → US$ 17.2 mn↑+485.4%
- Fish and seafoodUS$ 2.9 mn → US$ 7.6 mn↑+164%
- Cereals (rice, wheat, maize)US$ 6.2 mn → US$ 15.5 mn↑+152.2%
- Oilseeds and seedsUS$ 3.3 mn → US$ 5.8 mn↑+76.5%
- Ceramics and tilesUS$ 3.2 mn → US$ 5.3 mn↑+68.6%
- PlasticsUS$ 5.2 mn → US$ 8.7 mn↑+66.3%
- Organic chemicalsUS$ 4.3 mn → US$ 6.6 mn↑+52.7%
- Instruments, medical devicesUS$ 5.3 mn → US$ 6.9 mn↑+29.2%
↓ Low demand
- RubberUS$ 14.5 mn → US$ 9.6 mn↓-33.7%
Our product guides that sell here
India’s exports of each product to this country, 2025-26.
The 20 biggest export lines
4-digit HS lines, 2025-26, with their Harmonized System descriptions.
What India buys from Ukraine
India’s imports from this country in 2025-26 by HS chapter, from TradeStat — this country can be your supplier too.
- India’s imports, 2025-26
- US$ 851 mn US$ 1.04 bn → US$ 851 mn
- India’s exports, 2025-26
- US$ 220 mn
- Trade balance
- −US$ 631 mn exports minus imports
- Change in imports
- -18%
The country at a glance
- Population
- 39.0 mn 2025
- GDP
- US$ 214.2 bn 2025
- GDP per person
- US$ 5,866 2025
- Imports (goods and services)
- US$ 111.1 bn 2025
Sources: TradeStat — Export Import Data Bank, Department of Commerce · World Bank — World Development Indicators · Figures taken 29 October 2026.
What to send to Ukraine
All products →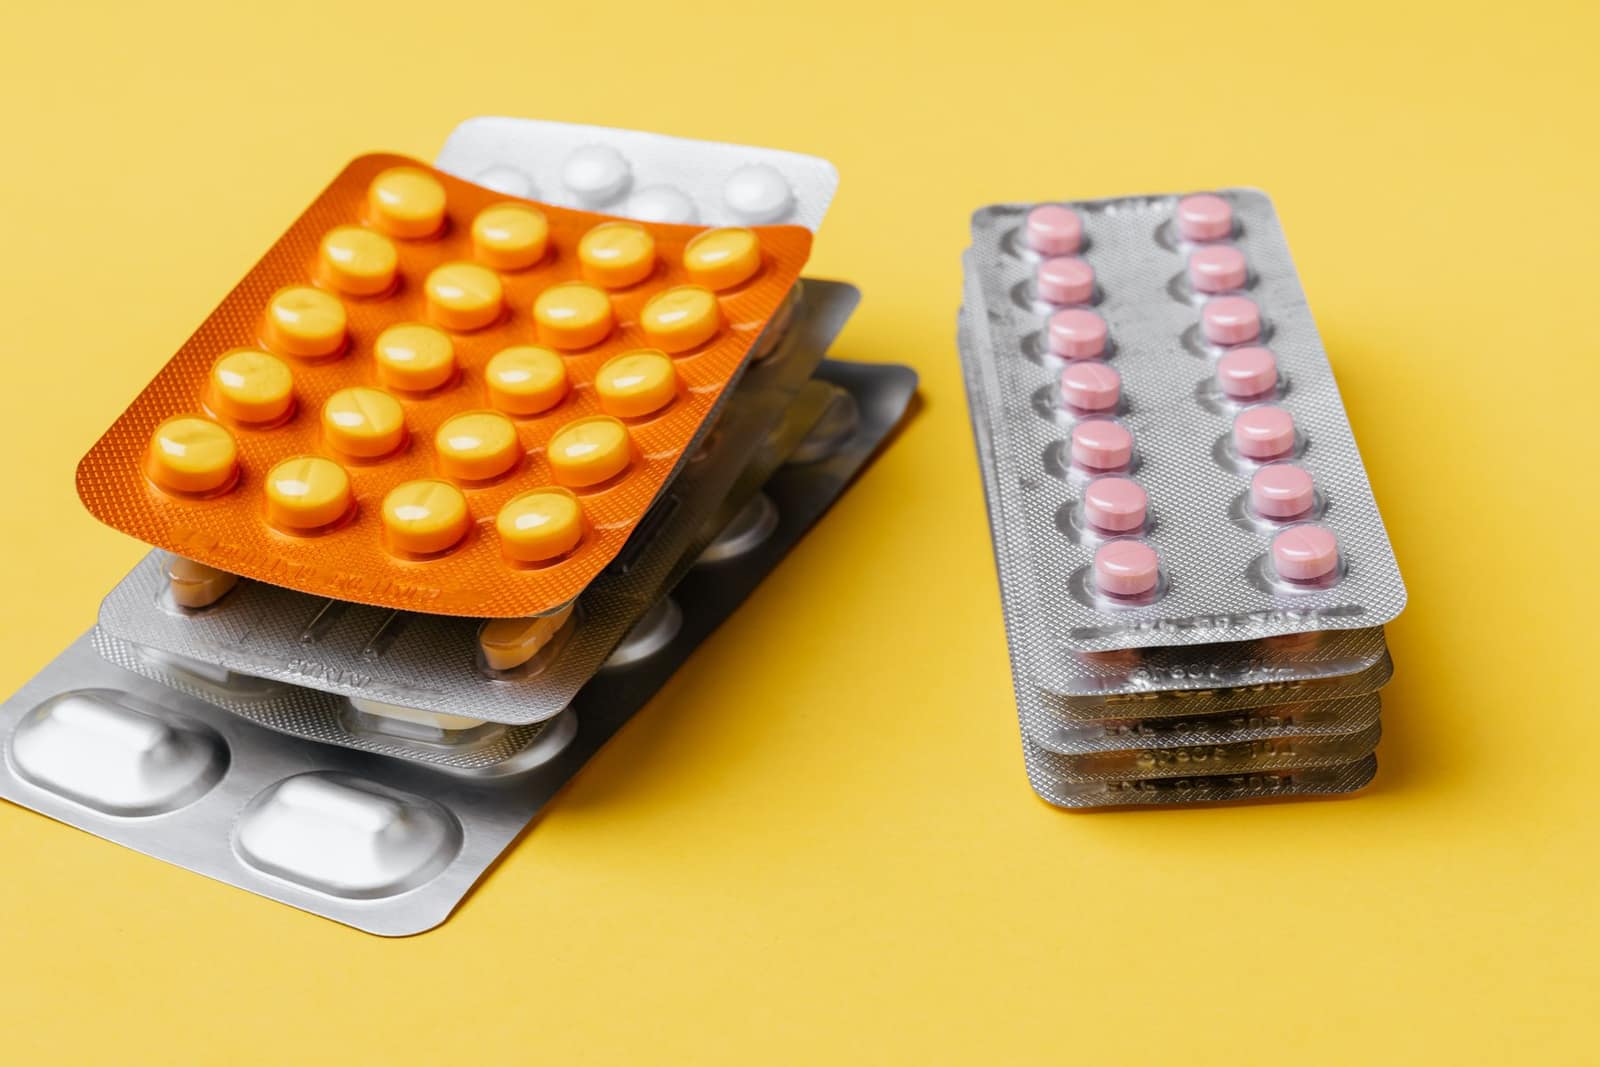 Free to exportPharma & chemicalsGeneric medicines (formulations)Tablets, capsules and injectables; every market needs product registration. The USA buys the most.HS3004Exports 2025-26US$ 21.9 bn ↓0.7%
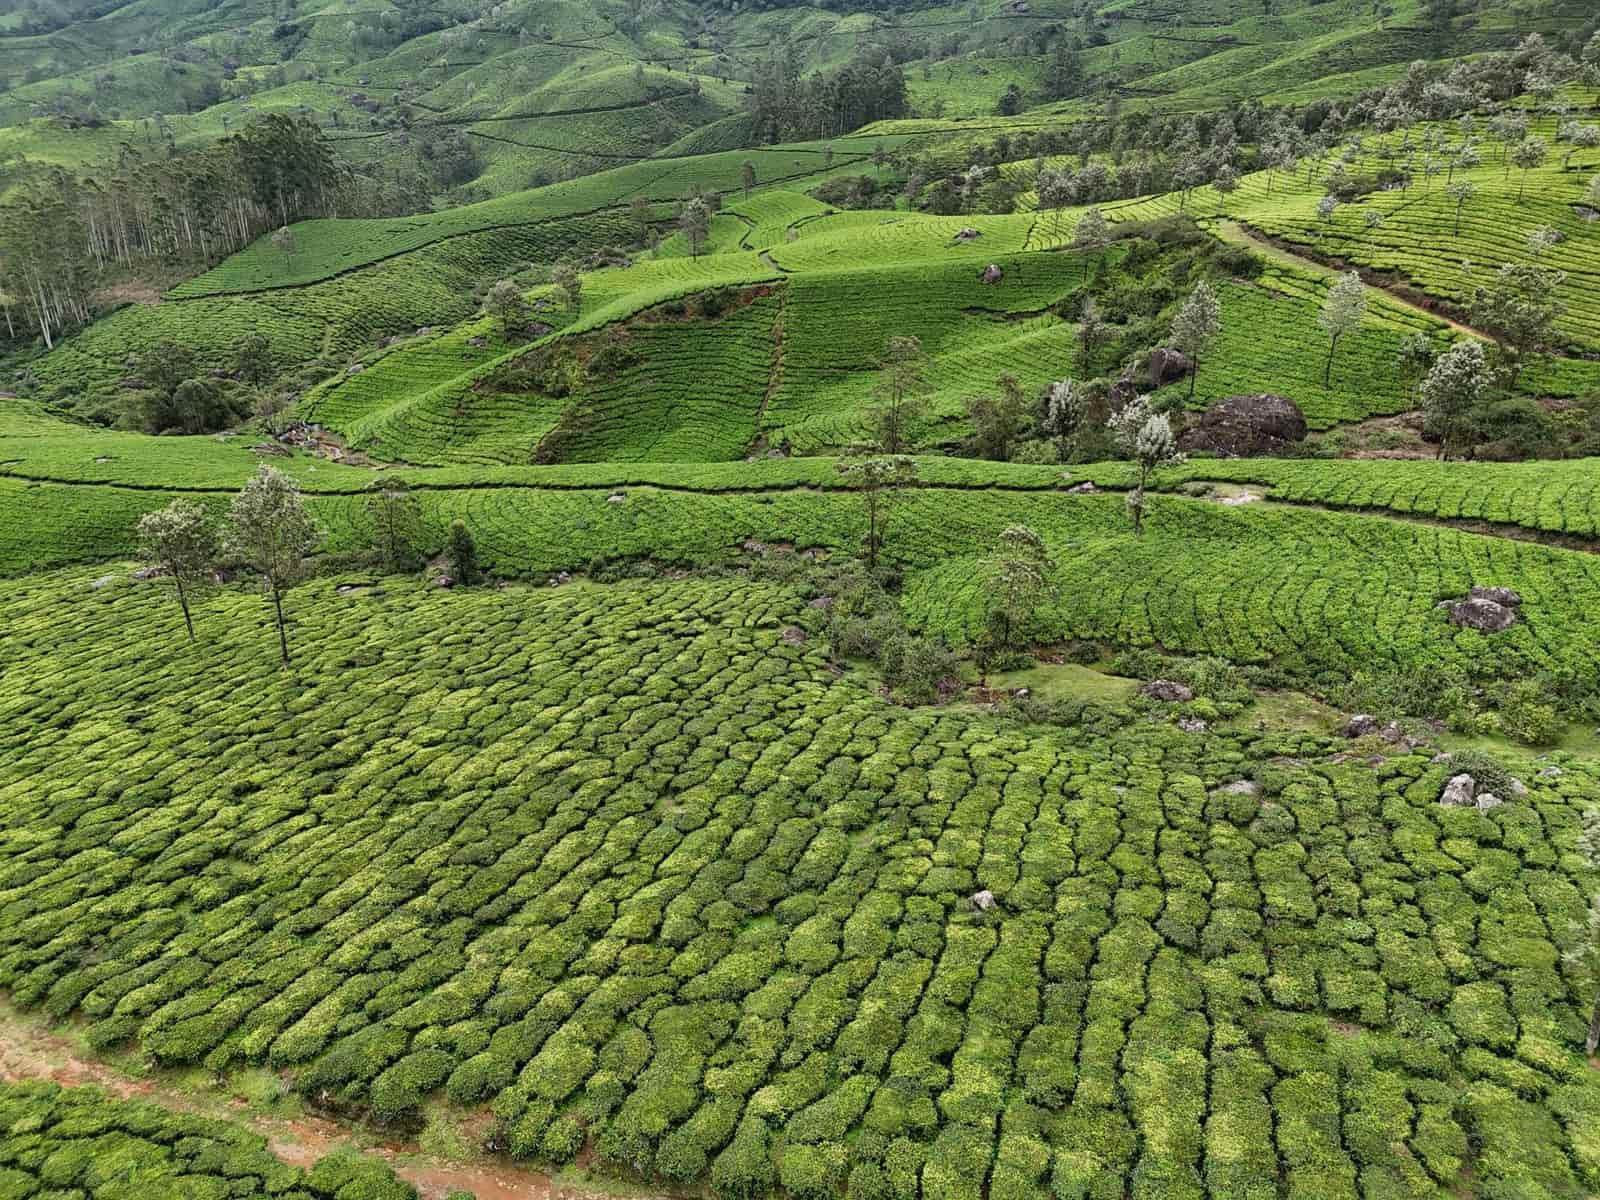 Free to exportProcessed foodTeaAssam, Darjeeling, Nilgiri and CTC tea. You need a Tea Board exporter licence; residues and GI rules matter.HS0902Exports 2025-26US$ 899 mn ↑8%
 Free to exportProcessed foodCoffeeArabica and Robusta green beans, monsooned and instant coffee. Coffee Board registration and an export permit for every shipment.HS0901.11Exports 2025-26US$ 1.41 bn ↑13%
 Free to exportFarm produceSpicesWhole, ground and blended spices. Spices Board registration (CRES) is compulsory; residue and ethylene oxide tests keep buyers.HS0904–0910Exports 2025-26US$ 3.12 bn ↓5.1%
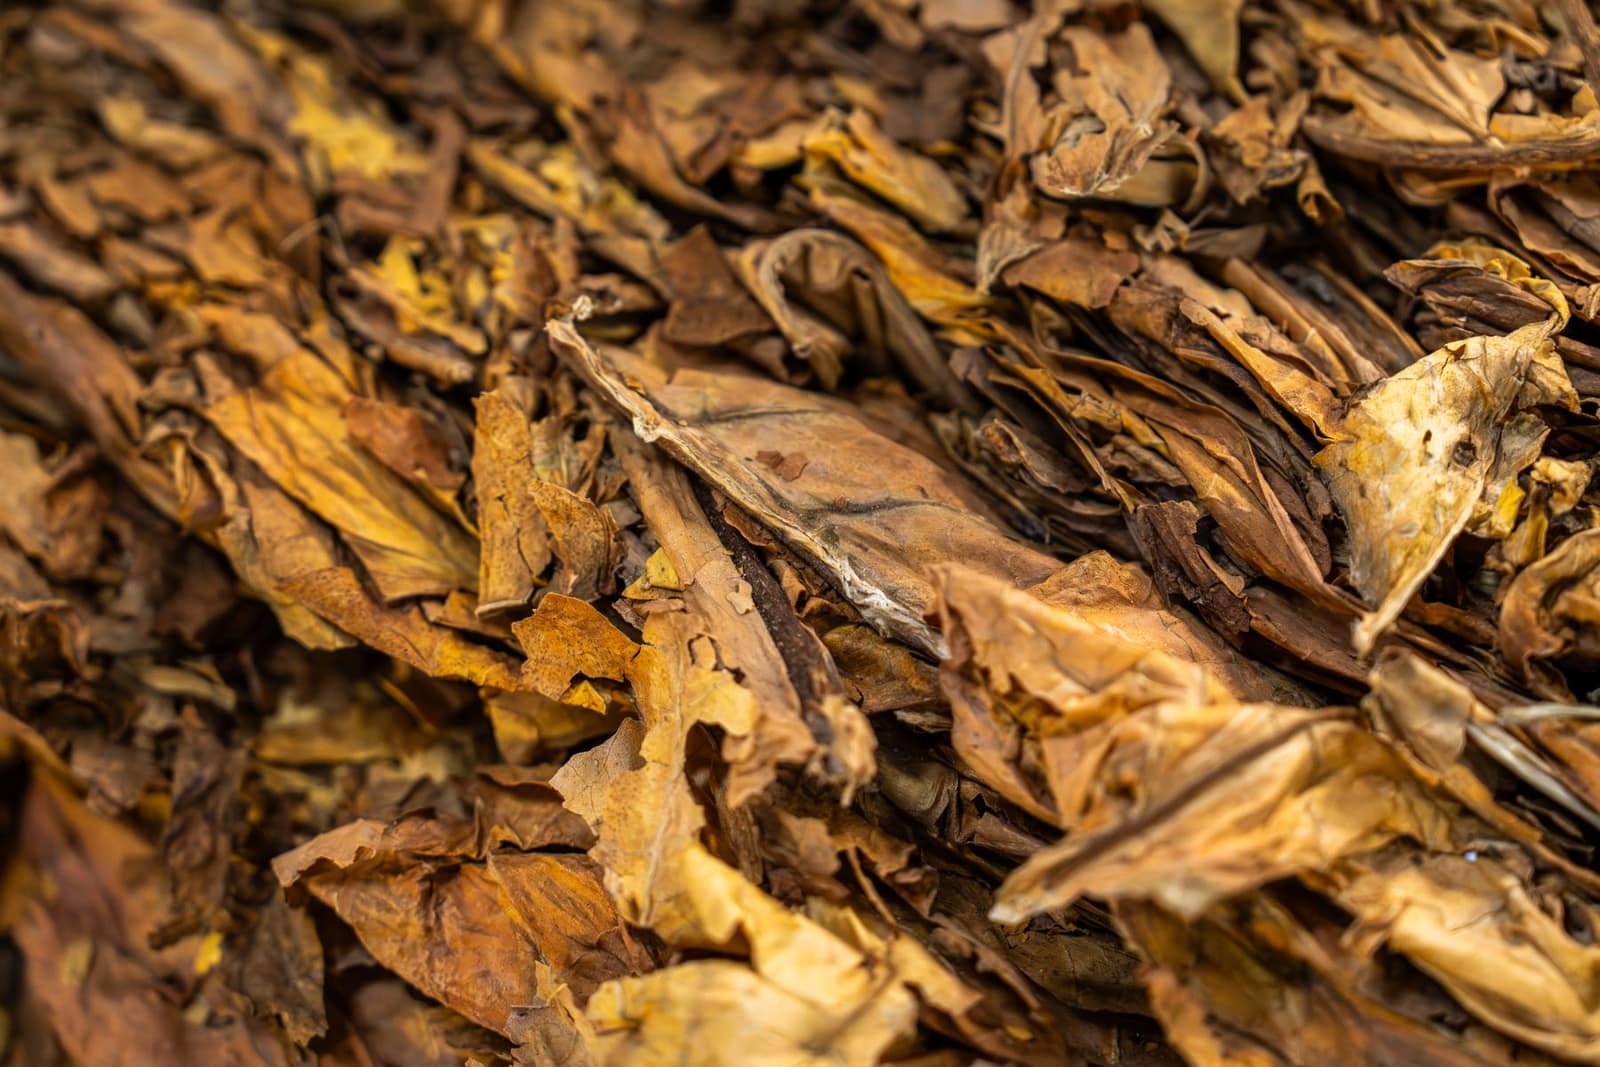 Free to exportFarm produceUnmanufactured tobaccoLeaf tobacco to Belgium, the UAE, Indonesia and Russia. Annual Tobacco Board exporter registration is compulsory.HS2401Exports 2025-26US$ 1.37 bn ↓7.5%
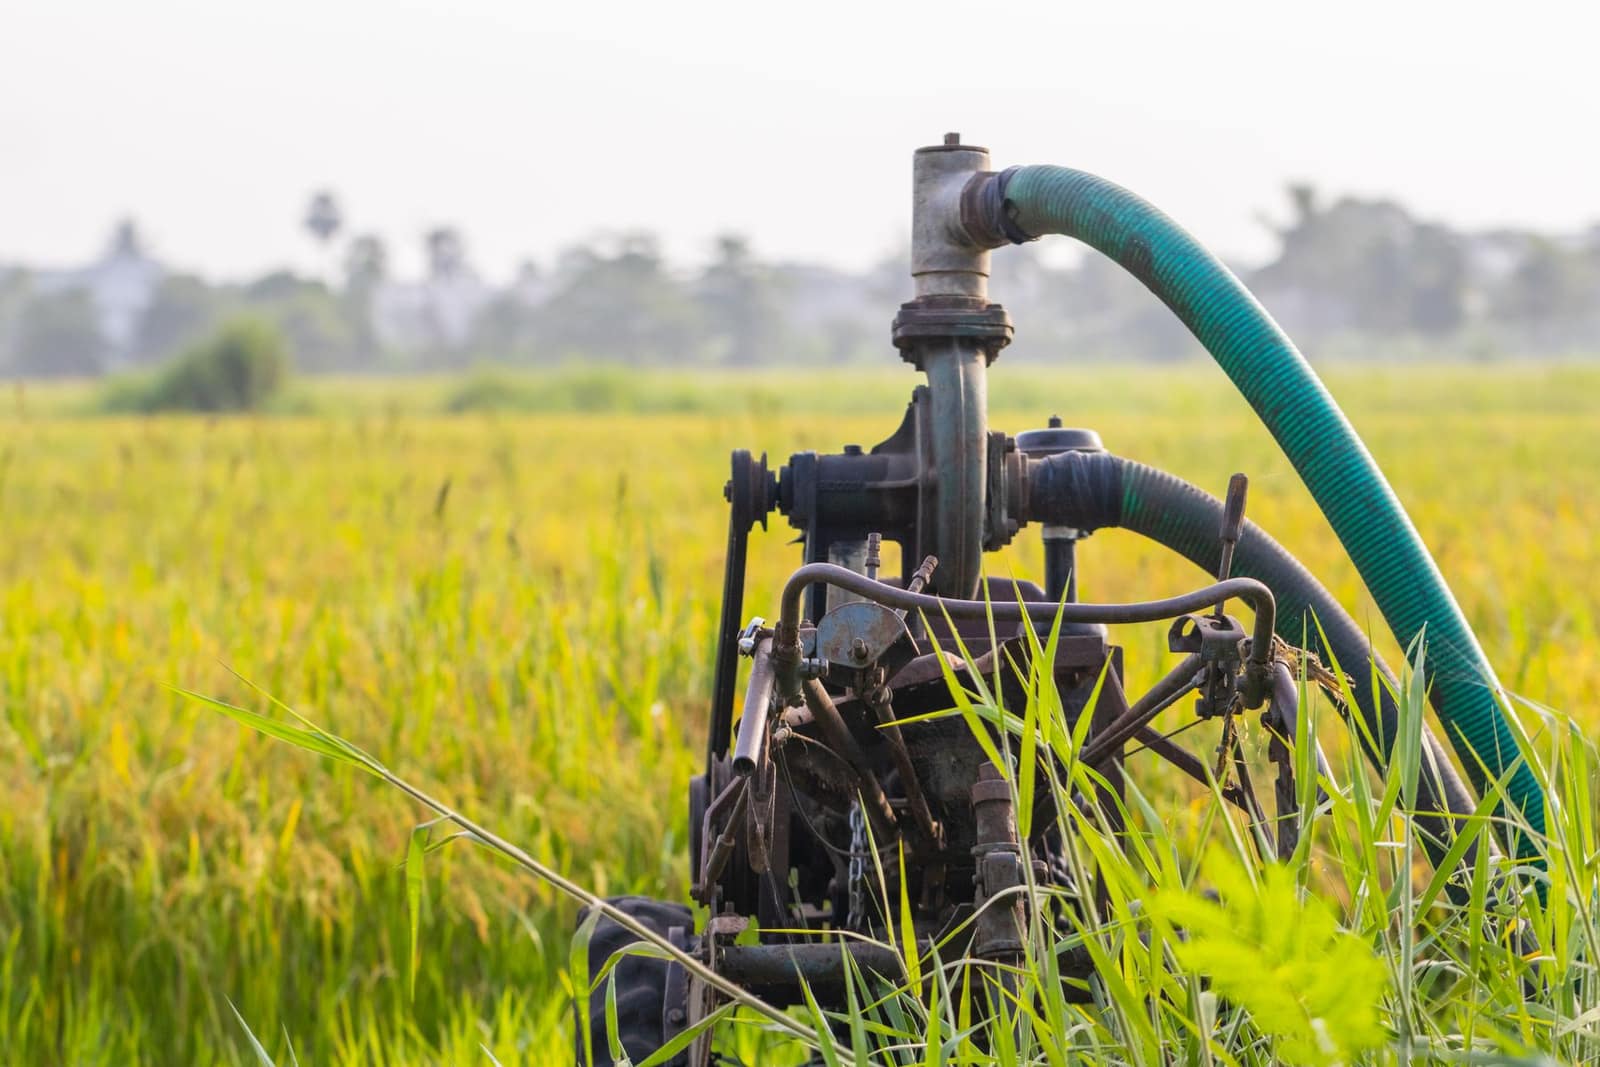 Free to exportEngineering goodsPumpsAgricultural, domestic and industrial pumps from Coimbatore, Rajkot and Ahmedabad; the USA leads.HS8413Exports 2025-26US$ 1.6 bn ↑5.2%
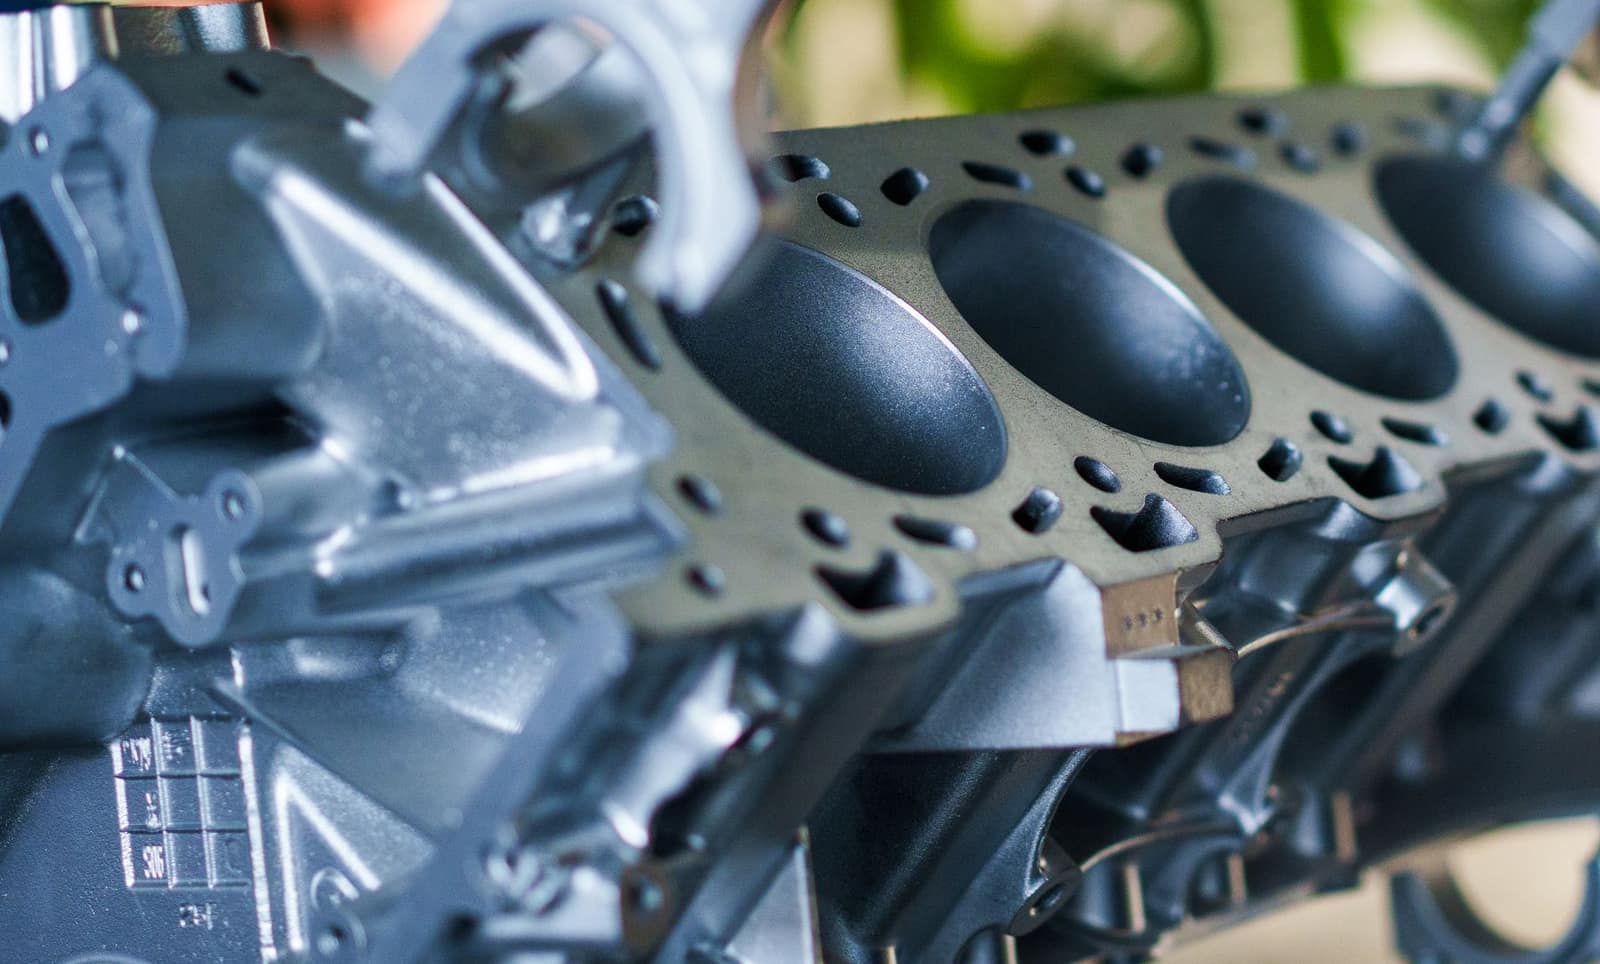 Free to exportEngineering goodsAuto parts and componentsOEM and aftermarket vehicle parts; the USA, Germany and Italy buy most, with strong demand in Latin America.HS8708Exports 2025-26US$ 7.64 bn ↑1.8%
More in Europe
 CETAGBPLondonUnited KingdomNew CETA in force since July 2026 — most Indian goods now enter duty-free. Strong market for garments, food and engineering.From India 2025-26US$ 13.4 bn
 EURAmsterdamNetherlandsEurope's main gateway: Rotterdam handles goods for the whole EU. EU food-safety and residue rules apply.From India 2025-26US$ 17.5 bn
 EURBerlinGermanyEurope's largest economy and India's biggest EU partner. Values quality, certificates and supply-chain transparency.From India 2025-26US$ 11.5 bn
 EURParisFranceFashion, food and design market. EU rules plus French-language labels; SIAL Paris is a key food fair.From India 2025-26US$ 7.1 bn