

South Asia
Export to Uzbekistan
Fast-reforming Central Asian market. Buys Indian medicines, machinery, vehicles parts and food; strict pharma quality checks.
- Capital
- Tashkent
- Currency
- UZS
- Trade agreement with India
- None
- Main ports
- Bandar Abbas (Iran), then rail via Turkmenistan, Chabahar (Iran), then road or rail, Tashkent International Airport
Uzbekistan has no trade agreement with India. It is double-landlocked, so Indian goods usually travel by sea to Iran and then by rail or road through Turkmenistan, or by sea to China and then by rail. Medicines are India's most important export there, and quality checks on imported medicines were tightened after 2022.
What it buys from India
- Medicines and pharmaceutical products
- Machinery, electrical equipment and vehicle parts
- Tea, rice, spices and processed food
- Chemicals and plastics
Import rules on their side
- Medicines and medical devices need state registration and quality testing in Uzbekistan before sale.
- Many goods need conformity certification by Uzbekistan's technical regulation agency; labels should be in Uzbek (Russian is commonly added).
- Customs is run by the Customs Committee of Uzbekistan; plant products need an Indian phytosanitary certificate.
Practical tips
- Cough syrup exports from India must be tested at a listed government laboratory and carry a certificate of analysis before export (DGFT rule since June 2023). Keep full batch records for every medicine.
- Russian is widely used in business; Russian or Uzbek documents help.
- If the route passes through Iran, check with your bank and insurer about sanctions-related restrictions before you commit.
Trade data
India’s exports to Uzbekistan in numbers
From the Department of Commerce’s TradeStat (Indian financial years, April–March), the country’s imports from the world from UN Comtrade, and its basics from the World Bank.
- India’s exports here, 2025-26
- US$ 658 mn No. 71 of our 80 countries
- Change from 2024-25
- ↑ +27.1% US$ 518 mn → US$ 658 mn
- Share of all Indian exports
- 0.15%
- Its imports from the world
- —
What India sells here most
By HS chapter, 2025-26. Change is against 2024-25.
What is rising and what is falling
Chapters where India sells at least US$ 5 million. Change from 2024-25 to 2025-26.
↑ High demand
- MeatUS$ 97.2 mn → US$ 307 mn↑+215.7%
- Instruments, medical devicesUS$ 5.3 mn → US$ 11.2 mn↑+111.8%
- Other food preparationsUS$ 3.1 mn → US$ 5.2 mn↑+67.5%
- Organic chemicalsUS$ 4.3 mn → US$ 6.6 mn↑+55.2%
- Fruit and nutsUS$ 55.3 mn → US$ 84.7 mn↑+53.4%
- TobaccoUS$ 7.3 mn → US$ 10.3 mn↑+41.6%
↓ Low demand
- Vehicles and partsUS$ 81.5 mn → US$ 8.8 mn↓-89.2%
- Electrical and electronicsUS$ 34.9 mn → US$ 5.8 mn↓-83.3%
- Coffee, tea, spicesUS$ 10.3 mn → US$ 7.4 mn↓-28.5%
- MachineryUS$ 46.3 mn → US$ 38.6 mn↓-16.6%
Our product guides that sell here
India’s exports of each product to this country, 2025-26.
The 20 biggest export lines
4-digit HS lines, 2025-26, with their Harmonized System descriptions.
What India buys from Uzbekistan
India’s imports from this country in 2025-26 by HS chapter, from TradeStat — this country can be your supplier too.
- India’s imports, 2025-26
- US$ 14.6 mn US$ 14.7 mn → US$ 14.6 mn
- India’s exports, 2025-26
- US$ 658 mn
- Trade balance
- +US$ 643 mn exports minus imports
- Change in imports
- -0.3%
The country at a glance
- Population
- 37.1 mn 2025
- GDP
- US$ 147 bn 2025
- GDP per person
- US$ 3,968 2025
- Imports (goods and services)
- US$ 52 bn 2025
Sources: TradeStat — Export Import Data Bank, Department of Commerce · World Bank — World Development Indicators · Figures taken 29 October 2026.
What to send to Uzbekistan
All products →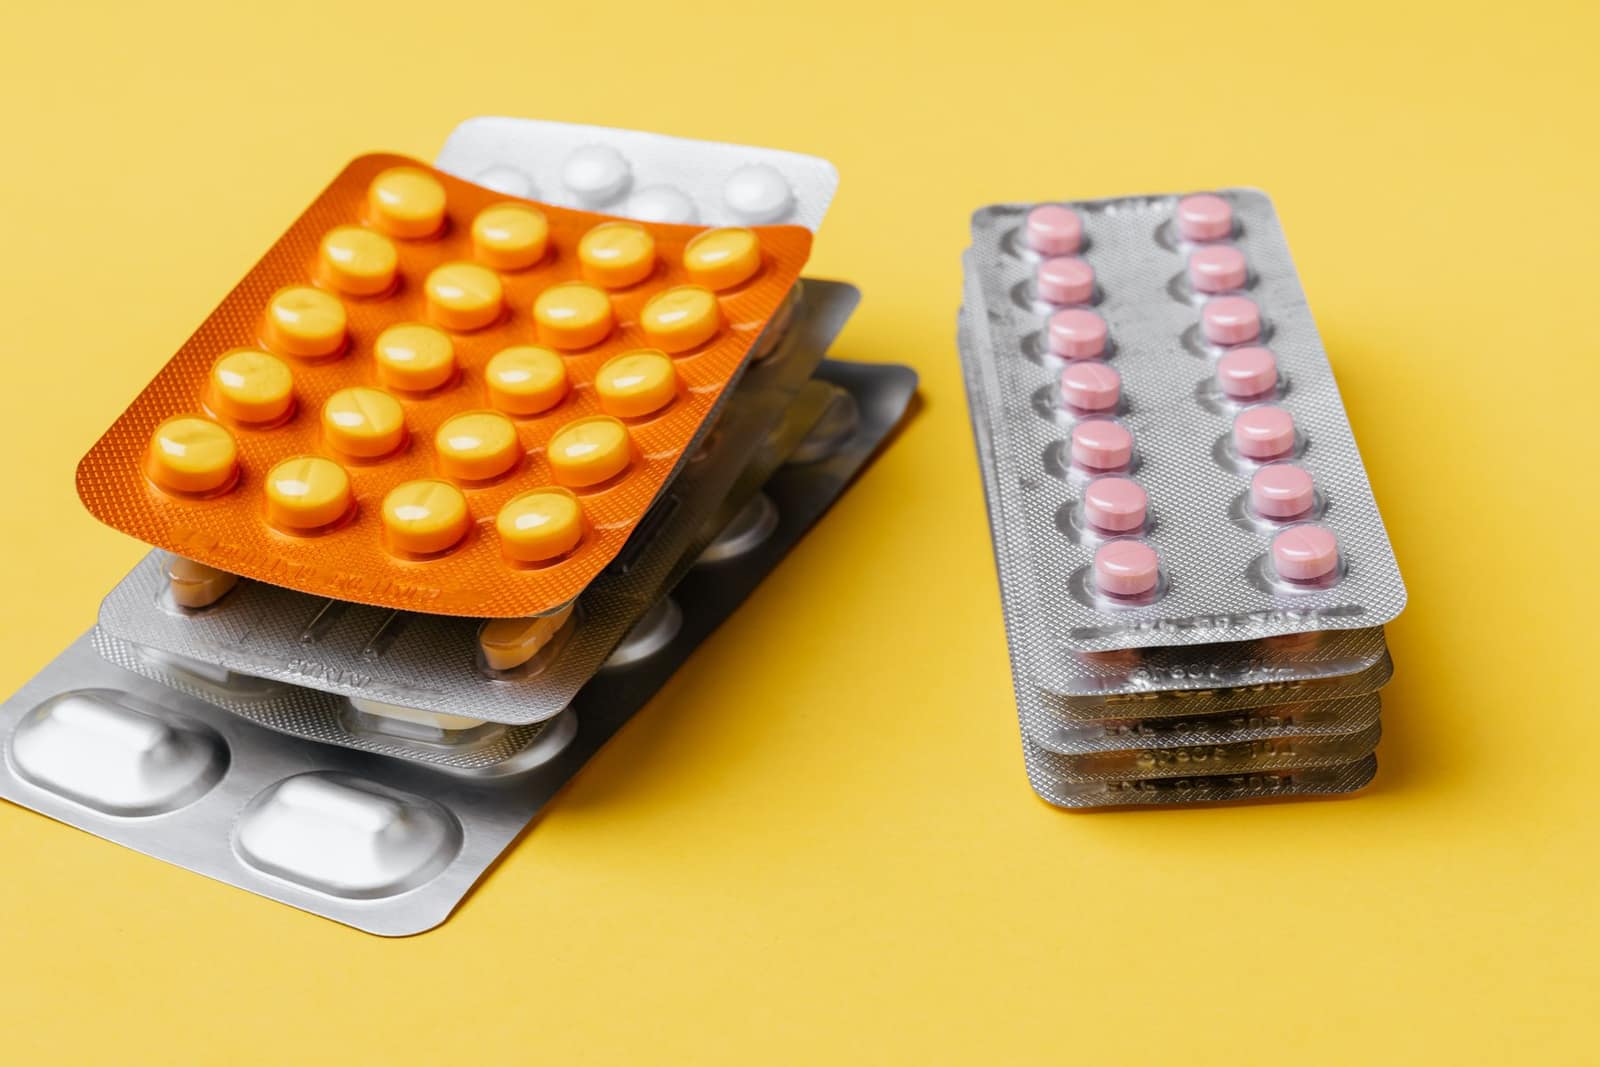 Free to exportPharma & chemicalsGeneric medicines (formulations)Tablets, capsules and injectables; every market needs product registration. The USA buys the most.HS3004Exports 2025-26US$ 21.9 bn ↓0.7%
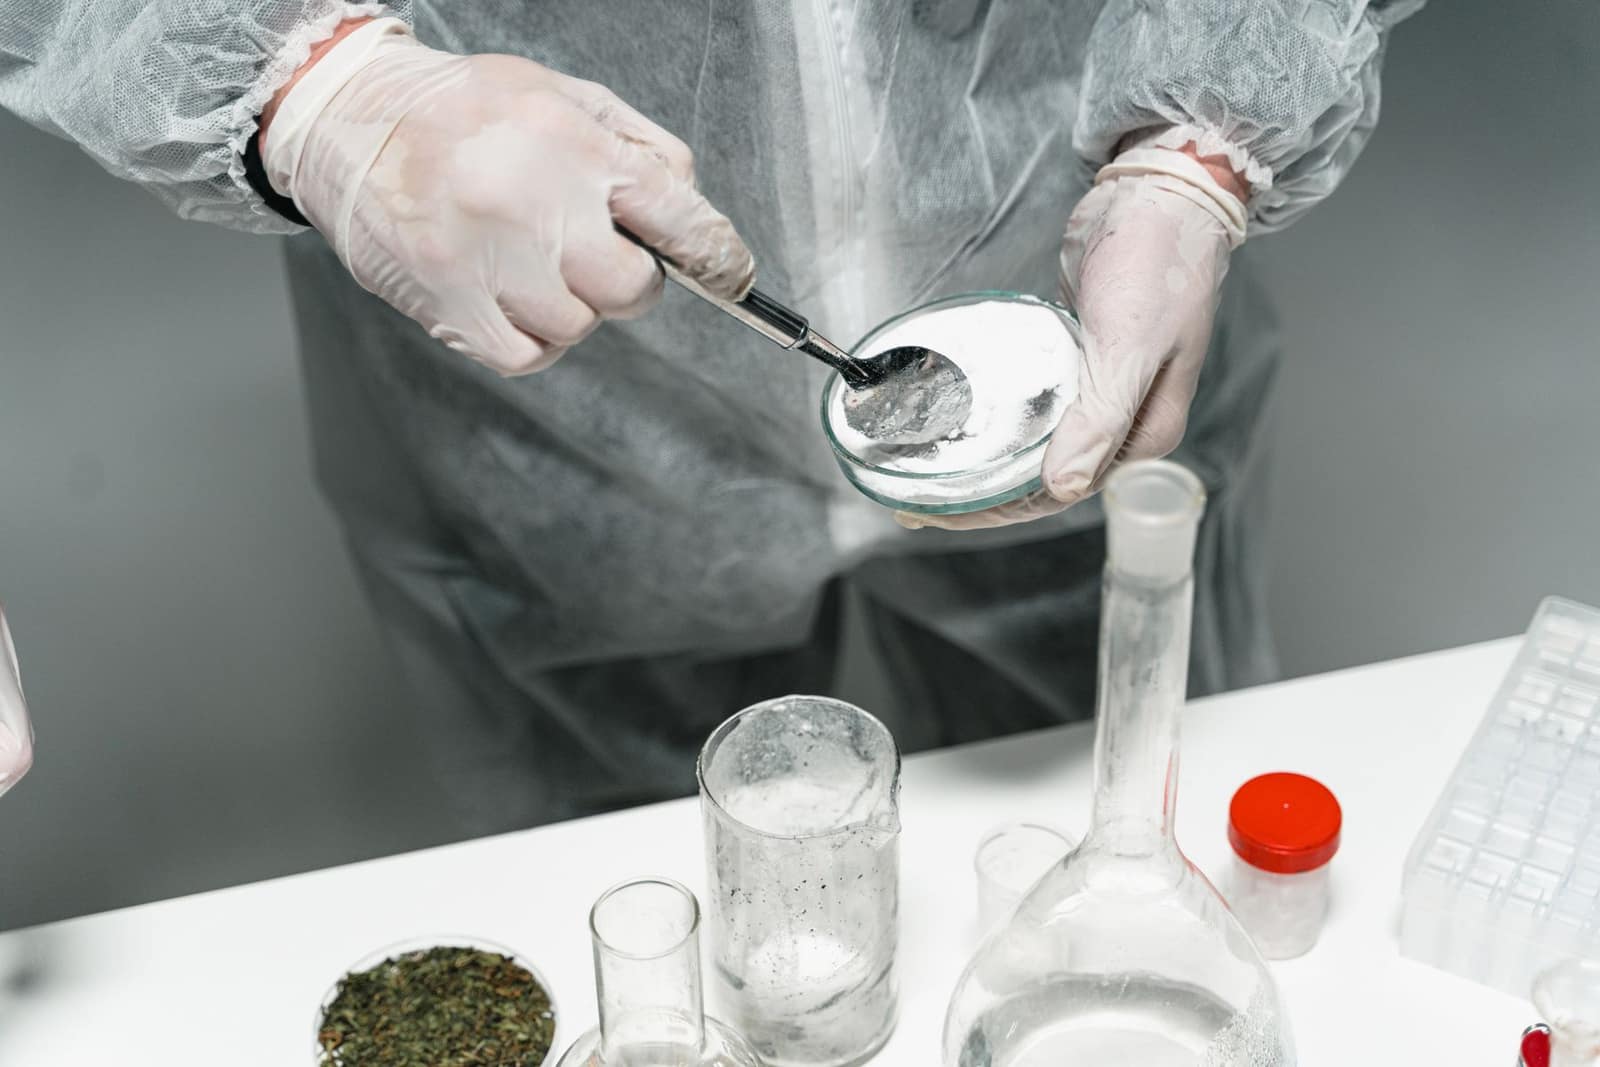 Free to exportPharma & chemicalsBulk drugs (APIs)APIs and intermediates from Hyderabad, Visakhapatnam and Gujarat; regulated buyers need DMFs and GMP inspections.HS2933Exports 2025-26US$ 7.78 bn ↓0.6%
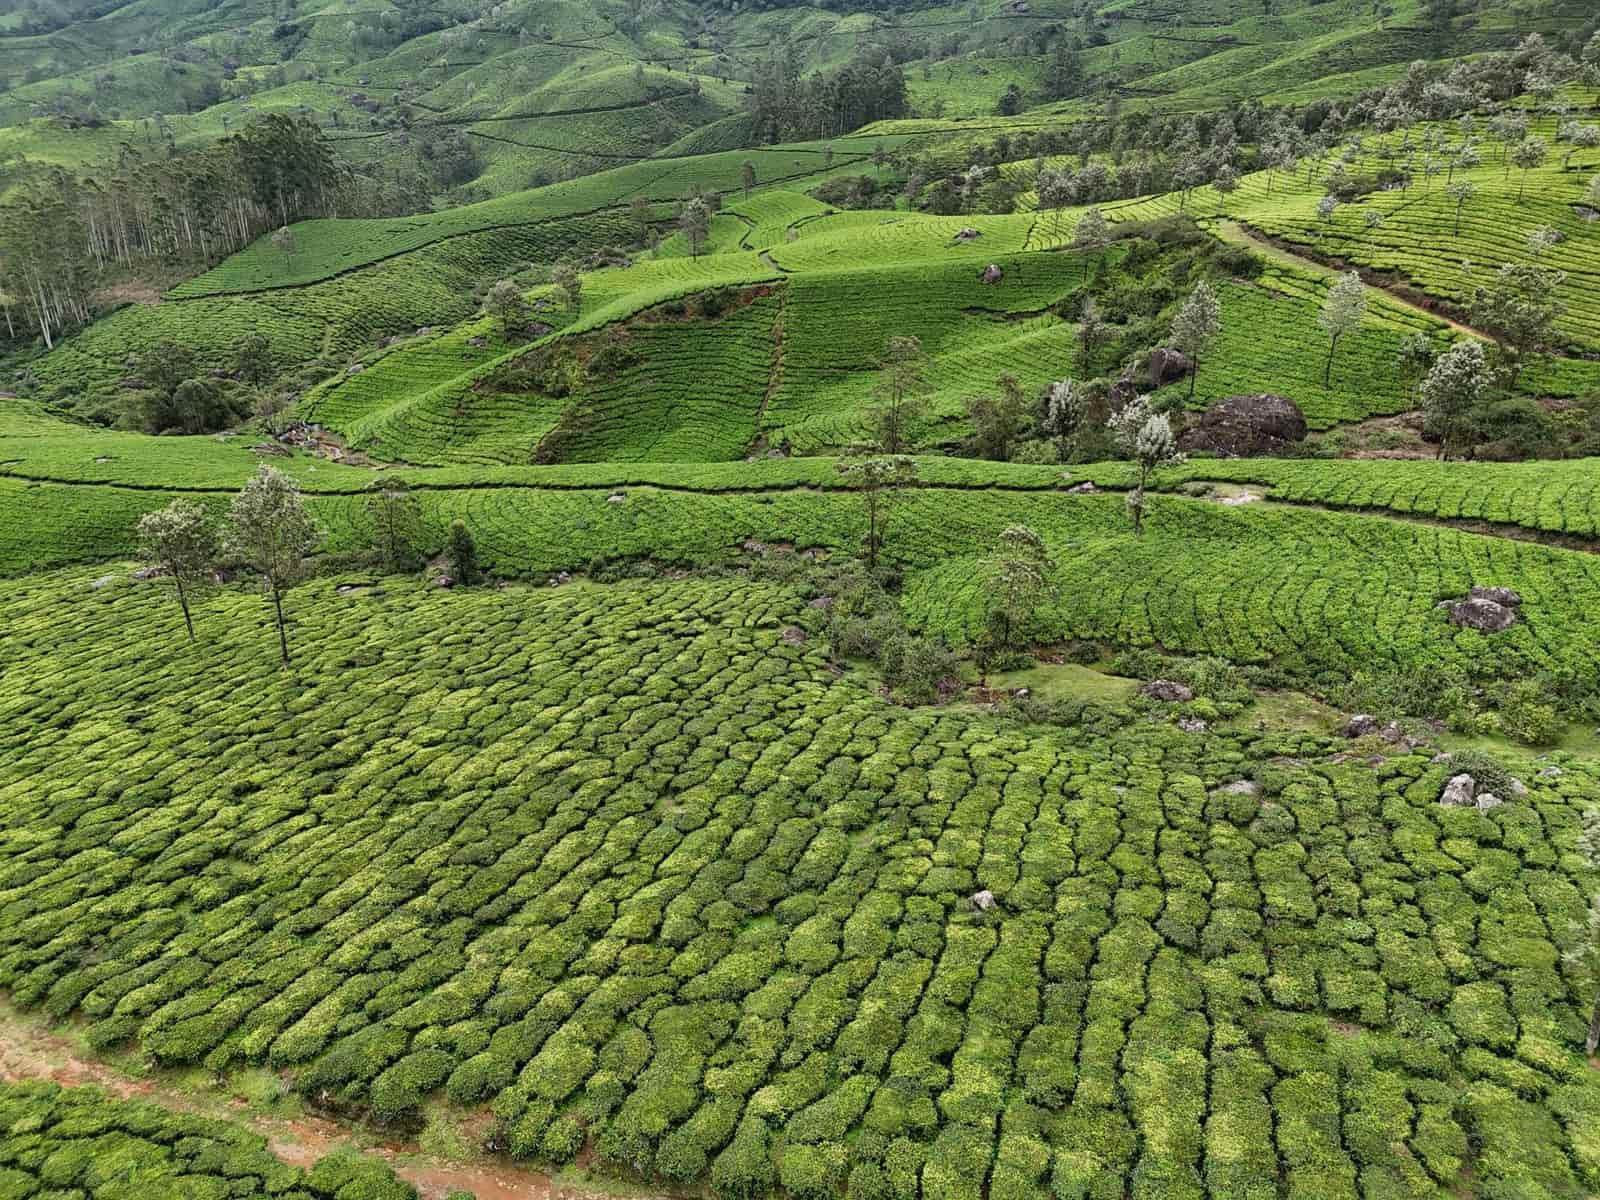 Free to exportProcessed foodTeaAssam, Darjeeling, Nilgiri and CTC tea. You need a Tea Board exporter licence; residues and GI rules matter.HS0902Exports 2025-26US$ 899 mn ↑8%
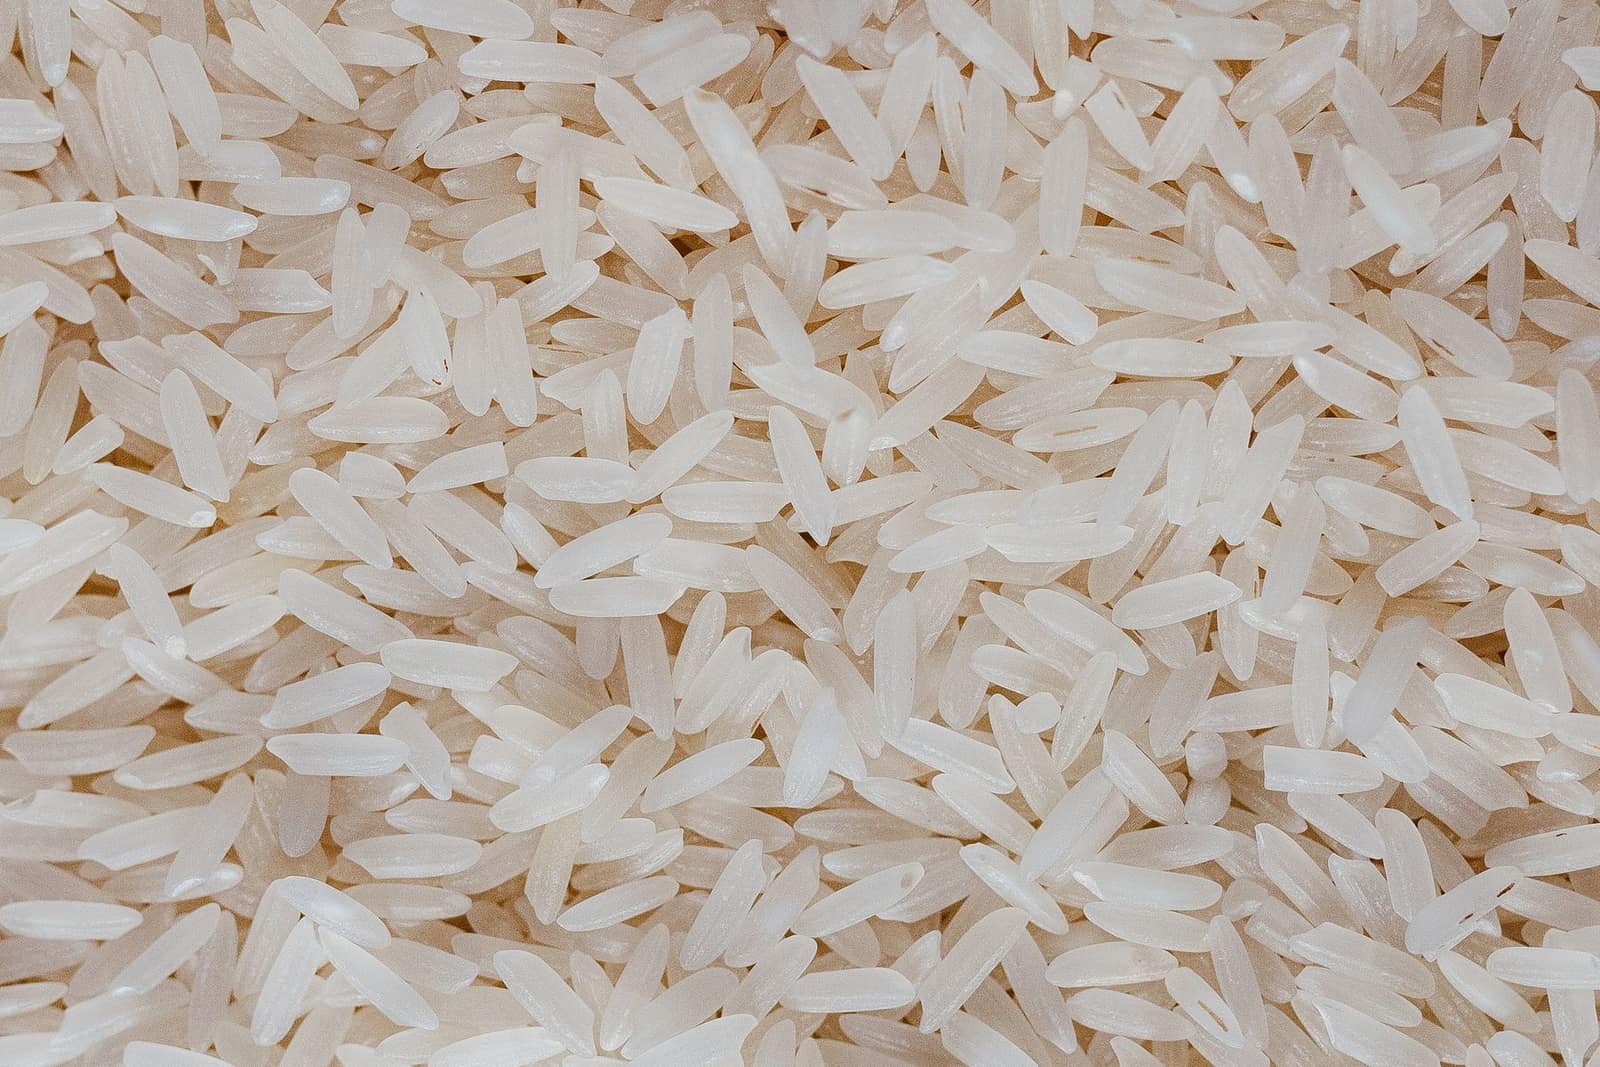 Free, with conditionsFarm produceBasmati riceIndia’s top agri export by value. Free to export, but every contract must be registered with APEDA first.HS1006.30Exports 2025-26US$ 5.67 bn ↓4.6%
 Free to exportFarm produceSpicesWhole, ground and blended spices. Spices Board registration (CRES) is compulsory; residue and ethylene oxide tests keep buyers.HS0904–0910Exports 2025-26US$ 3.12 bn ↓5.1%
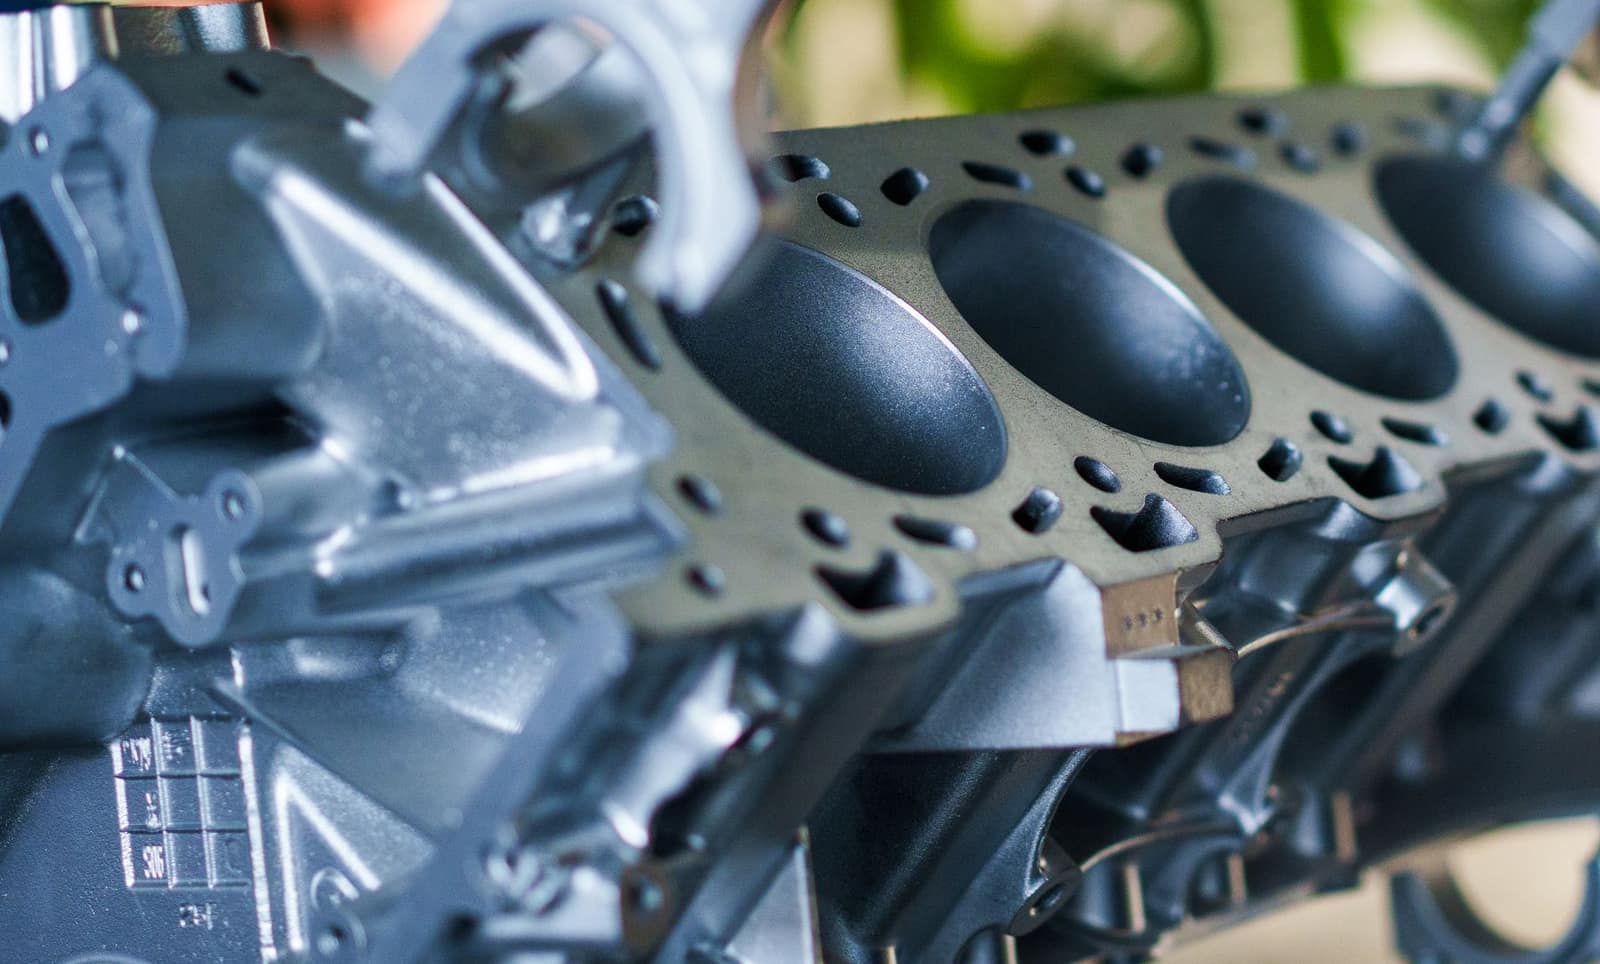 Free to exportEngineering goodsAuto parts and componentsOEM and aftermarket vehicle parts; the USA, Germany and Italy buy most, with strong demand in Latin America.HS8708Exports 2025-26US$ 7.64 bn ↑1.8%
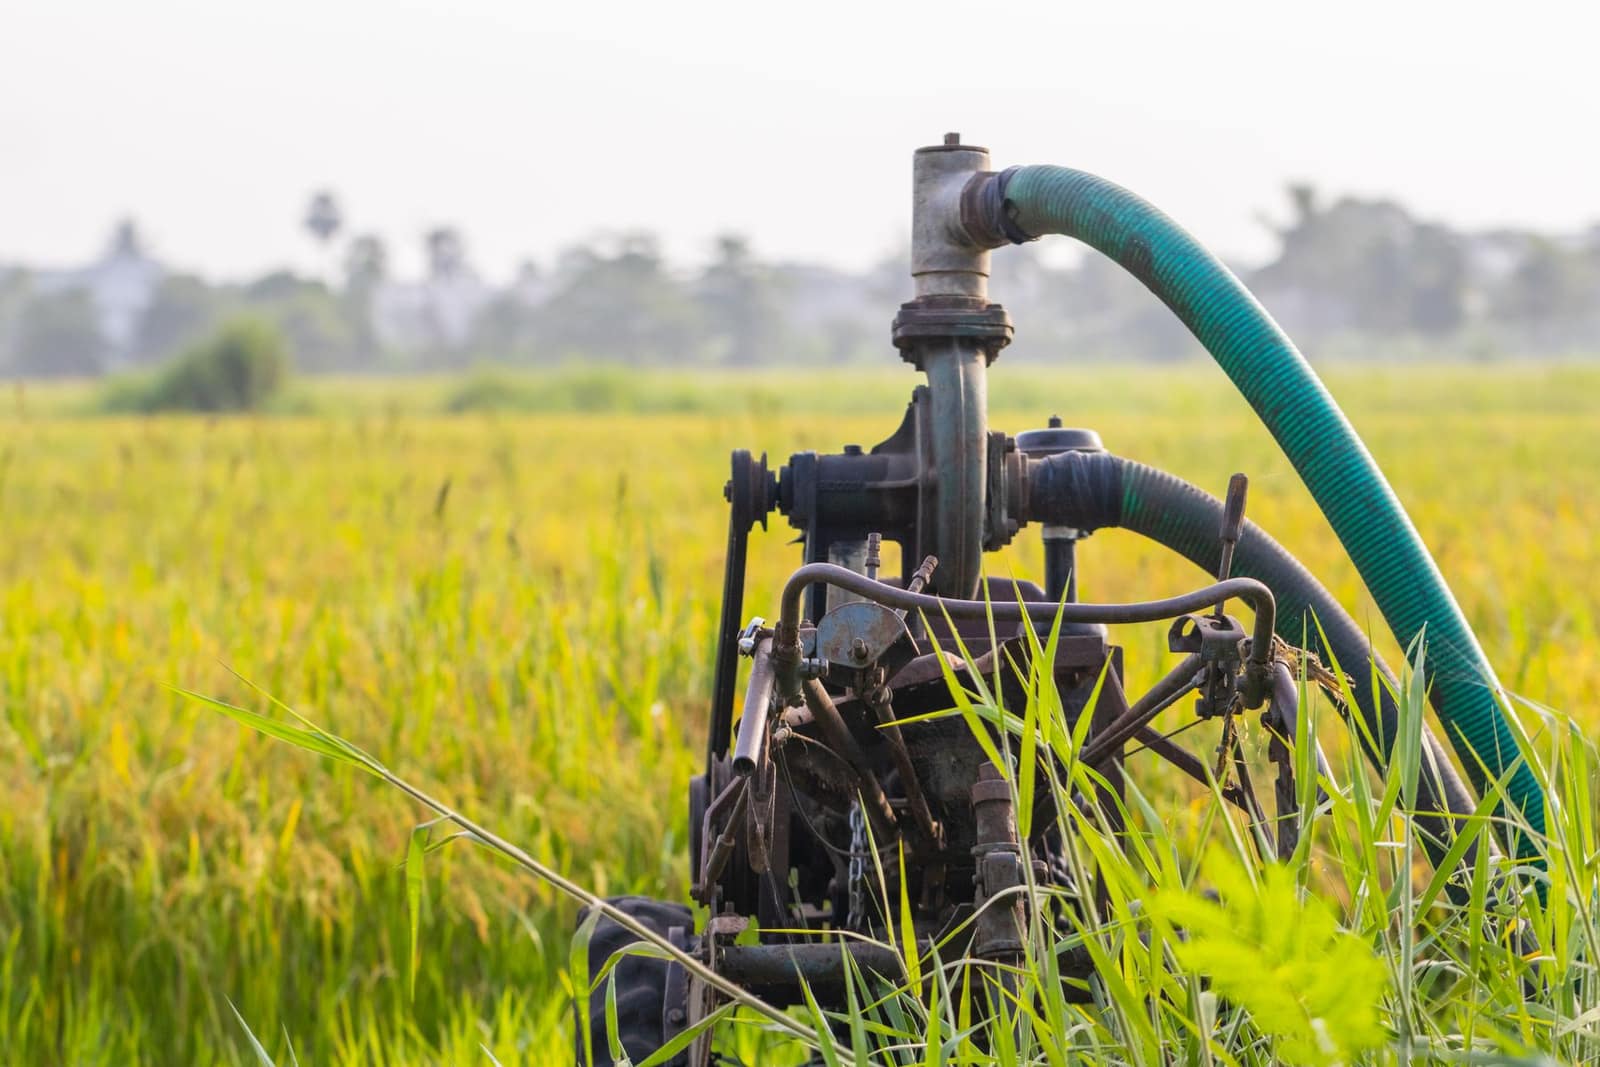 Free to exportEngineering goodsPumpsAgricultural, domestic and industrial pumps from Coimbatore, Rajkot and Ahmedabad; the USA leads.HS8413Exports 2025-26US$ 1.6 bn ↑5.2%
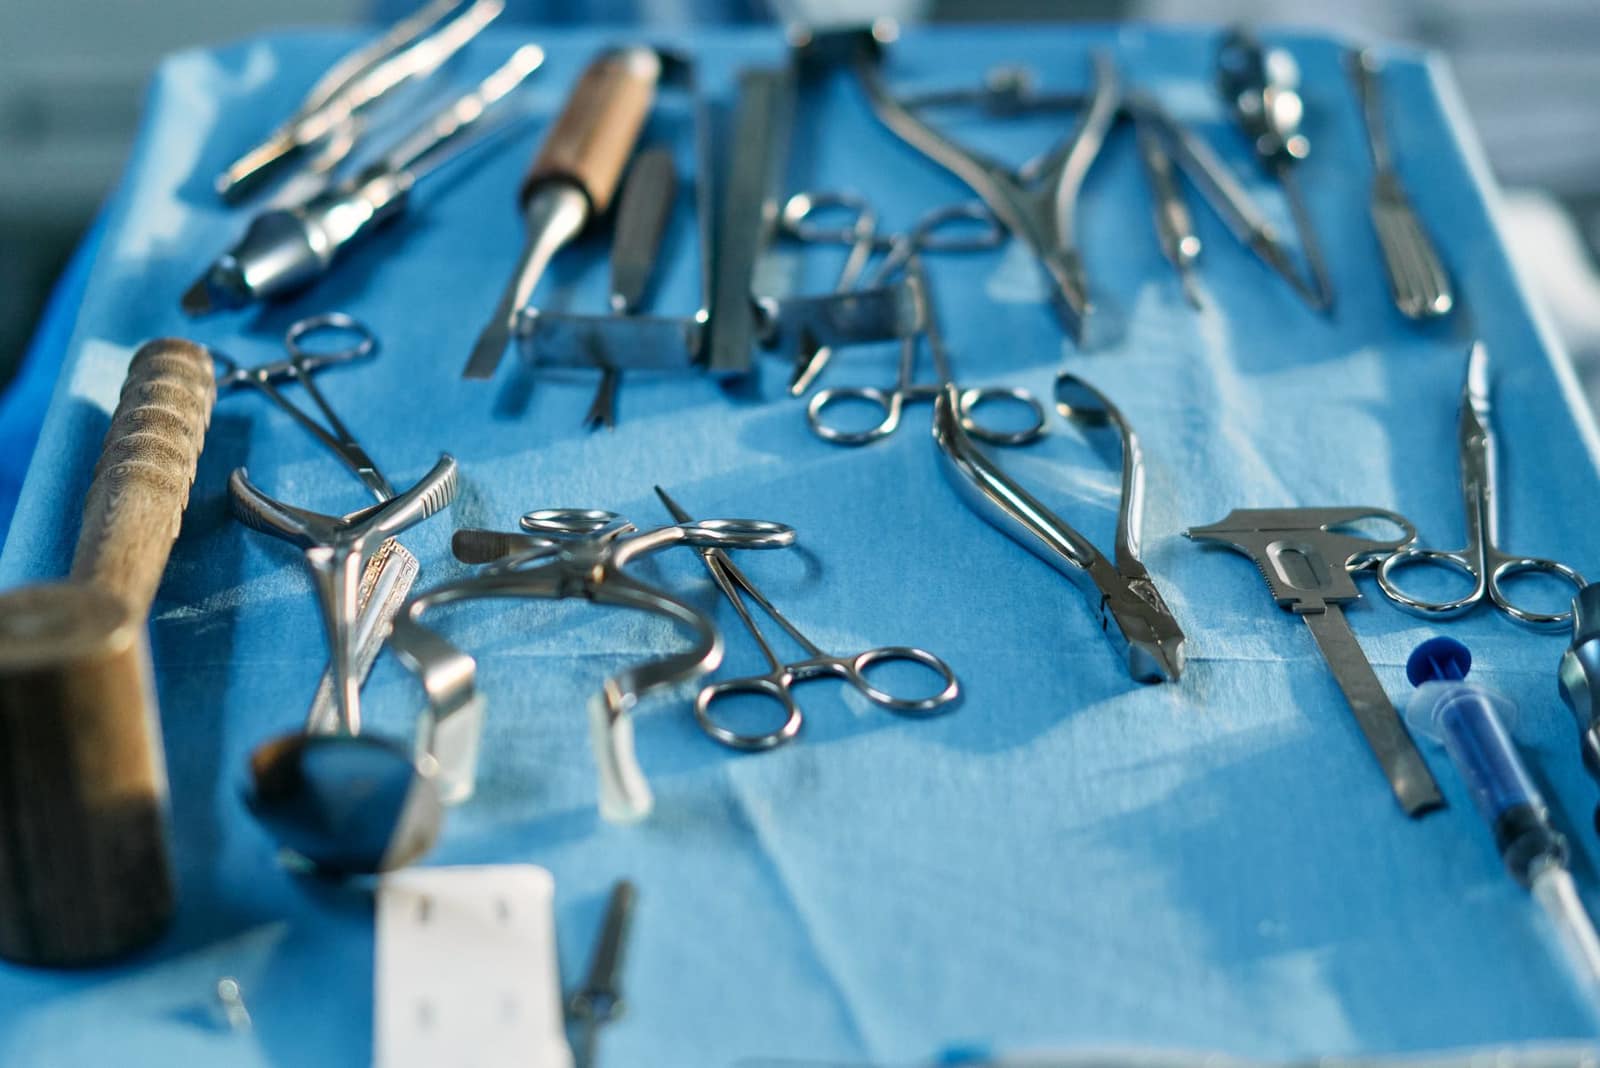 Free to exportEngineering goodsMedical and surgical instrumentsSyringes, catheters, surgical and dental instruments; every market needs device registration. The USA leads.HS9018Exports 2025-26US$ 1.5 bn ↑4.1%
More in South Asia
 SAFTABDTDhakaBangladeshBig neighbour market for cotton, yarn, food and machinery. Mostly LC-based; land and sea routes.From India 2025-26US$ 10.6 bn
 SAFTANPRKathmanduNepalOpen land border, rupee payments and a market that relies on Indian goods — an easy first market by road.From India 2025-26US$ 7.45 bn
 ISFTALKRSri Jayawardenepura Kotte (Colombo is the commercial capital)Sri LankaClose island market with India's oldest FTA. Buys food, medicines, vehicles, yarn and building materials.From India 2025-26US$ 5.52 bn
 SAFTABTNThimphuBhutanDuty-free, rupee-based neighbour market reached by road from West Bengal and Assam.From India 2025-26US$ 1.25 bn