

Food and farm goods
Import pulses (dals)
Duty and policy differ by pulse: tur and urad are free and duty-free to Mar 2027; yellow peas pay 10% plus 20% AIDC.
- Basic customs duty
- 0–5% Nil (tur whole, urad, moong and other pulses not listed below); 5% lentils (masoor); 10% yellow peas, other peas, chickpeas, kabuli and desi chana, and tur other than whole
- Social welfare surcharge
- 10% of the duty, unless exempted — check on ICEGATE
- IGST
- 0–5% Nil (loose); 5% if pre-packed and labelled
- India’s imports, 2025-26
- US$ 3.63 bn from 42 countries
Rates are from Table I of notification 45/2025-Customs (S. Nos. 16–23); the tariff rates are much higher (for example 50% on peas and lentils, 30% on tur). Pulse duties are changed at short notice, often with a cut-off by bill-of-lading date, so check ICEGATE on the day you contract. AIDC 20% on yellow peas (0713 10 10) under notification 46/2025-Customs, for bills of lading dated on or after 1 Nov 2025. AIDC on lentils and chickpeas has been changed often — check the effective rate on ICEGATE. CBIC — Notification 45/2025-Customs (effective duty rates), 24 Oct 2025, as amended ↗
What is imported
India imports pulses to fill gaps in domestic output. Imports under 0713 were about US$ 3.63 billion in FY 2025-26 (TradeStat). Myanmar supplies tur and urad, Australia and Canada supply lentils, chickpeas and peas, and East African countries (Mozambique, Tanzania, Malawi) supply tur.
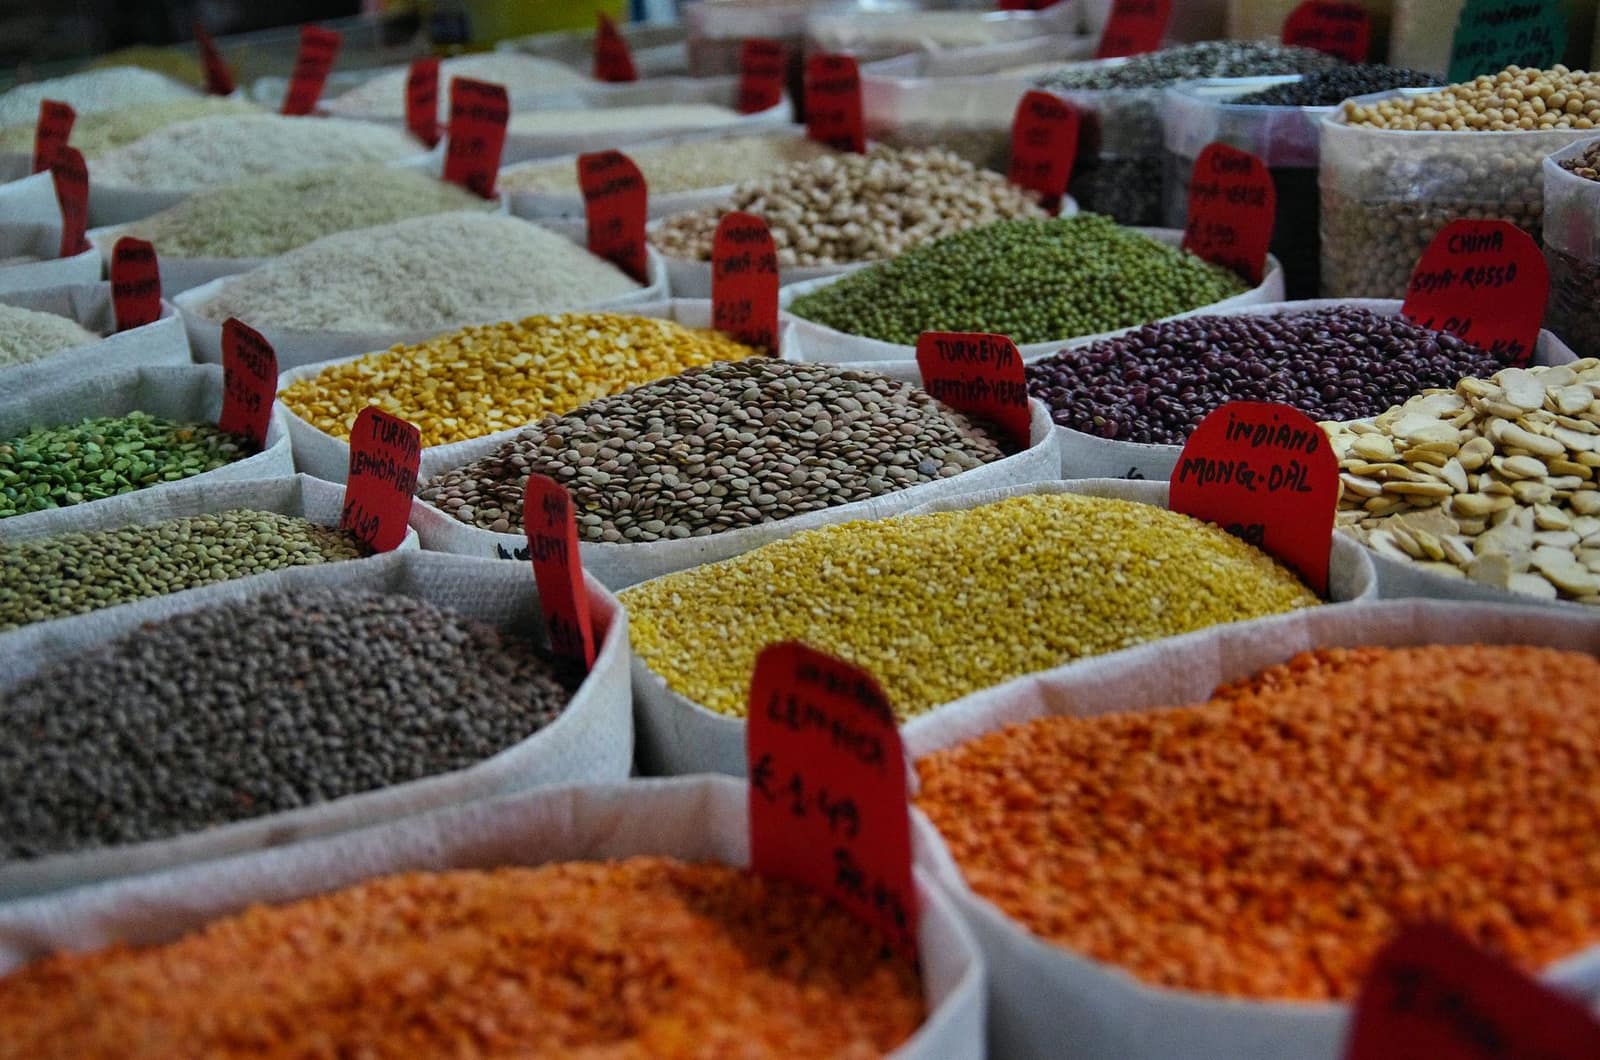
Policy is set pulse by pulse. DGFT notifications dated 31 Mar 2026 (Nos. 70, 71 and 72/2025-26) keep yellow peas, urad and tur “Free” up to 31 Mar 2027; yellow peas also need registration on the DGFT Import Monitoring System. Other peas and some beans have been “Restricted” at times. Confirm the current status of your 8-digit code on the DGFT ITC(HS) page.
Licences and registrations you need
- FSSAICentral licence for food importers (FoSCoS), then a No Objection Certificate for each consignment through FICS at the port.fics.fssai.gov.in ↗
- Plant Quarantine (PPQS)Import permit where the Plant Quarantine Order, 2003 requires one, plus inspection and release at the port. Apply on PQMS before shipment.pqms.cgg.gov.in ↗
- DGFTRegistration on the Import Monitoring System for yellow peas; check whether your pulse needs any other DGFT condition.dgft.gov.in ↗
What is checked at the port
- Plant quarantine: import permit, phytosanitary certificate and fumigation as required by the Plant Quarantine Order, 2003.
- FSSAI checks for pesticide residues, insect damage and foreign matter.
- Customs checks the bill-of-lading date against the duty or policy cut-off date.
Practical tips
- Write the bill-of-lading date limit into your contract when a policy window or duty change is near.
- Check the methyl bromide fumigation rule for your origin with Plant Quarantine before shipping.
Where new importers go wrong
- Shipping after the policy window closes; cargo arriving after a “Free” period ends can be refused.
- Assuming all pulses carry the same duty — yellow peas, lentils and tur are treated very differently.
Sources (8)
- CBIC — Notification 45/2025-Customs (effective duty rates), 24 Oct 2025, as amended
- Notification 11/2021-Customs — effective rates of Agriculture Infrastructure and Development Cess (as first issued)
- CBIC — Customs Tariff of India (as on 30.06.2025)
- DGFT — ITC(HS) import policy (Schedule 1)
- Plant Quarantine Management System (PQMS)
- FSSAI — Food Import Clearance System (FICS)
- Commerce Ministry TradeStat — commodity-wise imports by country (FY 2025-26)
- ICEGATE — Customs duty and tariff look-up
Import data
Where India buys pulses (dals)
India’s imports from the Department of Commerce’s TradeStat, country by country. US$, financial years.
- Imports, 2025-26
- US$ 3.63 bn
- Change from 2024-25
- ↓-34.5%
- Supplying countries
- 42
- Biggest supplier
- Myanmar 26%
Biggest supplying countries
Which sources are growing and shrinking
↑ Growing sources
- BrazilUS$ 170 mn → US$ 284 mn↑+66.7%
↓ Shrinking sources
- TürkiyeUS$ 54.4 mn → US$ 3.8 mn↓-93%
- United States of AmericaUS$ 89.7 mn → US$ 8.1 mn↓-90.9%
- SudanUS$ 208 mn → US$ 34.3 mn↓-83.5%
- RussiaUS$ 331 mn → US$ 81.2 mn↓-75.5%
- United Arab EmiratesUS$ 59.5 mn → US$ 15.1 mn↓-74.7%
- KenyaUS$ 71.2 mn → US$ 26.7 mn↓-62.6%
Which forms come in, and at what price
Imports by 8-digit tariff line, 2025-26. Average price = total value ÷ total quantity.
| Tariff line | Value 2025-26 | Change | Quantity | Average price |
|---|---|---|---|---|
Pigeon peas (cajanus cajan)0713 60 00 | US$ 947 mn | ↓-26.3% | 1.48 mn tonnes | US$ 0.64 per kg |
Beans of the spp vigna mungo (l.) hepper0713 31 10 | US$ 880 mn | ↓-2.4% | 1.05 mn tonnes | US$ 0.84 per kg |
Lentils (mosur),dried and shld0713 40 00 | US$ 660 mn | ↓-28% | 1.15 mn tonnes | US$ 0.58 per kg |
Vegetables, leguminous, chickpeas, shelled, whether or not skinned or split, dried — bengal gram (desi chana)0713 20 20 | US$ 536 mn | ↓-52% | 1.01 mn tonnes | US$ 0.53 per kg |
Vegetables, leguminous, peas, shelled, whether or not skinned or split, dried — yellow peas0713 10 10 | US$ 398 mn | ↓-58.6% | 1.11 mn tonnes | US$ 0.36 per kg |
Kidny bens including whte pea bens dried and shld0713 33 00 | US$ 114 mn | ↓-23.5% | 1,16,681 tonnes | US$ 0.98 per kg |
Cow peas (vigna unguiculata)0713 35 00 | US$ 58.6 mn | ↓-13.9% | 80,586 tonnes | US$ 0.73 per kg |
Other dried leguminus vegetables0713 39 90 | US$ 32.9 mn | ↓-40.1% | 39,474 tonnes | US$ 0.83 per kg |
Other dried and shld luguminous vegtbls,split0713 90 10 | US$ 2.1 mn | ↑+3.5% | 2,484 tonnes | US$ 0.83 per kg |
Broad beans and horse beans dried and shld0713 50 00 | US$ 1.7 mn | ↓-53.5% | 4,534 tonnes | US$ 0.38 per kg |
Vegetables, leguminous, chickpeas, shelled, whether or not skinned or split, dried — kabuli chana0713 20 10 | US$ 970k | ↓-98.8% | 1,352 tonnes | US$ 0.72 per kg |
Vegetables, leguminous, chickpeas, shelled, whether or not skinned or split, dried — other chana0713 20 90 | US$ 110k | ↓-85.9% | 133 tonnes | US$ 0.83 per kg |
Source: TradeStat — Export Import Data Bank, Department of Commerce · Figures taken 29 October 2026.
More in food and farm goods
All import guides → Free to importFood and farm goodsAlmondsIndia’s largest dry-fruit import. Fixed duty per kg, FSSAI clearance at the port, almost all of it from the USA.Basic duty₹35/kgIGST5%India imported 2025-26US$ 1.43 bn
 Free to importFood and farm goodsPistachios10% basic duty, FSSAI clearance, supply from the USA, Iran, the UAE and Afghanistan.Basic duty10%IGST5%India imported 2025-26US$ 262 mn
 Free to importFood and farm goodsDates20% duty on soft and hard dates, 30% on fresh. The UAE and Iraq are the main suppliers.Basic duty20–30%IGST5%India imported 2025-26US$ 341 mn
 Free to importFood and farm goodsRaw cashew nuts (in shell)Raw material for India’s cashew processing units. 2.5% duty; most comes from West Africa and Tanzania.Basic duty2.5%IGST5%India imported 2025-26US$ 2.29 bn