

South Asia
Export to Maldives
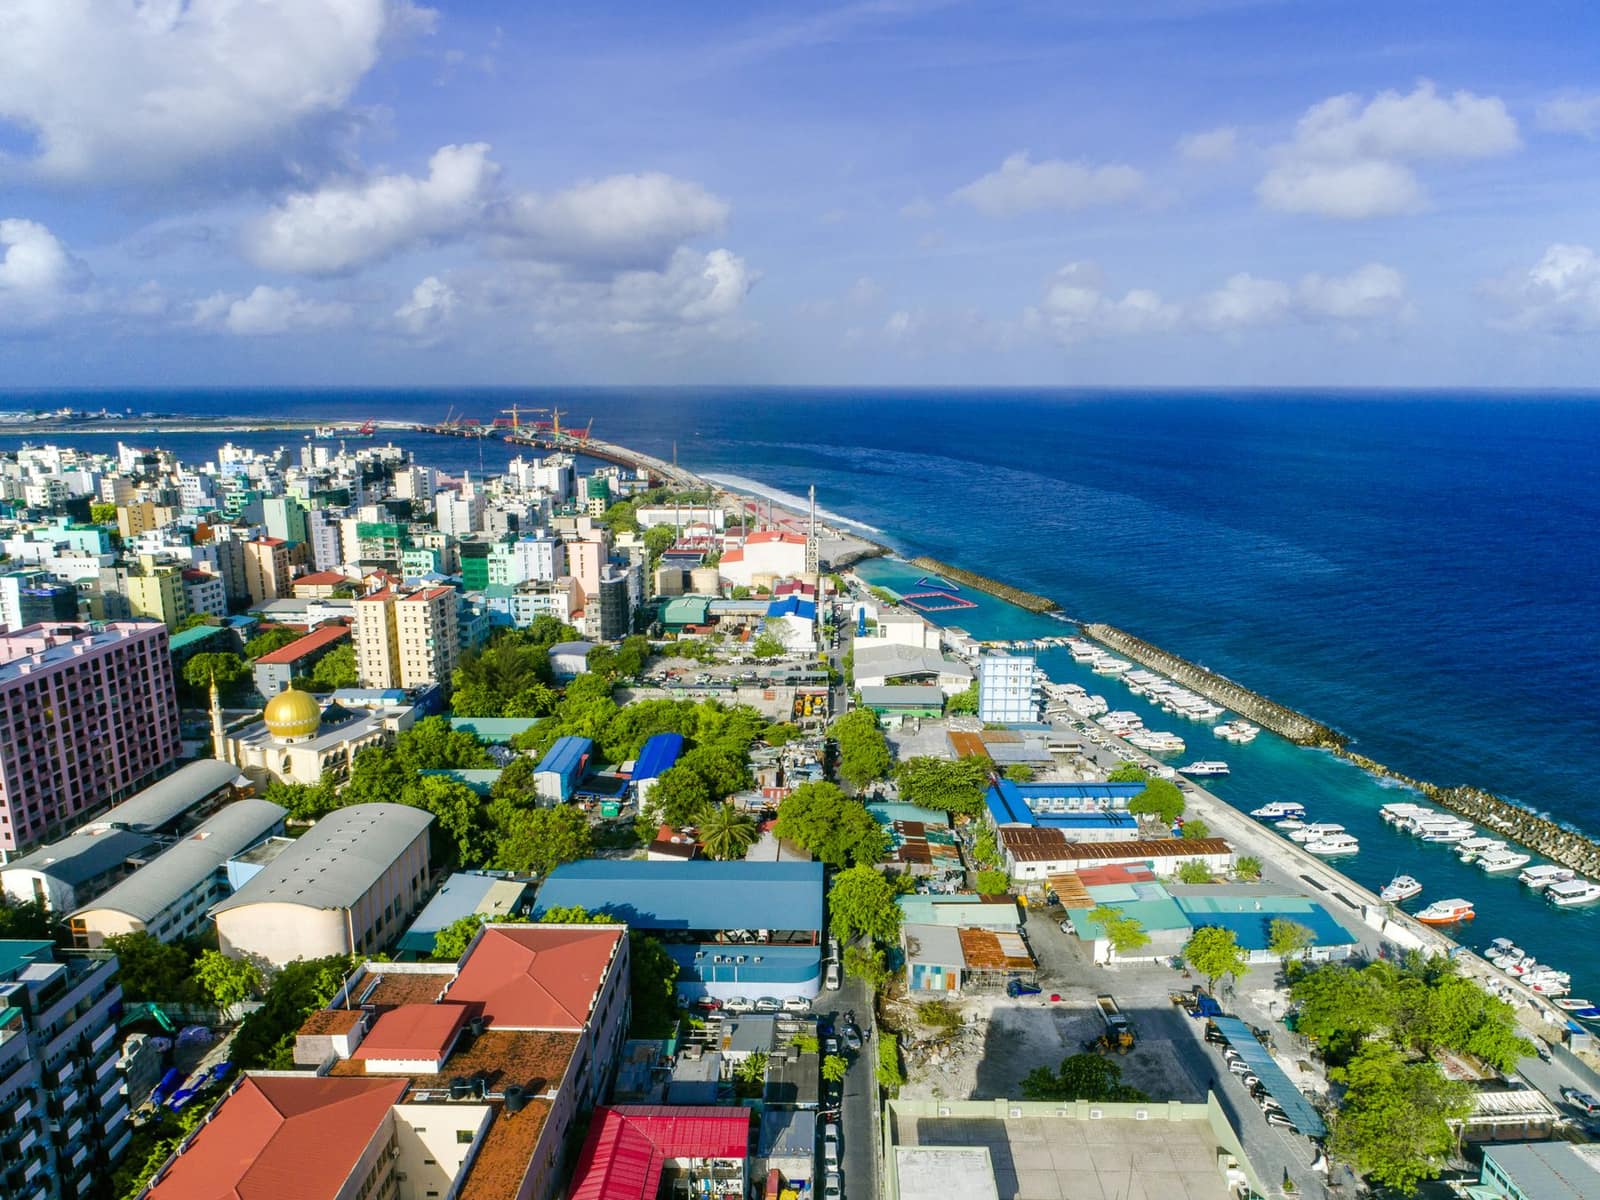
Island neighbour that imports almost all its food and building material. India supplies essentials under special annual quotas.
- Capital
- Malé
- Currency
- MVR
- Trade agreement with India
- South Asian Free Trade Area (SAFTA); India–Maldives FTA under negotiation 1 January 2006
- Main ports
- Malé Commercial Harbour, Thilafushi, Velana International Airport
The Maldives imports nearly everything it eats and builds with, and its resorts need a steady supply of food, furniture and supplies. India is a leading supplier. DGFT notifies annual quantities of essential items (such as rice, wheat flour, sugar, onions, potatoes, eggs and stone aggregates) that can be exported to the Maldives even when exports of those items are otherwise restricted.
SAFTA gives reduced duties on goods not on the Maldives' sensitive list; claim it with a SAFTA certificate of origin from DGFT's platform. India and the Maldives held the first round of bilateral FTA negotiations from 29 June to 7 July 2026. Confirm the current status on commerce.gov.in.
What it buys from India
- Rice, wheat flour, sugar, vegetables, eggs and other food
- Stone aggregates, sand, cement and steel for construction
- Medicines
- Furniture, textiles and hotel supplies
Import rules on their side
- Food imports are regulated by the Maldives Food and Drug Authority (MFDA); food must be fit for consumption with clear labels and expiry dates, and some items need prior approval.
- Medicines must be on the MFDA's approved list or have import approval.
- Pork products and alcohol are restricted; Maldives Customs Service clears all imports.
Practical tips
- For quota items, check the latest DGFT notification for the Maldives quantities and the procedure; exports are allowed only within the notified quantity.
- Tuticorin, Kochi and Mangaluru have regular feeder services to Malé, which suits small shipments.
- Resort buyers want consistent quality and on-time delivery; quote landed prices and agree delivery windows clearly.
Sources (6)
- All India Radio News — India, Maldives conclude first round of FTA talks (Jul 2026)
- DGFT — notifications (export policy, quotas for neighbouring countries)
- DGFT — Common Digital Platform for Certificate of Origin
- Ministry of Health, Maldives (Maldives Food and Drug Authority)
- Maldives Customs Service
- Department of Commerce — TradeStat export-import data bank
Trade data
India’s exports to Maldives in numbers
From the Department of Commerce’s TradeStat (Indian financial years, April–March), the country’s imports from the world from UN Comtrade, and its basics from the World Bank.
- India’s exports here, 2025-26
- US$ 459 mn No. 75 of our 80 countries
- Change from 2024-25
- ↓ -18.2% US$ 561 mn → US$ 459 mn
- Share of all Indian exports
- 0.1%
- Its imports from the world
- —
What India sells here most
By HS chapter, 2025-26. Change is against 2024-25.
What is rising and what is falling
Chapters where India sells at least US$ 5 million. Change from 2024-25 to 2025-26.
↑ High demand
- Furniture, lightingUS$ 3.4 mn → US$ 7.4 mn↑+115.1%
- Ships and boatsUS$ 5.1 mn → US$ 9.3 mn↑+81.1%
- Fish and seafoodUS$ 6.4 mn → US$ 9.3 mn↑+45.4%
- Salt, stone, cementUS$ 26.5 mn → US$ 35.3 mn↑+33.1%
- MeatUS$ 13.6 mn → US$ 16.4 mn↑+20.3%
- Fruit and nutsUS$ 12.2 mn → US$ 14.6 mn↑+19.4%
- Medicines and pharmaUS$ 26.4 mn → US$ 31.1 mn↑+17.8%
- Dairy, eggs, honeyUS$ 20.4 mn → US$ 23 mn↑+12.7%
↓ Low demand
- Sugar and confectioneryUS$ 20.7 mn → US$ 6.7 mn↓-67.8%
- Electrical and electronicsUS$ 28.9 mn → US$ 19.5 mn↓-32.5%
- PlasticsUS$ 25.1 mn → US$ 21.4 mn↓-14.6%
- VegetablesUS$ 23.6 mn → US$ 20.3 mn↓-14.1%
- Iron and steelUS$ 34.1 mn → US$ 29.9 mn↓-12.1%
- Instruments, medical devicesUS$ 12.8 mn → US$ 11.5 mn↓-10.3%
Our product guides that sell here
India’s exports of each product to this country, 2025-26.
The 20 biggest export lines
4-digit HS lines, 2025-26, with their Harmonized System descriptions.
What India buys from Maldives
India’s imports from this country in 2025-26 by HS chapter, from TradeStat — this country can be your supplier too.
- India’s imports, 2025-26
- US$ 313 mn US$ 119 mn → US$ 313 mn
- India’s exports, 2025-26
- US$ 459 mn
- Trade balance
- +US$ 146 mn exports minus imports
- Change in imports
- +163.5%
The country at a glance
- Population
- 530k 2025
- GDP
- US$ 7.74 bn 2025
- GDP per person
- US$ 14,615 2025
- Imports (goods and services)
- US$ 5.53 bn 2024
Sources: TradeStat — Export Import Data Bank, Department of Commerce · World Bank — World Development Indicators · Figures taken 29 October 2026.
What to send to Maldives
All products → Free, with conditionsFarm produceNon-basmati riceHigh-volume staple sold mainly to Africa and Bangladesh. Export reopened in 2024–25, but contracts must now be registered with APEDA.HS1006.30Exports 2025-26US$ 5.86 bn ↓10.2%
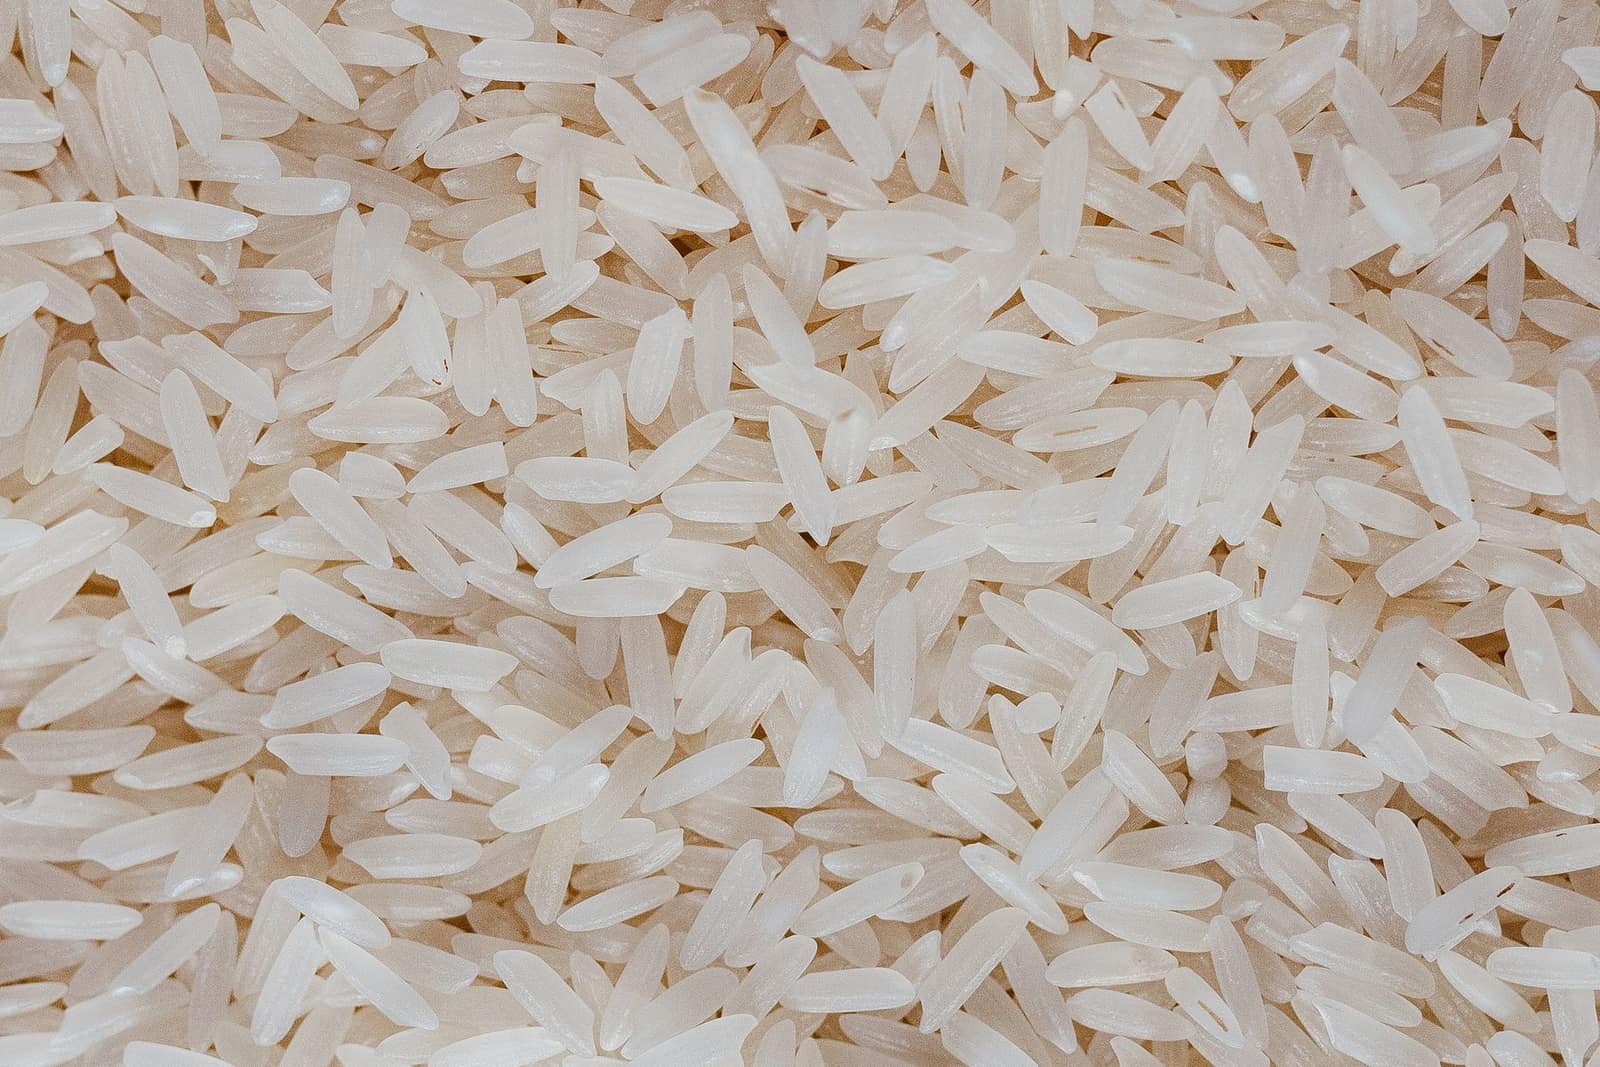 Free, with conditionsFarm produceBasmati riceIndia’s top agri export by value. Free to export, but every contract must be registered with APEDA first.HS1006.30Exports 2025-26US$ 5.67 bn ↓4.6%
 Free to exportFarm produceFresh onionBig-volume fresh export to Asia and the Gulf. Policy swings with domestic prices — check DGFT and CBIC before every season.HS0703.10Exports 2025-26US$ 430 mn ↓8.3%
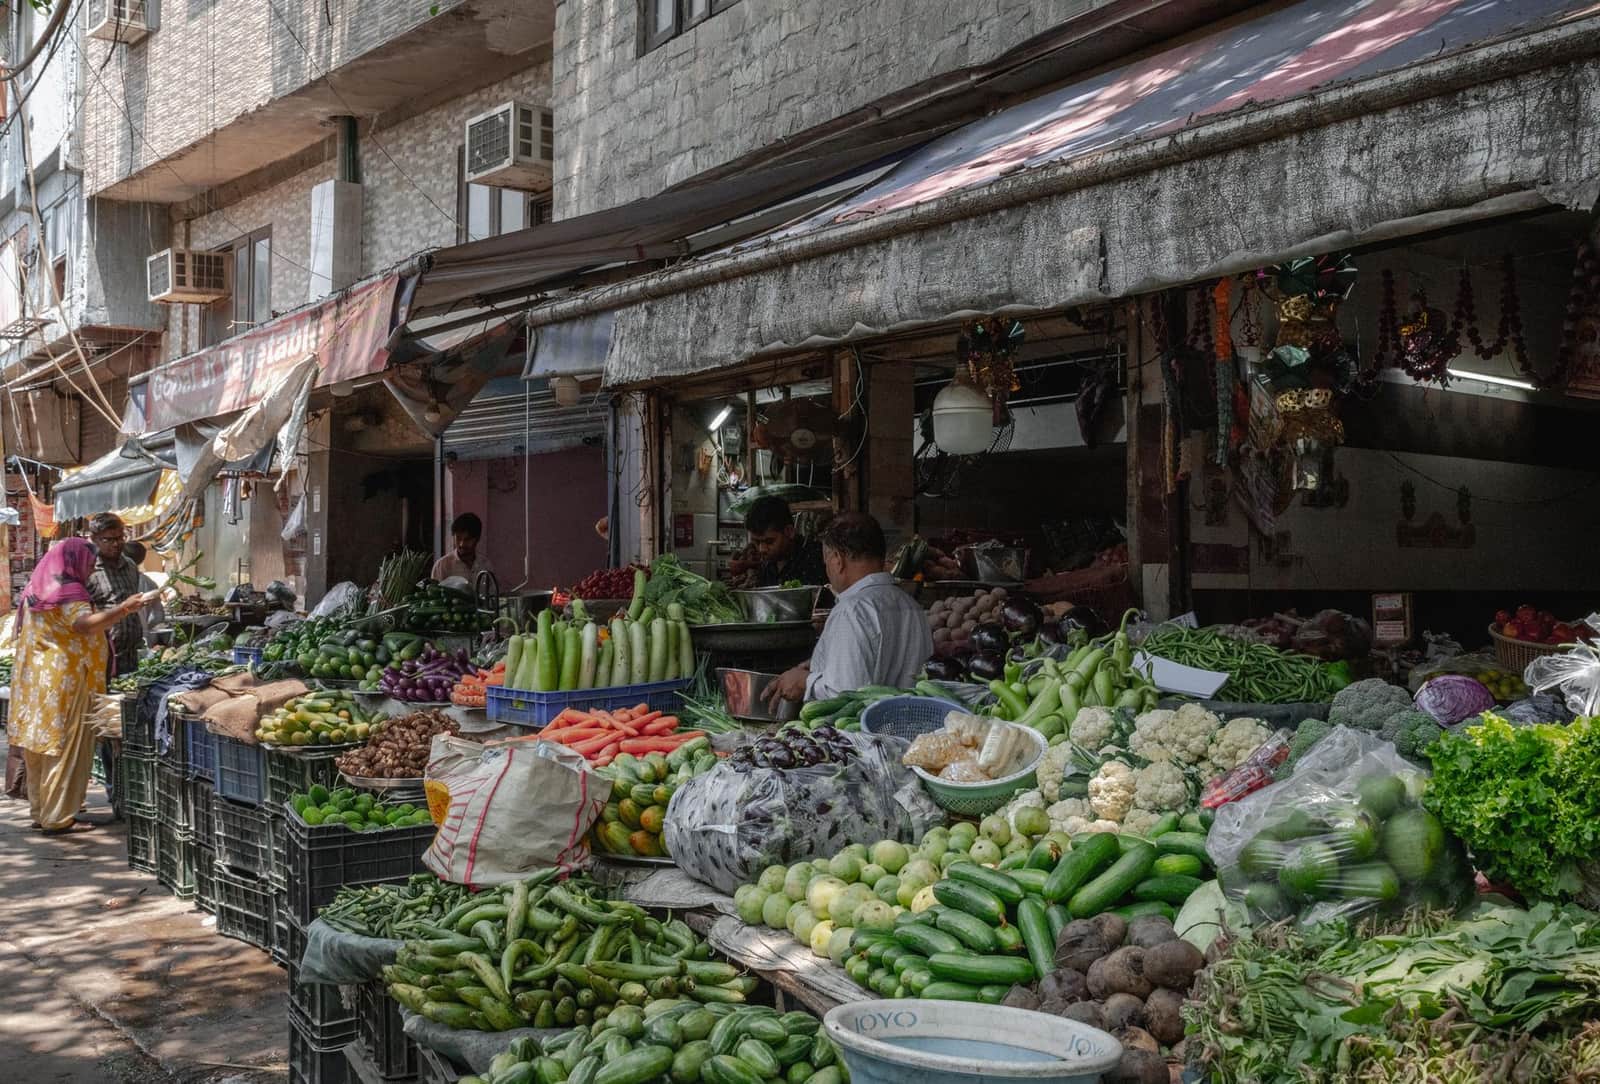 Free to exportFarm produceFresh vegetablesOkra, green chilli, drumstick, gourds and potatoes for Gulf and UK ethnic markets. Fast, perishable and residue-sensitive.HS07Exports 2025-26US$ 2.26 bn ↑3%
 Free to exportFarm produceSpicesWhole, ground and blended spices. Spices Board registration (CRES) is compulsory; residue and ethylene oxide tests keep buyers.HS0904–0910Exports 2025-26US$ 3.12 bn ↓5.1%
 Free to exportProcessed foodProcessed foodSnacks, pickles, ready-to-eat meals, sauces, biscuits and mixes. FSSAI licence plus the buyer country’s labelling and registration rules.HS19–21Exports 2025-26US$ 4.19 bn ↑8.9%
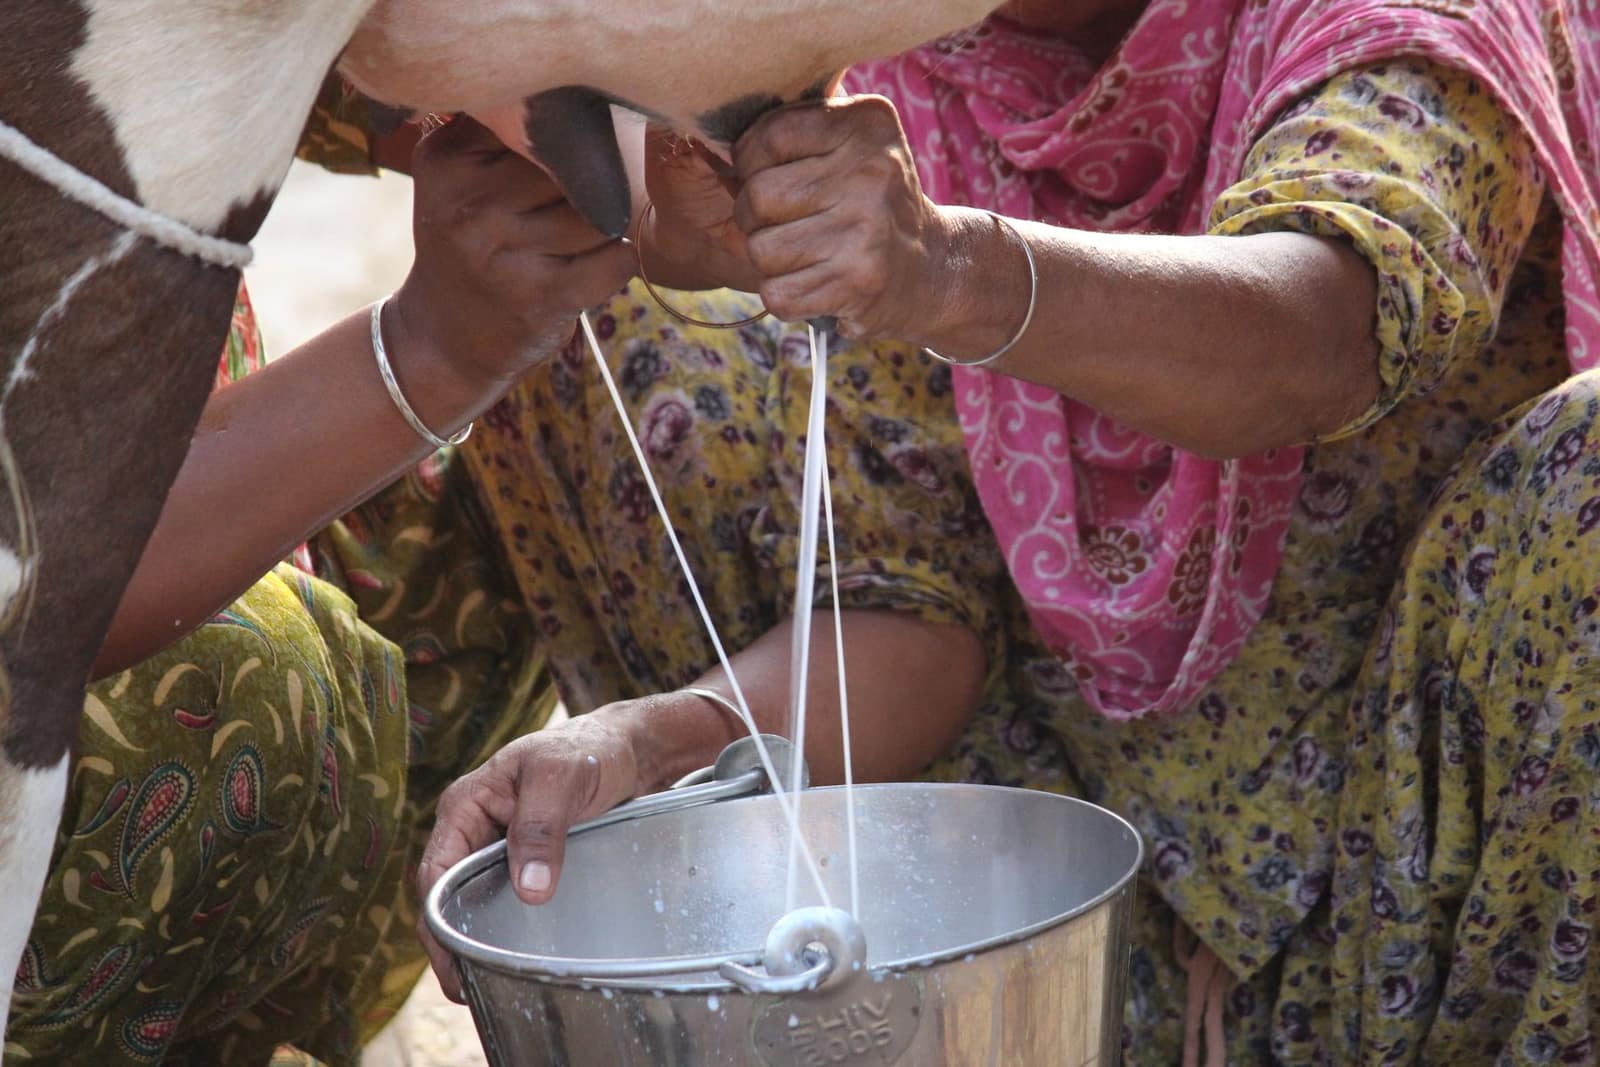 Free to exportProcessed foodDairy productsGhee, milk powder, paneer and butter, mostly to the Gulf and the USA. EIC-approved plants and buyer-country health certificates are needed.HS0401–0406Exports 2025-26US$ 407 mn ↓17.4%
 Free to exportProcessed foodEggsTable eggs from Tamil Nadu’s Namakkal belt to the Gulf, Maldives and Asia. Veterinary certificate and bird-flu status decide access.HS0407Exports 2025-26US$ 212 mn ↑121.4%
More in South Asia
 SAFTABDTDhakaBangladeshBig neighbour market for cotton, yarn, food and machinery. Mostly LC-based; land and sea routes.From India 2025-26US$ 10.6 bn
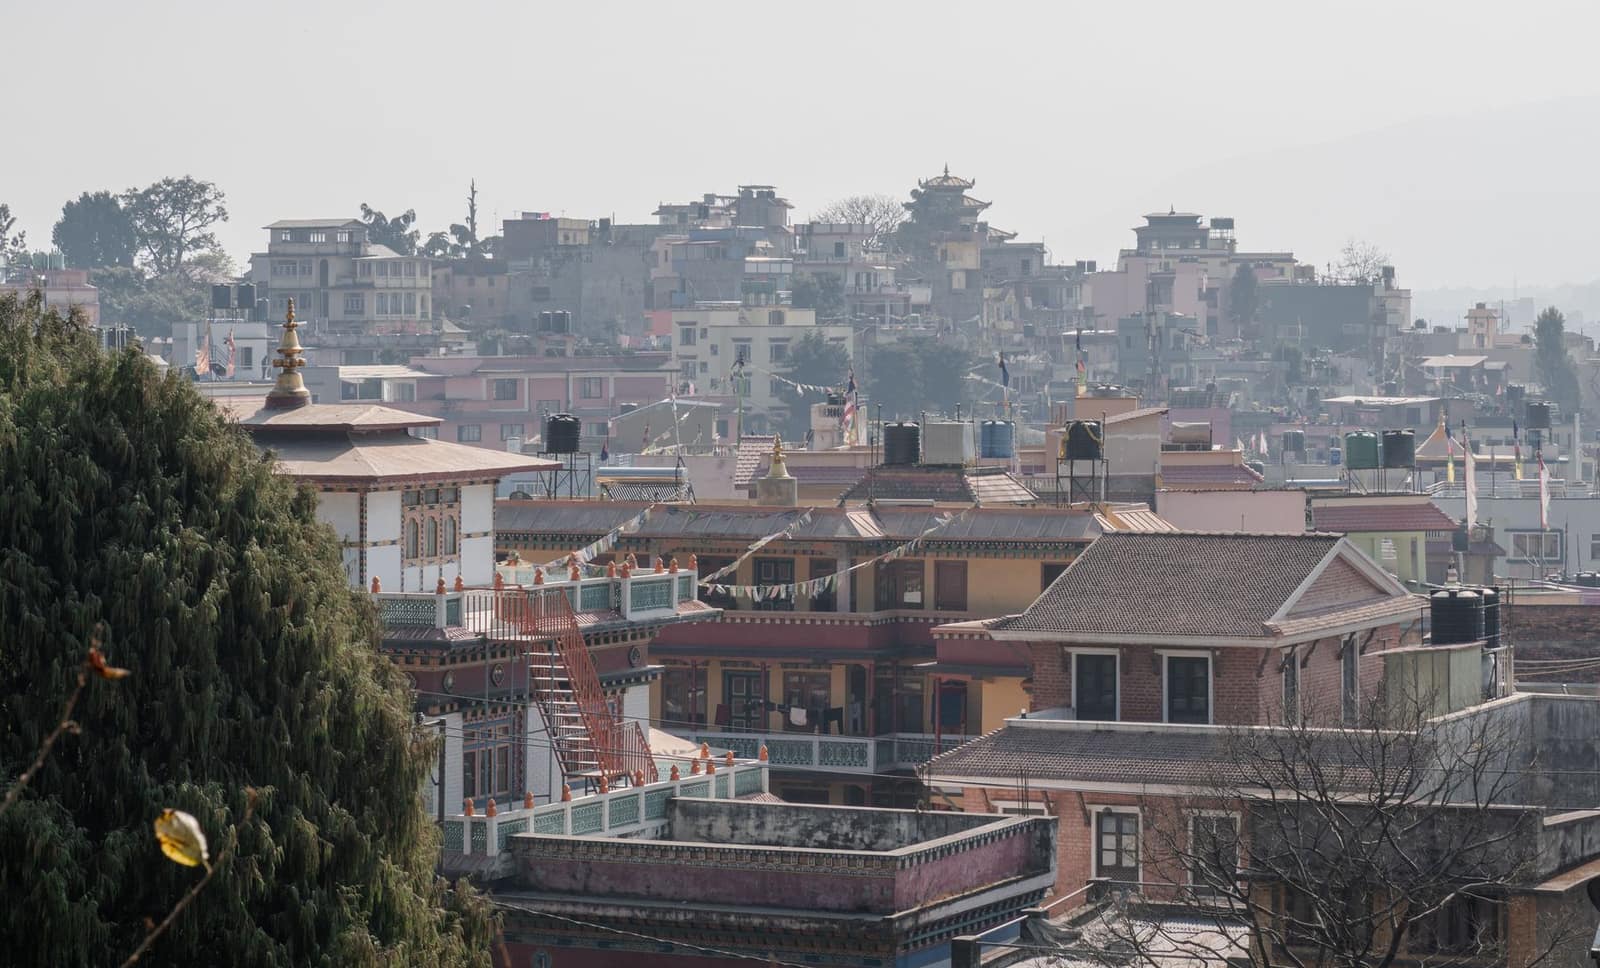 SAFTANPRKathmanduNepalOpen land border, rupee payments and a market that relies on Indian goods — an easy first market by road.From India 2025-26US$ 7.45 bn
 ISFTALKRSri Jayawardenepura Kotte (Colombo is the commercial capital)Sri LankaClose island market with India's oldest FTA. Buys food, medicines, vehicles, yarn and building materials.From India 2025-26US$ 5.52 bn
 SAFTABTNThimphuBhutanDuty-free, rupee-based neighbour market reached by road from West Bengal and Assam.From India 2025-26US$ 1.25 bn