


Raw materials
Import silver
5% BCD + 1% AIDC, 3% IGST. Imports jumped to about US$ 12 billion in FY 2025-26, mainly from the UK and Hong Kong.
- Basic customs duty
- 5% 5%
- Social welfare surcharge
- Nil (exempt)
- IGST
- 3% 3%
- India’s imports, 2025-26
- US$ 12.1 bn from 37 countries
S. No. 197 of notification 45/2025-Customs sets 5% BCD on goods of 7106 (the tariff rate is higher); silver dore with up to 95% silver has its own 5% entry (S. No. 193), valid until 31 Mar 2027 after 2/2026-Customs. Silver is outside the Social Welfare Surcharge. IGST on silver is 3% (Schedule IV, notification 9/2025-Integrated Tax (Rate)). Duty is charged on the fortnightly tariff value. Confirm on ICEGATE before pricing. AIDC 1% (notification 11/2021-Customs as amended in July 2024; 2.5% as first issued). CBIC — Notification 45/2025-Customs (effective duty rates), 24 Oct 2025, as amended ↗
What is imported
Silver is used for jewellery and utensils, solar panels, electronics and as an investment. Imports under 7106 rose to about US$ 12.1 billion in FY 2025-26 from US$ 4.8 billion (TradeStat). The UK supplied 43% and Hong Kong 27%, followed by the USA, Switzerland and the UAE. Like gold, most silver reaches small buyers through banks and nominated agencies.
Import of silver bullion is channelled through nominated agencies and banks, and qualified jewellers through IIBX for specified codes. Conditions differ by 8-digit code, so check the current policy condition in ITC(HS) Chapter 71 on DGFT.
Licences and registrations you need
- RBI / DGFT (nominated agencies)Banks authorised by RBI and agencies nominated by DGFT import silver bullion; check the current list before you buy.rbi.org.in ↗
- IFSCA (qualified jewellers on IIBX)Qualified jewellers can import silver through the India International Bullion Exchange where the policy allows.ifsca.gov.in ↗
What is checked at the port
- Weighing and assay of purity at customs; duty on the CBIC tariff value.
- Importer eligibility under the ITC(HS) condition for the code.
- Origin documents where a trade-agreement rate is claimed.
Practical tips
- Industrial users (solar, electronics) should compare buying from a bank against Advance Authorisation if they export.
- Track the fortnightly tariff value; duty can rise even when your invoice price does not.
Where new importers go wrong
- Importing silver articles or jewellery under a bullion code to get the bullion rate — classification disputes follow.
- Assuming any IEC holder can import bullion without checking the policy condition.
Sources (10)
- CBIC — Notification 45/2025-Customs (effective duty rates), 24 Oct 2025, as amended
- Notification 2/2026-Customs (Budget amendments to 45/2025-Customs), 1 Feb 2026
- CBIC — Customs Tariff of India (as on 30.06.2025)
- Notification 11/2021-Customs — Agriculture Infrastructure and Development Cess (as first issued)
- CBIC — Notification 9/2025-Integrated Tax (Rate), 17 Sep 2025 (IGST rates from 22 Sep 2025)
- DGFT — ITC(HS) import policy (Schedule 1)
- Reserve Bank of India — banks nominated to import gold and silver
- IFSCA — qualified jewellers and India International Bullion Exchange
- Commerce Ministry TradeStat — commodity-wise imports by country (FY 2025-26)
- ICEGATE — Customs duty and tariff look-up
Import data
Where India buys silver
India’s imports from the Department of Commerce’s TradeStat, country by country. US$, financial years.
- Imports, 2025-26
- US$ 12.1 bn
- Change from 2024-25
- ↑+149.6%
- Supplying countries
- 37
- Biggest supplier
- United Kingdom 43%
Biggest supplying countries
Which sources are growing and shrinking
↑ Growing sources
- JapanUS$ 60k → US$ 168 mn↑+2,79,533.3%
- United States of AmericaUS$ 23.6 mn → US$ 1.14 bn↑+4,741.1%
- ChinaUS$ 25.3 mn → US$ 297 mn↑+1,073.2%
- SingaporeUS$ 57.4 mn → US$ 218 mn↑+280.4%
- SwitzerlandUS$ 153 mn → US$ 577 mn↑+277.2%
- United KingdomUS$ 2.12 bn → US$ 5.2 bn↑+145.9%
↓ Shrinking sources
- AustraliaUS$ 280 mn → US$ 95.7 mn↓-65.8%
Which forms come in, and at what price
Imports by 8-digit tariff line, 2025-26. Average price = total value ÷ total quantity.
| Tariff line | Value 2025-26 | Change | Quantity | Average price |
|---|---|---|---|---|
Containing 99.9 percent or more by weight of silver7106 92 21 | US$ 10.8 bn | — | 6,415 tonnes | US$ 1691.29 per kg |
Metals, silver, unwrought, — grains7106 91 10 | US$ 906 mn | ↑+62.9% | 597 tonnes | US$ 1516.90 per kg |
All other semi manufactured forms of slvr7106 92 90 | US$ 184 mn | ↑+64.5% | 156 tonnes | US$ 1183.08 per kg |
Others-of-semi manufactured silver7106 92 29 | US$ 39.5 mn | — | 35 tonnes | US$ 1115.70 per kg |
Sheets plates strips tubes and pipes of slvr7106 92 10 | US$ 36 mn | ↑+18.8% | 26 tonnes | US$ 1384.43 per kg |
Others-of-unwrought silver7106 91 90 | US$ 14.2 mn | ↓-26.7% | 35 tonnes | US$ 409.69 per kg |
Containing 99.9 percent or more by weight of silver7106 91 20 | US$ 13.7 mn | — | 6.8 tonnes | US$ 2002.05 per kg |
Metals, silver powder — silver in powder form7106 10 00 | US$ 7.9 mn | ↑+82.4% | 64 tonnes | US$ 123.16 per kg |
Source: TradeStat — Export Import Data Bank, Department of Commerce · Figures taken 29 October 2026.
More in raw materials
All import guides →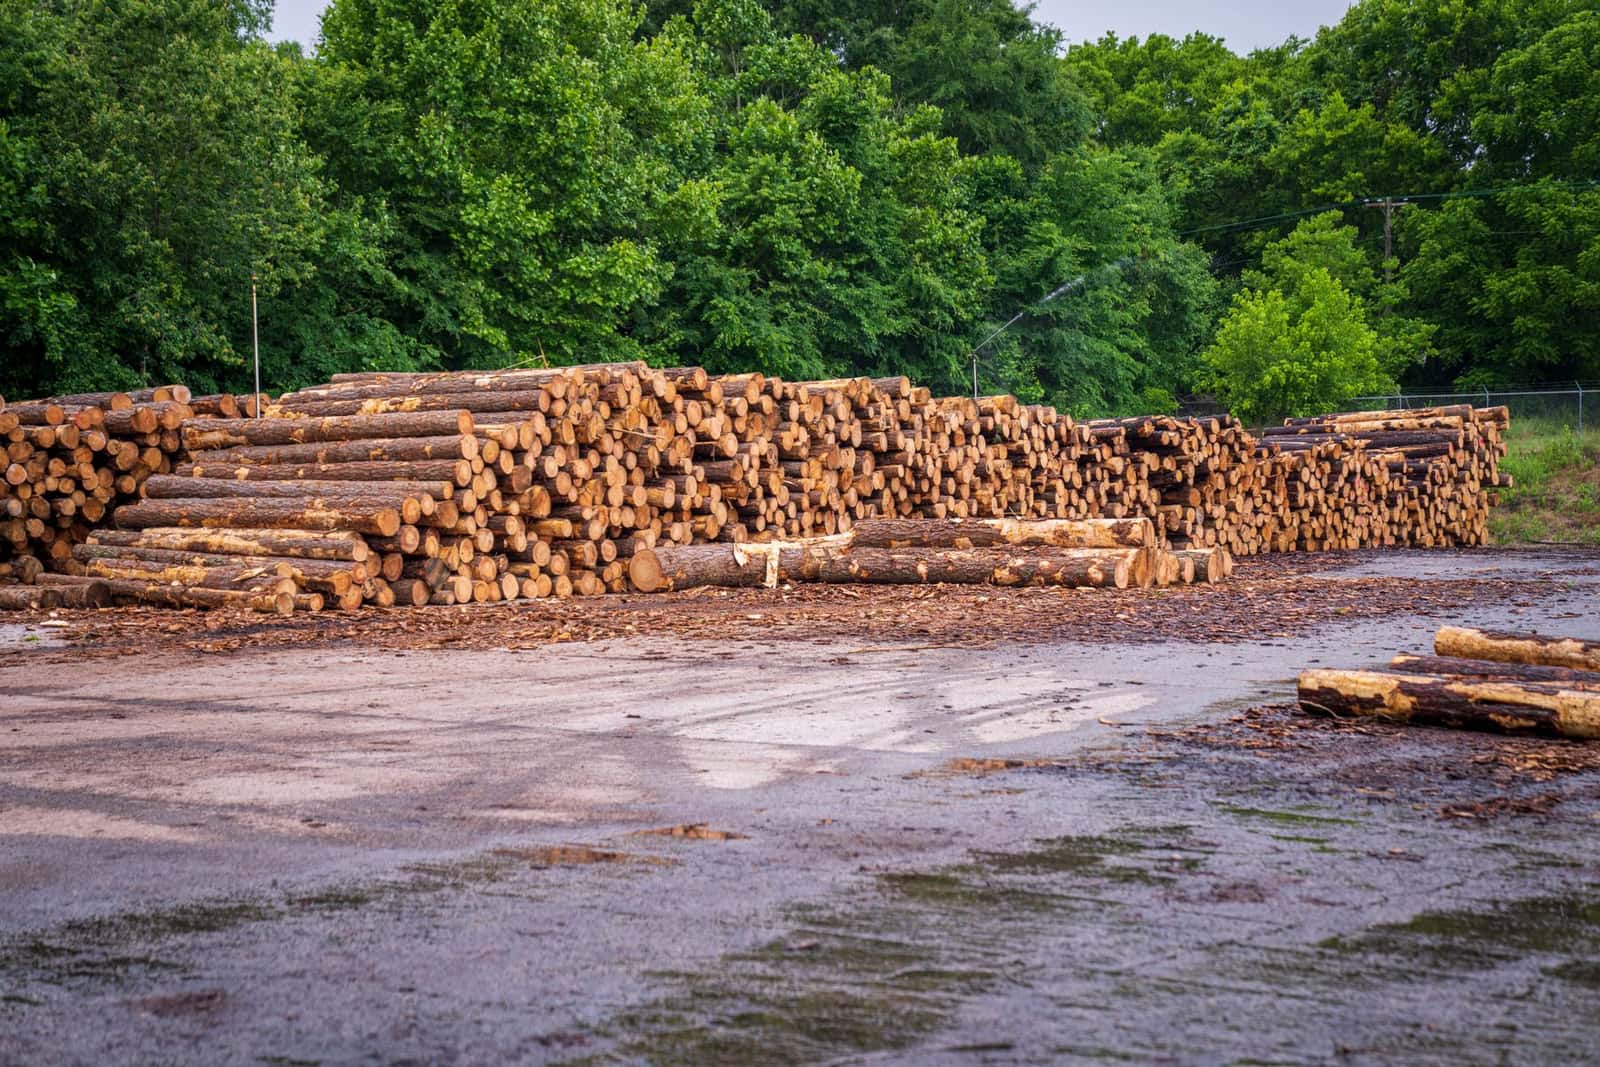 Free, with conditionsRaw materialsTimber logs5% basic duty. Plant quarantine permit and fumigation are the main hurdles. Australia, Malaysia and South America lead supply.Basic duty5%IGSTCheck on ICEGAIndia imported 2025-26US$ 1.01 bn
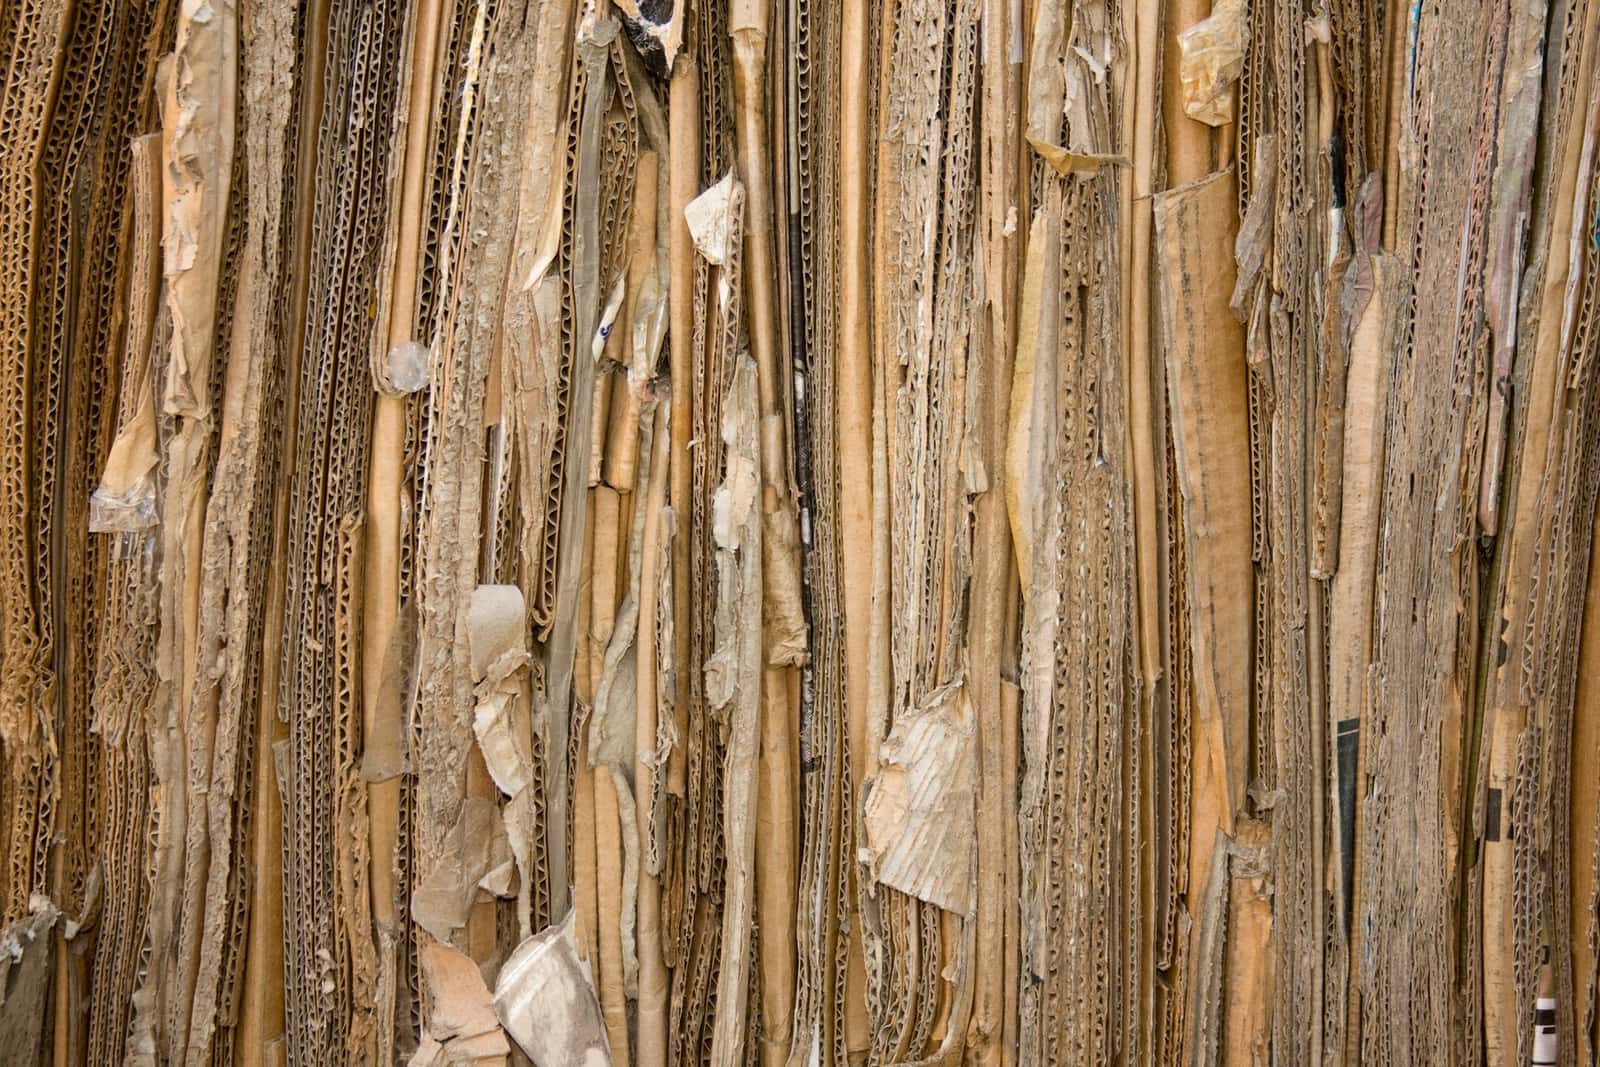 Free, with conditionsRaw materialsWaste paper (recovered paper)Raw material for paper mills. 10% tariff duty, 2.5% for paper and newsprint mills under end-use conditions.Basic duty2.5–10%IGSTCheck on ICEGAIndia imported 2025-26US$ 1.39 bn
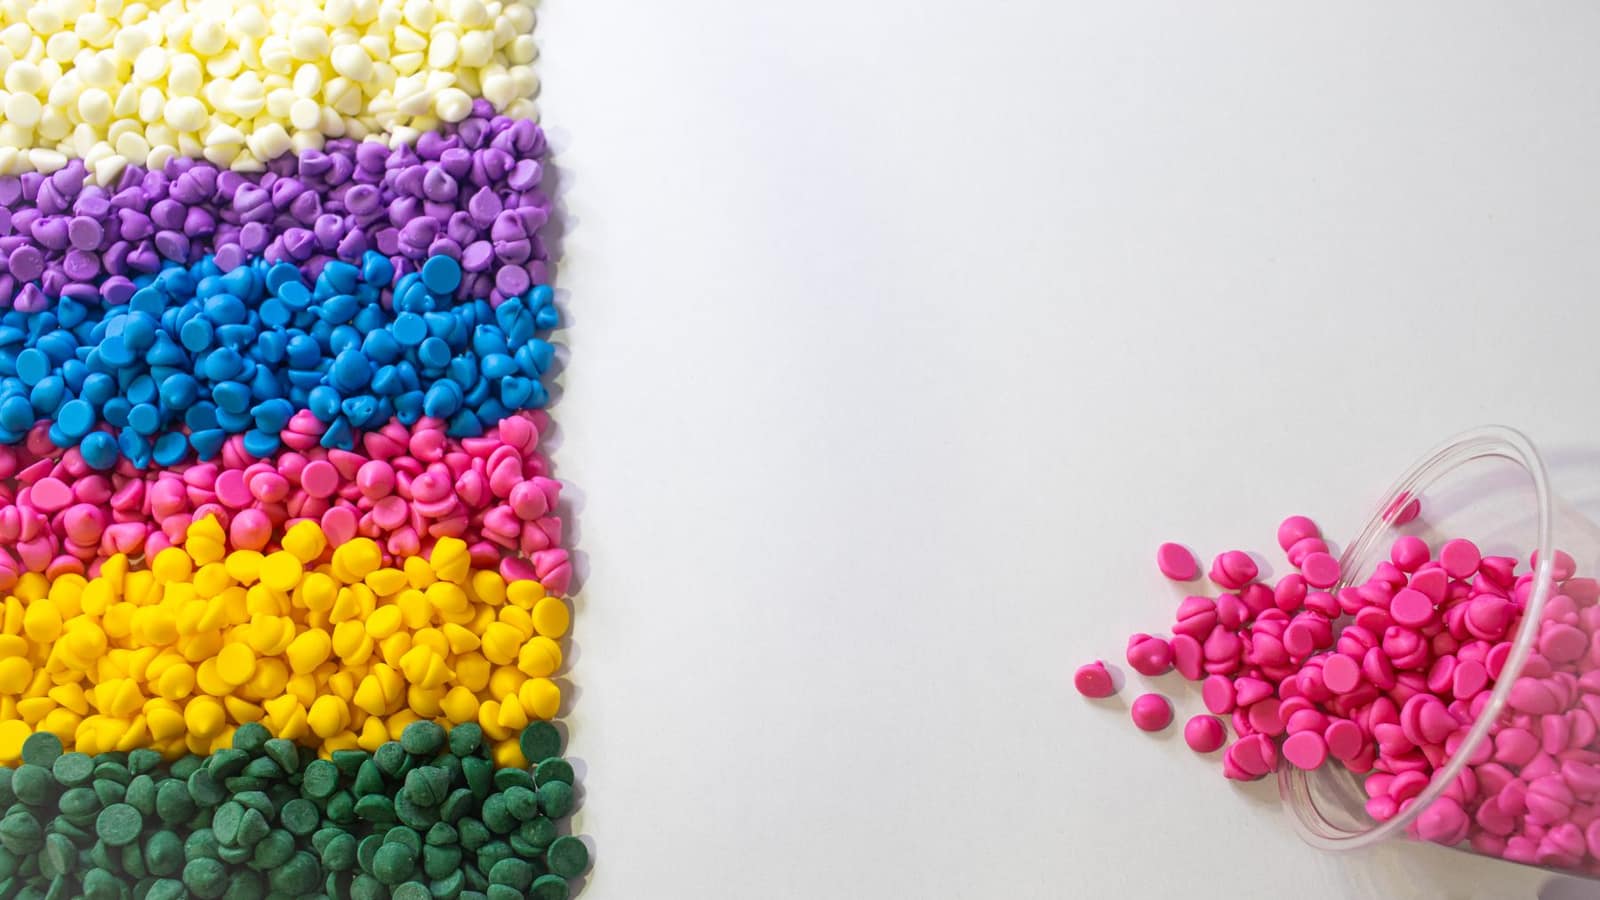 Free to importRaw materialsPlastic granules (polymers in primary forms)Mostly 7.5% basic duty. BIS quality control orders on PE, PP and PVC were withdrawn in Nov 2025. Anti-dumping duty on bottle-grade PET from China.Basic duty5–7.5%IGST18%India imported 2025-26US$ 11.6 bn
 Free, with conditionsRaw materialsSteel sheets and coils (flat-rolled)7.5% basic duty plus an 11.5% safeguard duty until 20 Apr 2027. BIS licence and SIMS registration are compulsory.Basic duty7.5–15%IGST18%India imported 2025-26US$ 2.78 bn