

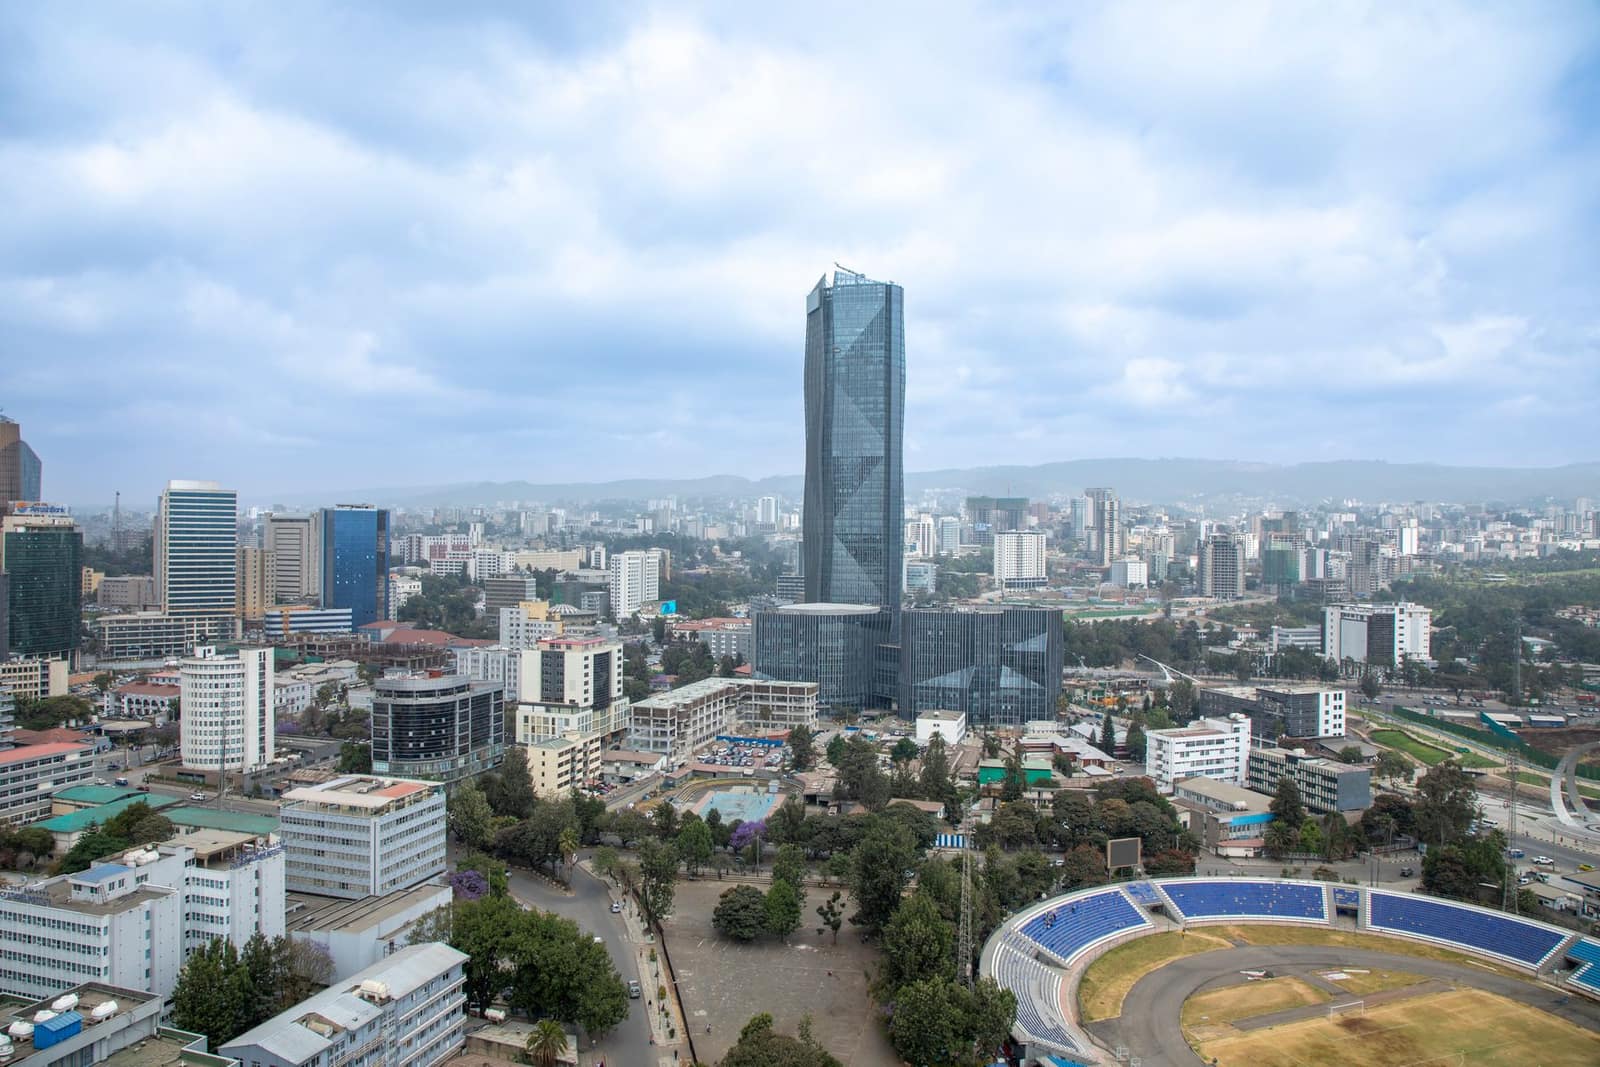
Africa
Export to Ethiopia
Populous, landlocked market reached through Djibouti. Buys Indian medicines, machinery, steel and chemicals; foreign-currency access decides payment.
- Capital
- Addis Ababa
- Currency
- ETB
- Trade agreement with India
- None
- Main ports
- Djibouti (then Addis Ababa–Djibouti railway or road), Modjo dry port, Addis Ababa Bole International Airport
Ethiopia has no trade agreement with India. It is landlocked and almost all of its sea cargo moves through Djibouti and then by rail or road. Indian medicines, machinery, steel, chemicals and vehicles are important to its economy. In July 2024 the National Bank of Ethiopia moved to a market-based exchange rate; buyers still need their bank to allocate foreign currency before an LC opens.

What it buys from India
- Medicines and pharmaceutical products
- Machinery, vehicles and auto parts
- Iron and steel products
- Chemicals, plastics and cotton yarn
Import rules on their side
- Food, medicines and medical devices need registration and an import permit from the Ethiopian Food and Drug Authority (EFDA).
- Goods under mandatory standards are checked for conformity before release; customs is run by the Ethiopian Customs Commission.
- Imports are normally paid through an Ethiopian bank by LC or documentary collection, under National Bank of Ethiopia rules.
Practical tips
- Do not ship until the LC is opened and, ideally, confirmed by a bank your Indian bank accepts.
- Allow for longer delivery time: port clearance in Djibouti plus inland transport adds days or weeks.
- Check ECGC cover for Ethiopia and the latest National Bank of Ethiopia directives before agreeing credit terms.
Trade data
India’s exports to Ethiopia in numbers
From the Department of Commerce’s TradeStat (Indian financial years, April–March), the country’s imports from the world from UN Comtrade, and its basics from the World Bank.
- India’s exports here, 2025-26
- US$ 438 mn No. 76 of our 80 countries
- Change from 2024-25
- ↓ -8.1% US$ 477 mn → US$ 438 mn
- Share of all Indian exports
- 0.1%
- Its imports from the world
- —
What India sells here most
By HS chapter, 2025-26. Change is against 2024-25.
What is rising and what is falling
Chapters where India sells at least US$ 5 million. Change from 2024-25 to 2025-26.
↑ High demand
- Stone, plaster, cement articlesUS$ 2.9 mn → US$ 6.8 mn↑+133.1%
- Instruments, medical devicesUS$ 10.9 mn → US$ 15.3 mn↑+40.3%
- RubberUS$ 10.5 mn → US$ 14.3 mn↑+35.5%
- MachineryUS$ 35.3 mn → US$ 46.4 mn↑+31.4%
- Knitted fabricsUS$ 8.6 mn → US$ 10.7 mn↑+23.8%
- Organic chemicalsUS$ 7.4 mn → US$ 8.6 mn↑+16.5%
↓ Low demand
- PlasticsUS$ 30.6 mn → US$ 12.2 mn↓-60%
- Vehicles and partsUS$ 35.3 mn → US$ 20.2 mn↓-42.7%
- Other chemical productsUS$ 30.4 mn → US$ 18 mn↓-40.9%
- Iron and steel articlesUS$ 7.6 mn → US$ 6.6 mn↓-12.4%
Our product guides that sell here
India’s exports of each product to this country, 2025-26.
The 20 biggest export lines
4-digit HS lines, 2025-26, with their Harmonized System descriptions.
What India buys from Ethiopia
India’s imports from this country in 2025-26 by HS chapter, from TradeStat — this country can be your supplier too.
- India’s imports, 2025-26
- US$ 249 mn US$ 73.4 mn → US$ 249 mn
- India’s exports, 2025-26
- US$ 438 mn
- Trade balance
- +US$ 190 mn exports minus imports
- Change in imports
- +238.7%
The country at a glance
- Population
- 135 mn 2025
- GDP
- US$ 126.4 bn 2025
- GDP per person
- US$ 933 2025
- Imports (goods and services)
- US$ 25.5 bn 2025
Sources: TradeStat — Export Import Data Bank, Department of Commerce · World Bank — World Development Indicators · Figures taken 29 October 2026.
What to send to Ethiopia
All products → Free to exportPharma & chemicalsGeneric medicines (formulations)Tablets, capsules and injectables; every market needs product registration. The USA buys the most.HS3004Exports 2025-26US$ 21.9 bn ↓0.7%
 Free to exportPharma & chemicalsBulk drugs (APIs)APIs and intermediates from Hyderabad, Visakhapatnam and Gujarat; regulated buyers need DMFs and GMP inspections.HS2933Exports 2025-26US$ 7.78 bn ↓0.6%
 Free to exportEngineering goodsAuto parts and componentsOEM and aftermarket vehicle parts; the USA, Germany and Italy buy most, with strong demand in Latin America.HS8708Exports 2025-26US$ 7.64 bn ↑1.8%
 Free to exportEngineering goodsMotorcycles and scootersCommuter motorcycles and scooters for Latin America, Africa and South Asia; India is a top exporter.HS8711Exports 2025-26US$ 3.98 bn ↑24.2%
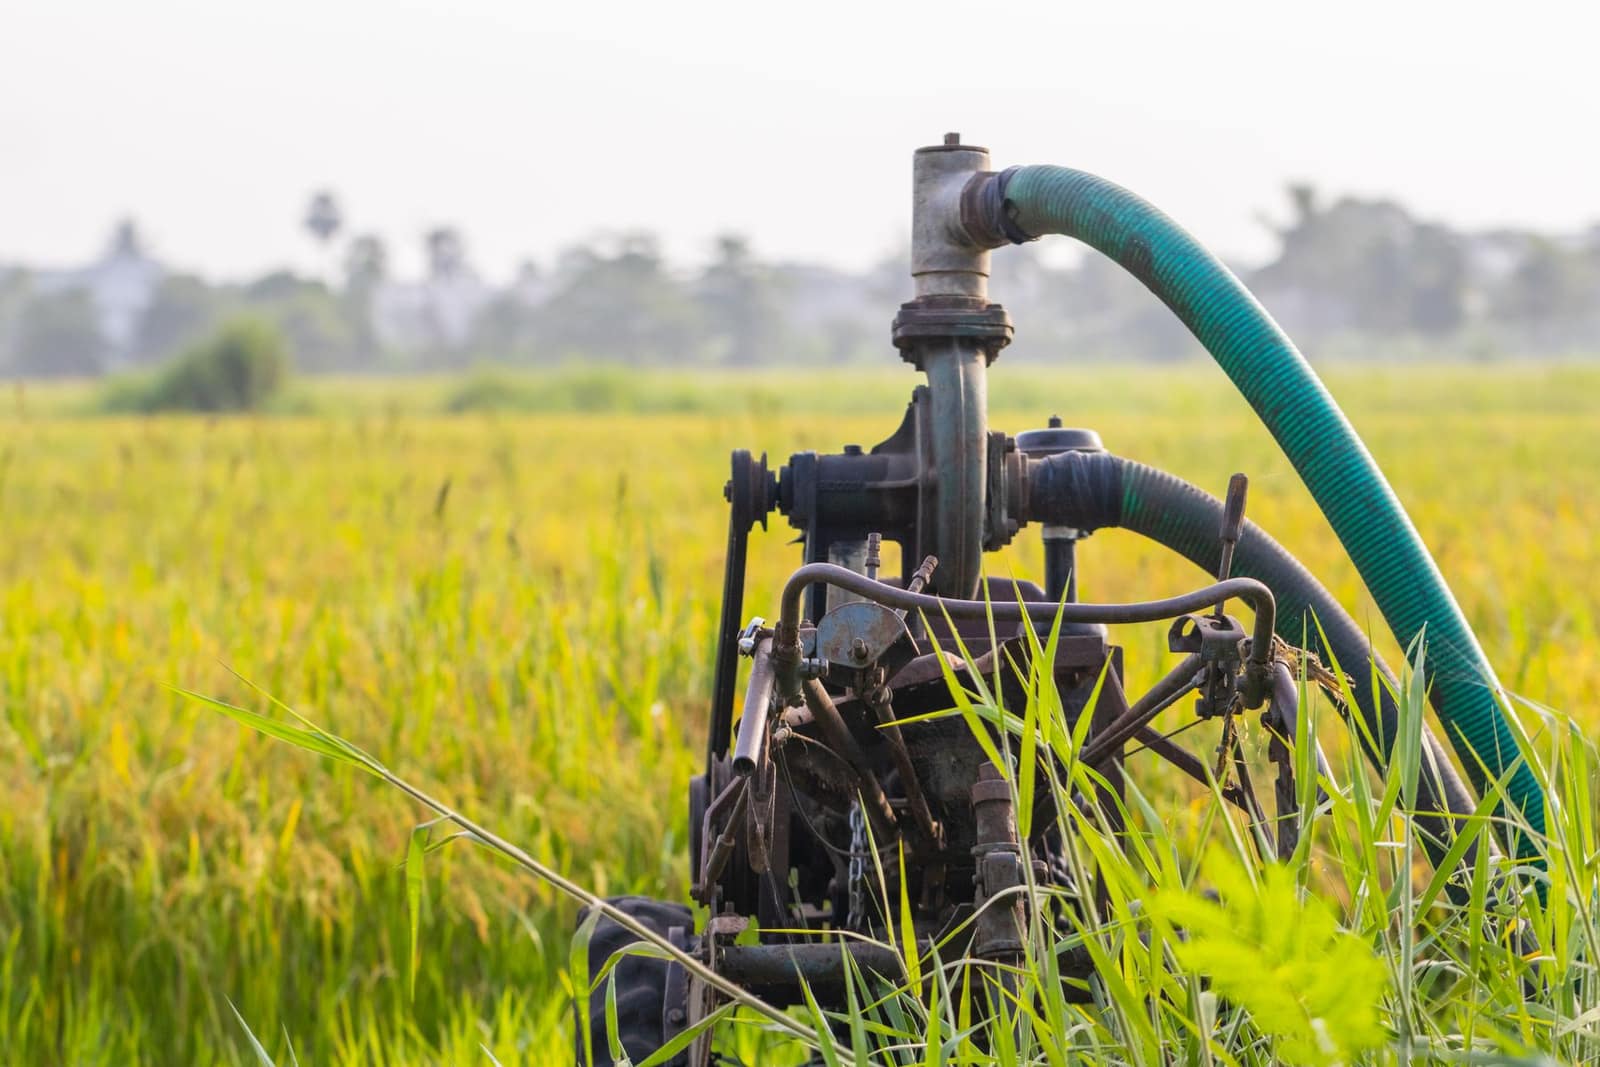 Free to exportEngineering goodsPumpsAgricultural, domestic and industrial pumps from Coimbatore, Rajkot and Ahmedabad; the USA leads.HS8413Exports 2025-26US$ 1.6 bn ↑5.2%
 Free to exportEngineering goodsFarm machineryRotavators, harrows, threshers and implements from Punjab, Gujarat and Maharashtra; the USA, Germany and Sri Lanka lead.HS8432Exports 2025-26US$ 390 mn ↑18.9%
 Free to exportEngineering goodsSteel pipes and tubesSeamless, line pipe and welded steel pipes; the USA, the Gulf and Canada are the main buyers.HS7304Exports 2025-26US$ 2.32 bn ↑7.2%
 Free to exportOther goodsPlastic goods and packagingWoven sacks, FIBC bags, containers and household plastics; the USA leads, then the UAE and UK.HS3923Exports 2025-26US$ 1.21 bn ↑3.3%
More in Africa
 KESNairobiKenyaEast Africa's trade gateway via Mombasa. Buys medicines, vehicles, steel and rice; KEBS pre-shipment checks apply.From India 2025-26US$ 4.02 bn
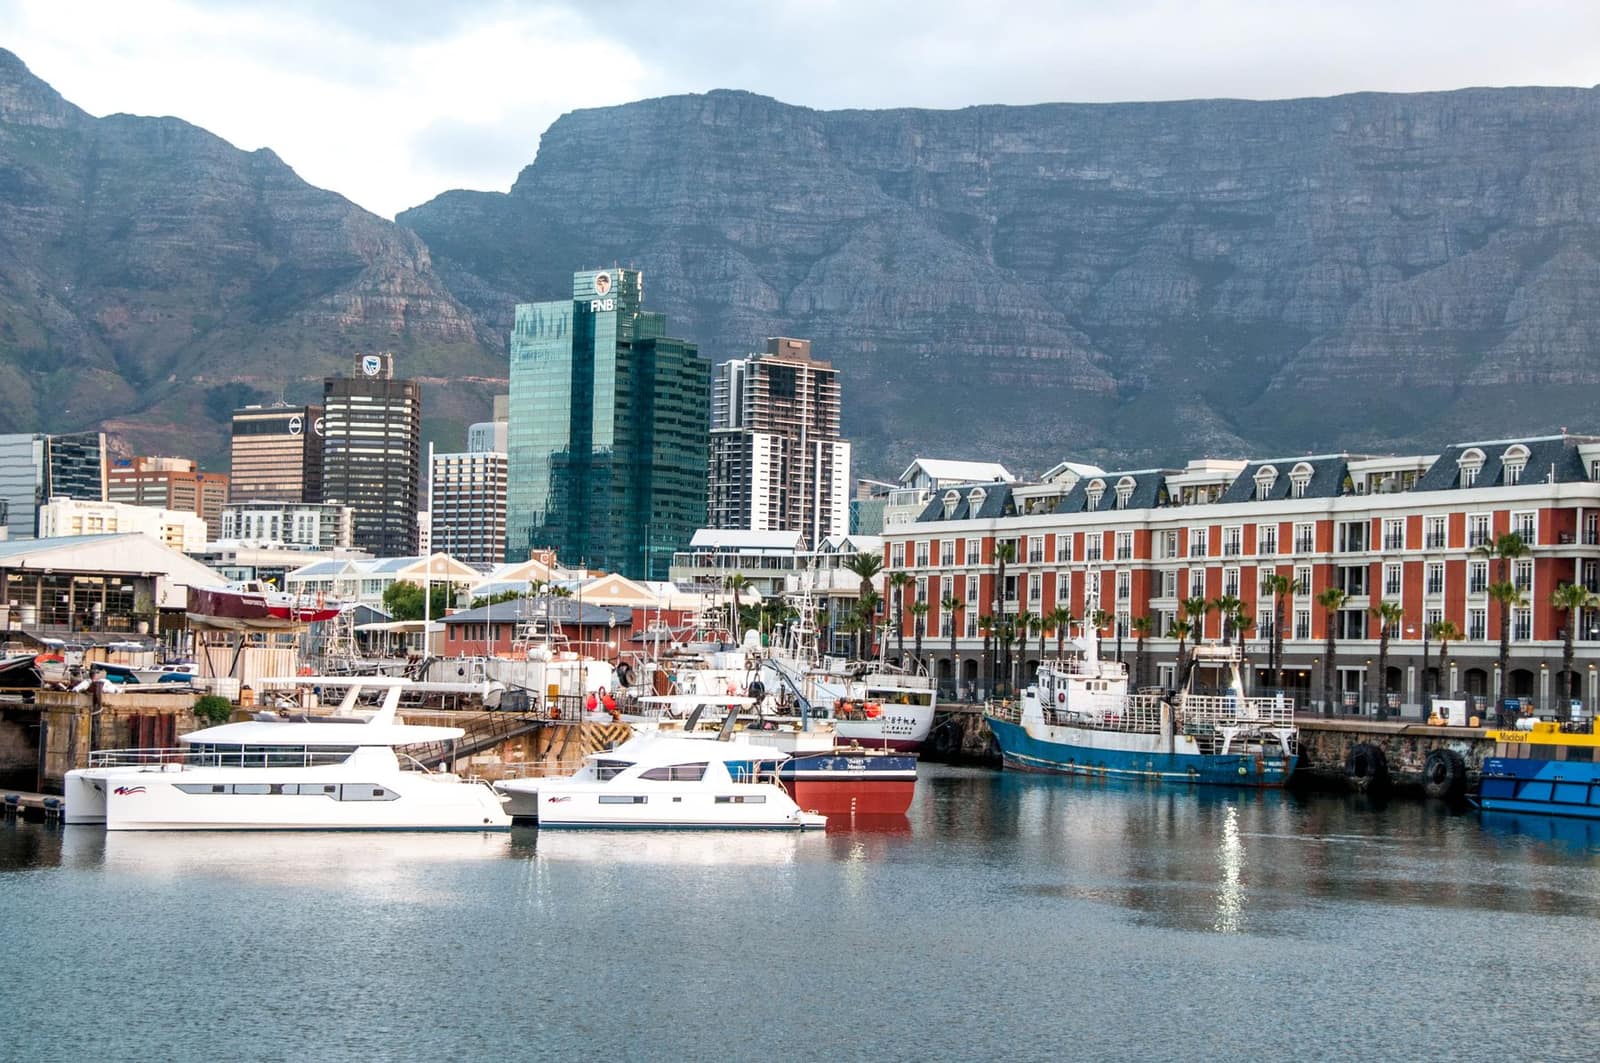 ZARPretoria (executive capital)South AfricaAfrica's most industrial economy. Buys vehicles, medicines, rice and chemicals; NRCS approval for regulated goods.From India 2025-26US$ 7.01 bn
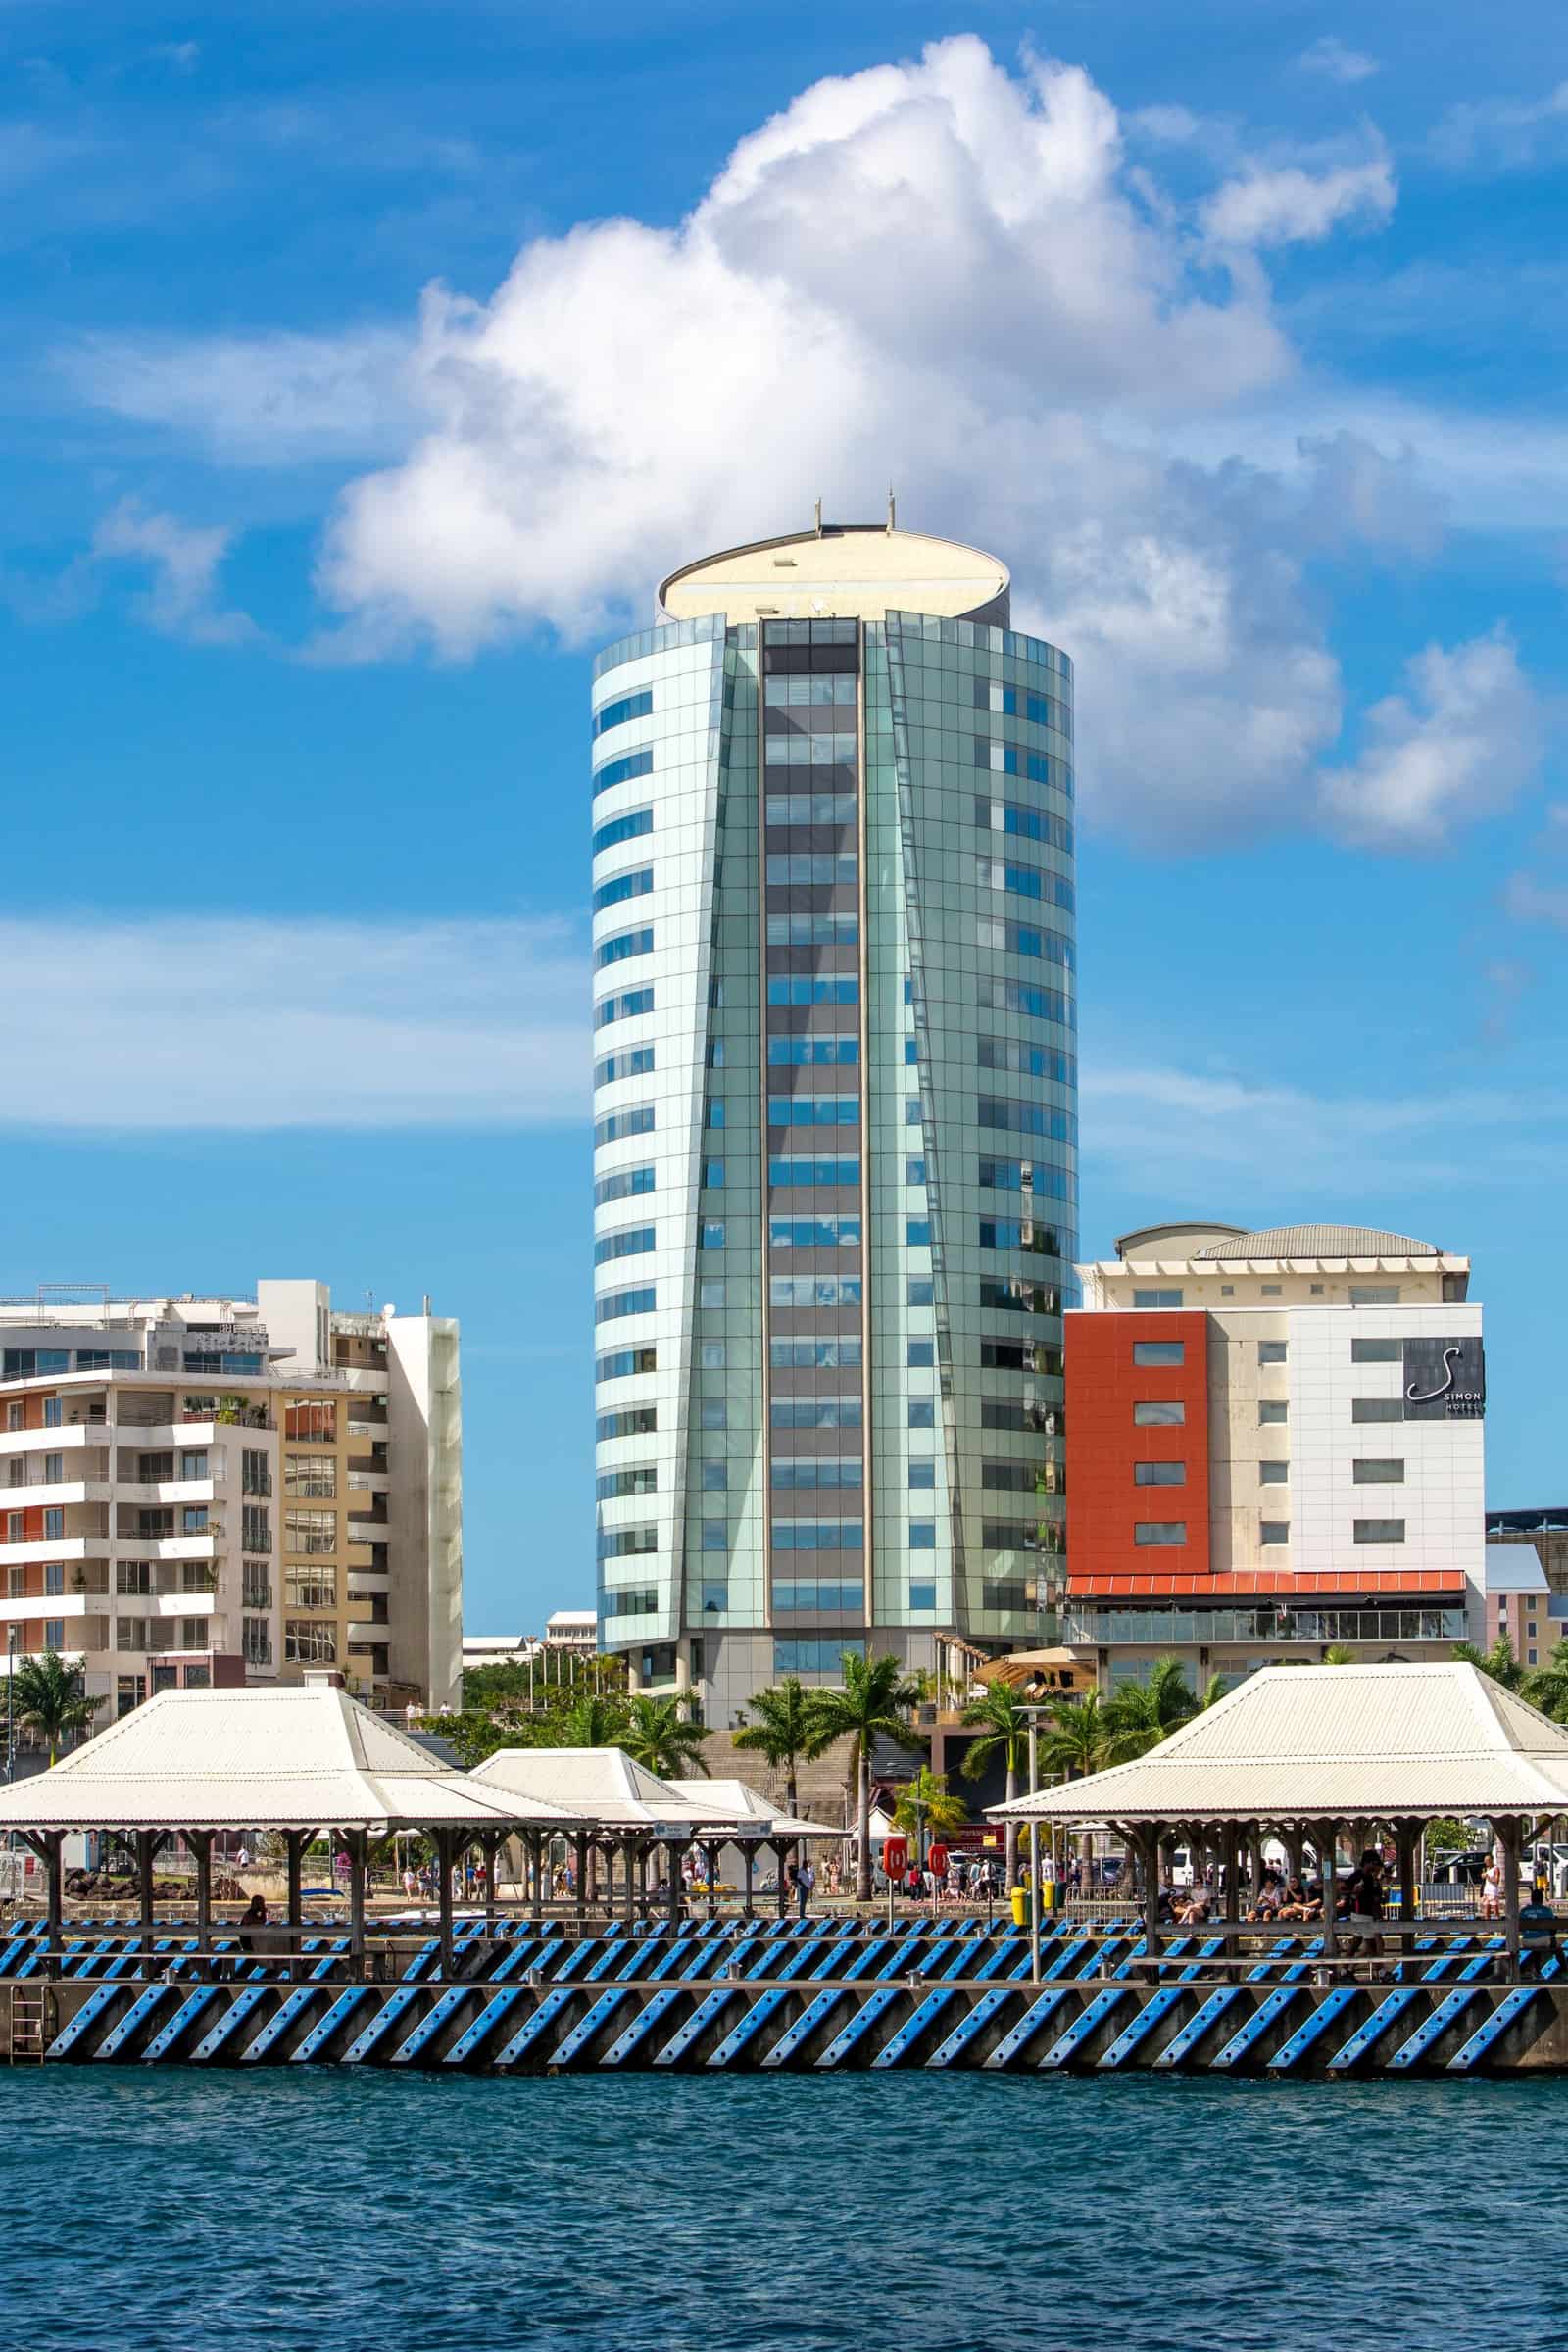 CECPAMURPort LouisMauritiusSmall island market with deep Indian roots and a CECPA covering 300+ products.From India 2025-26US$ 474 mn
 EGPCairoEgyptLarge North African market. Every shipment must be pre-registered on Egypt's ACI system before loading.From India 2025-26US$ 3.87 bn