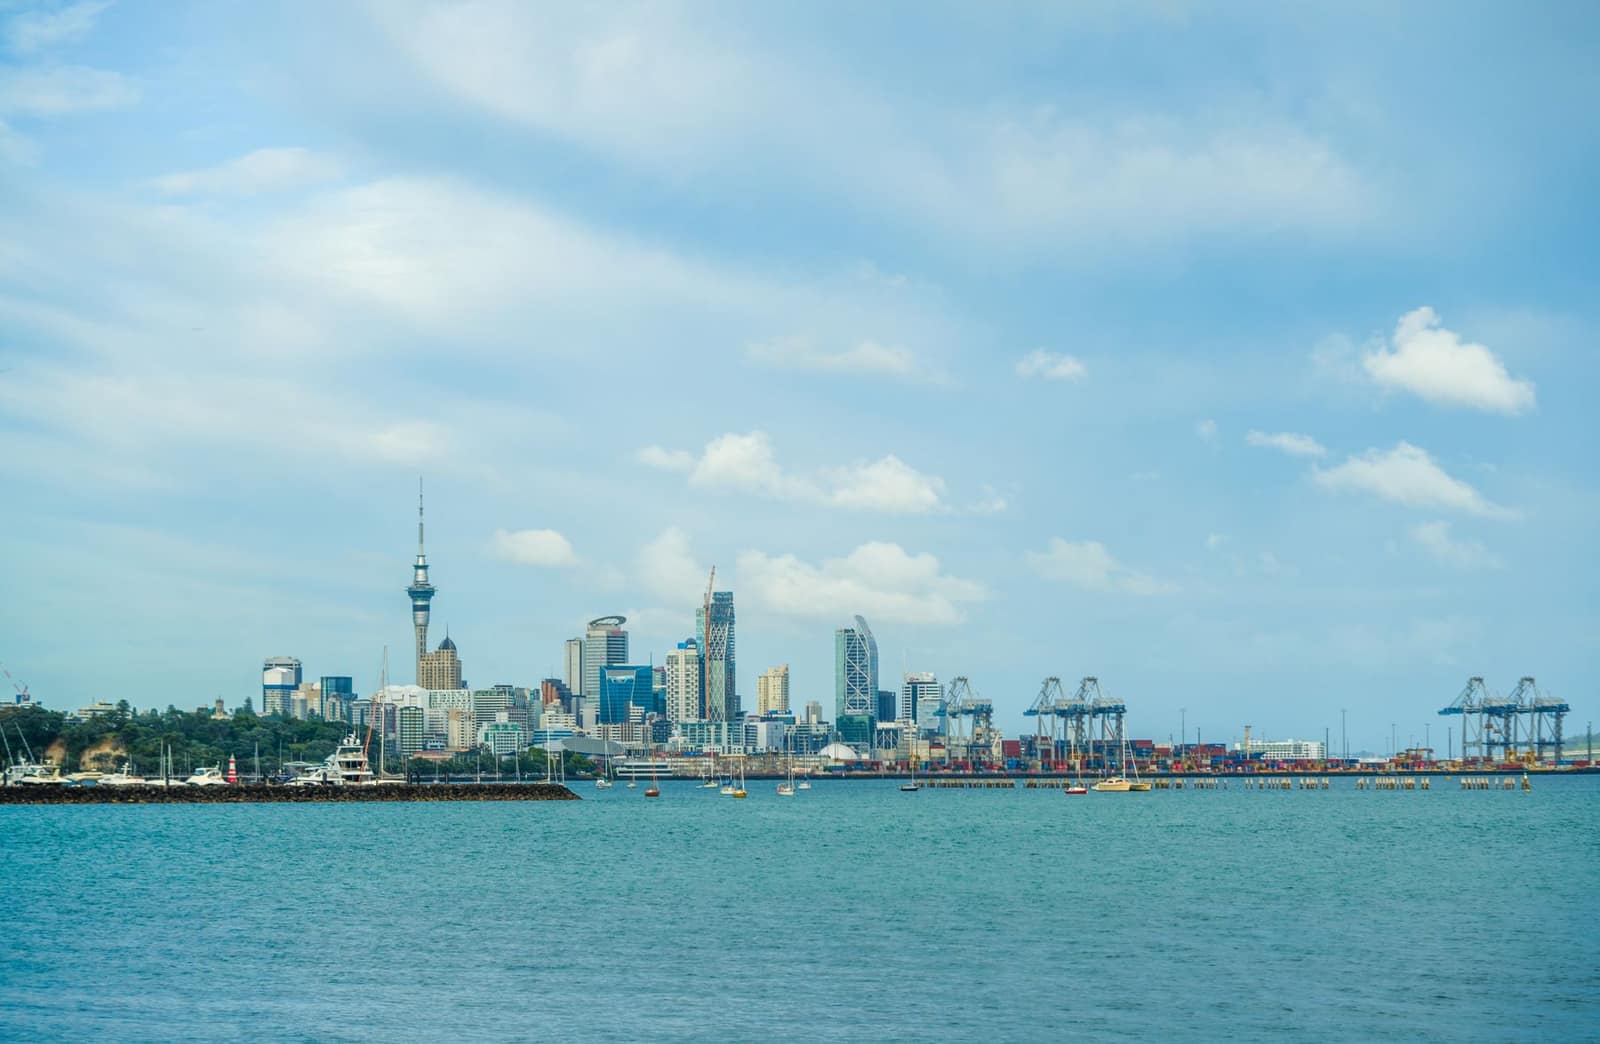
Oceania
Export to New Zealand
Zero duty on all Indian goods since 20 October 2026, but some of the world’s strictest biosecurity rules.
- Capital
- Wellington
- Currency
- NZD
- Trade agreement with India
- India–New Zealand Free Trade Agreement 20 October 2026
- Main ports
- Auckland, Tauranga, Lyttelton (Christchurch)
New Zealand is small but wealthy, with a growing Indian community. The new FTA gives Indian goods zero duty from 20 October 2026, with gains named for textiles, garments, leather, footwear, engineering goods and processed food. The hard part is biosecurity: food, plant, wood and animal products must meet the Ministry for Primary Industries’ import health standards.

The FTA was concluded in December 2025, signed in April 2026 and entered into force on 20 October 2026 (New Zealand MFAT). New Zealand removes duty on 100% of its tariff lines for Indian goods from entry into force, provided the product meets the rules of origin. Get the FTA certificate of origin through DGFT’s online platform.
What it buys from India
- Medicines, machinery and vehicles
- Garments, home textiles, footwear and jewellery
- Rice, spices and processed food for the Indian and wider market
Import rules on their side
- Food, plant, wood and animal products must meet MPI import health standards; some need an import permit and treatment certificates. Undeclared risk goods are destroyed or re-shipped at your cost.
- Wooden packaging and pallets must be ISPM 15 treated and marked, and containers must be clean of soil and pests.
- Food labels follow the joint Australia New Zealand Food Standards Code, in English.
Practical tips
- Dairy, onions, sugar and some other sensitive products were kept out of India’s tariff concessions, but New Zealand’s side gives zero duty on all Indian goods. Check the product-specific rules of origin before you claim it.
- Orders are often small; Australian distributors sometimes cover New Zealand too, so ask about both markets.
- Buyers are direct and expect accurate documents; open account terms are common for established suppliers, so use ECGC cover.
Sources (7)
- New Zealand MFAT — NZ-India Free Trade Agreement (entered into force 20 Oct 2026)
- Department of Commerce — India's Free Trade Agreements 2025-26: Key Highlights
- PIB backgrounder — India's Trade Partnerships (27 Feb 2026)
- New Zealand Ministry for Primary Industries — importing
- New Zealand Customs Service
- Food Standards Australia New Zealand
- Department of Commerce — TradeStat export-import data bank
Trade data
India’s exports to New Zealand in numbers
From the Department of Commerce’s TradeStat (Indian financial years, April–March), the country’s imports from the world from UN Comtrade, and its basics from the World Bank.
- India’s exports here, 2025-26
- US$ 567 mn No. 72 of our 80 countries
- Change from 2024-25
- ↓ -20.3% US$ 711 mn → US$ 567 mn
- Share of all Indian exports
- 0.13%
- Its imports from the world
- —
What India sells here most
By HS chapter, 2025-26. Change is against 2024-25.
What is rising and what is falling
Chapters where India sells at least US$ 5 million. Change from 2024-25 to 2025-26.
↑ High demand
- Vehicles and partsUS$ 19.3 mn → US$ 35.1 mn↑+82%
- Instruments, medical devicesUS$ 3.8 mn → US$ 6.3 mn↑+66.3%
- Gems, jewellery, precious metalsUS$ 16.9 mn → US$ 25.5 mn↑+50.6%
- Inorganic chemicalsUS$ 7.2 mn → US$ 9.2 mn↑+28.2%
- Iron and steelUS$ 5.9 mn → US$ 7.4 mn↑+24.8%
- RubberUS$ 10.2 mn → US$ 12.7 mn↑+24.7%
- Other food preparationsUS$ 10.3 mn → US$ 12.3 mn↑+20%
- Glass and glasswareUS$ 8 mn → US$ 9.6 mn↑+19.6%
↓ Low demand
- Fuels and petroleum productsUS$ 183 mn → US$ 26 mn↓-85.8%
- Paper and paperboardUS$ 18.4 mn → US$ 7.5 mn↓-59.3%
- MachineryUS$ 51.8 mn → US$ 37.4 mn↓-27.7%
- Organic chemicalsUS$ 12.2 mn → US$ 10.2 mn↓-16.5%
Our product guides that sell here
India’s exports of each product to this country, 2025-26.
The 20 biggest export lines
4-digit HS lines, 2025-26, with their Harmonized System descriptions.
What India buys from New Zealand
India’s imports from this country in 2025-26 by HS chapter, from TradeStat — this country can be your supplier too.
- India’s imports, 2025-26
- US$ 589 mn US$ 587 mn → US$ 589 mn
- India’s exports, 2025-26
- US$ 567 mn
- Trade balance
- −US$ 22.6 mn exports minus imports
- Change in imports
- +0.3%
The country at a glance
- Population
- 5.3 mn 2025
- GDP
- US$ 264.1 bn 2025
- GDP per person
- US$ 49,591 2025
- Imports (goods and services)
- US$ 67.9 bn 2024
Sources: TradeStat — Export Import Data Bank, Department of Commerce · World Bank — World Development Indicators · Figures taken 29 October 2026.
What to send to New Zealand
All products →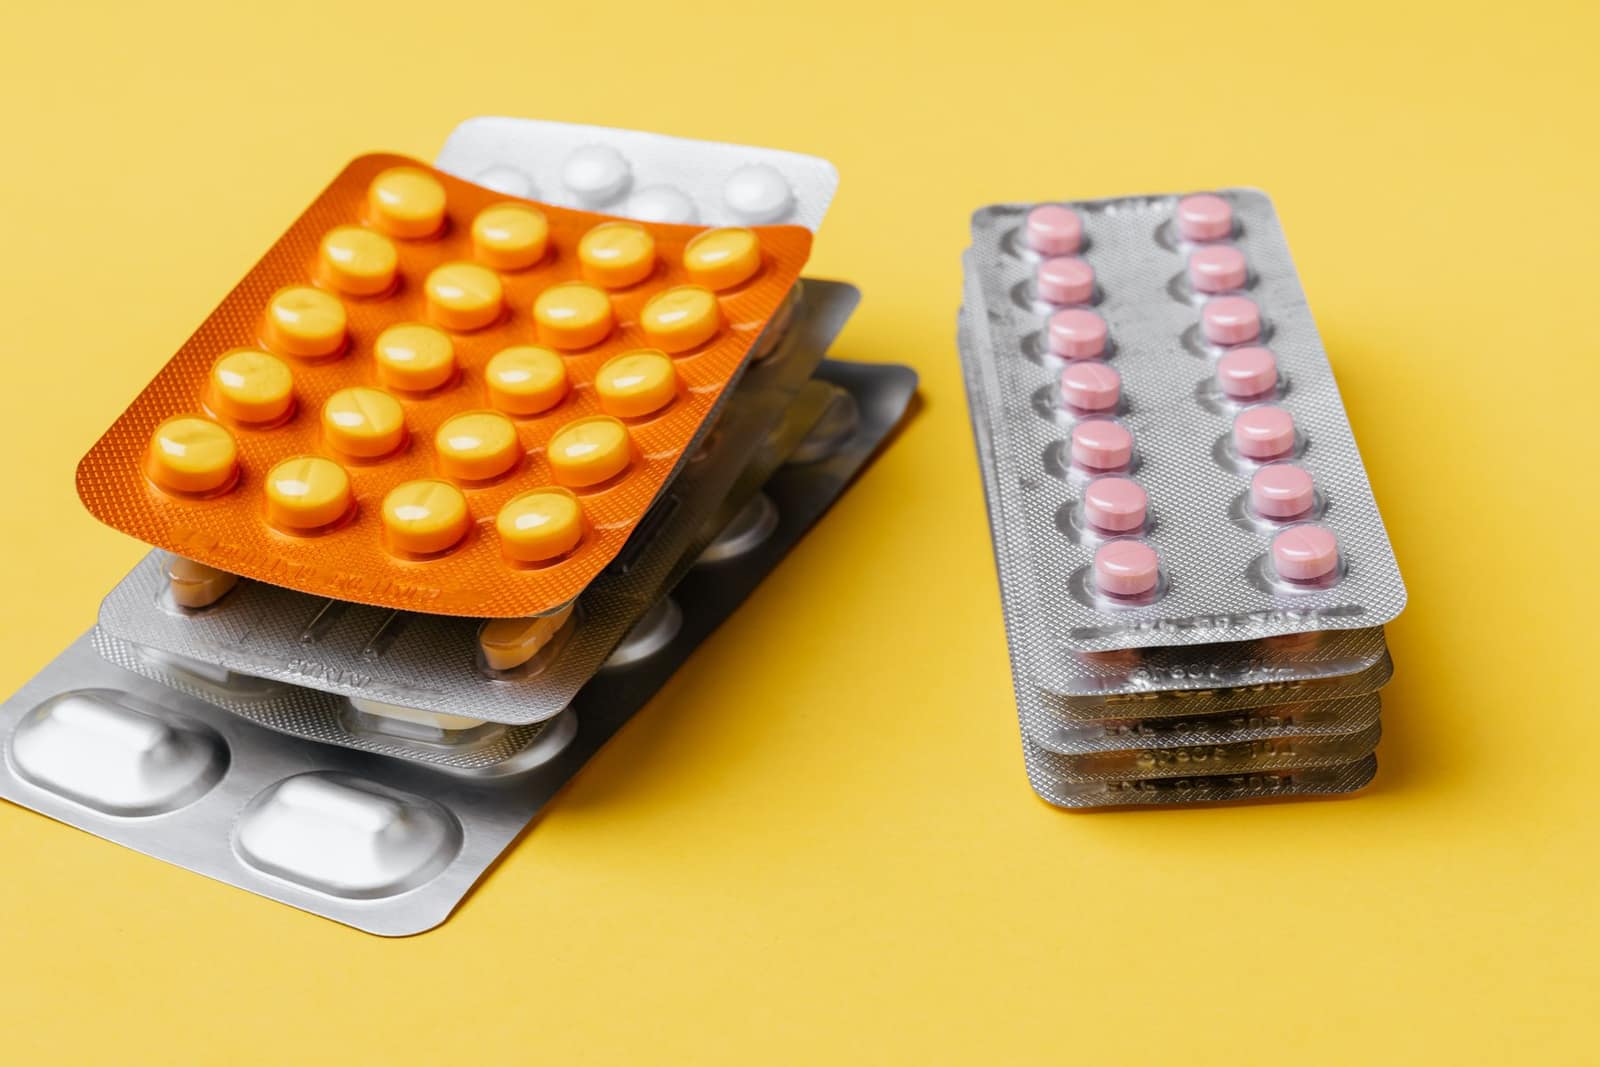 Free to exportPharma & chemicalsGeneric medicines (formulations)Tablets, capsules and injectables; every market needs product registration. The USA buys the most.HS3004Exports 2025-26US$ 21.9 bn ↓0.7%
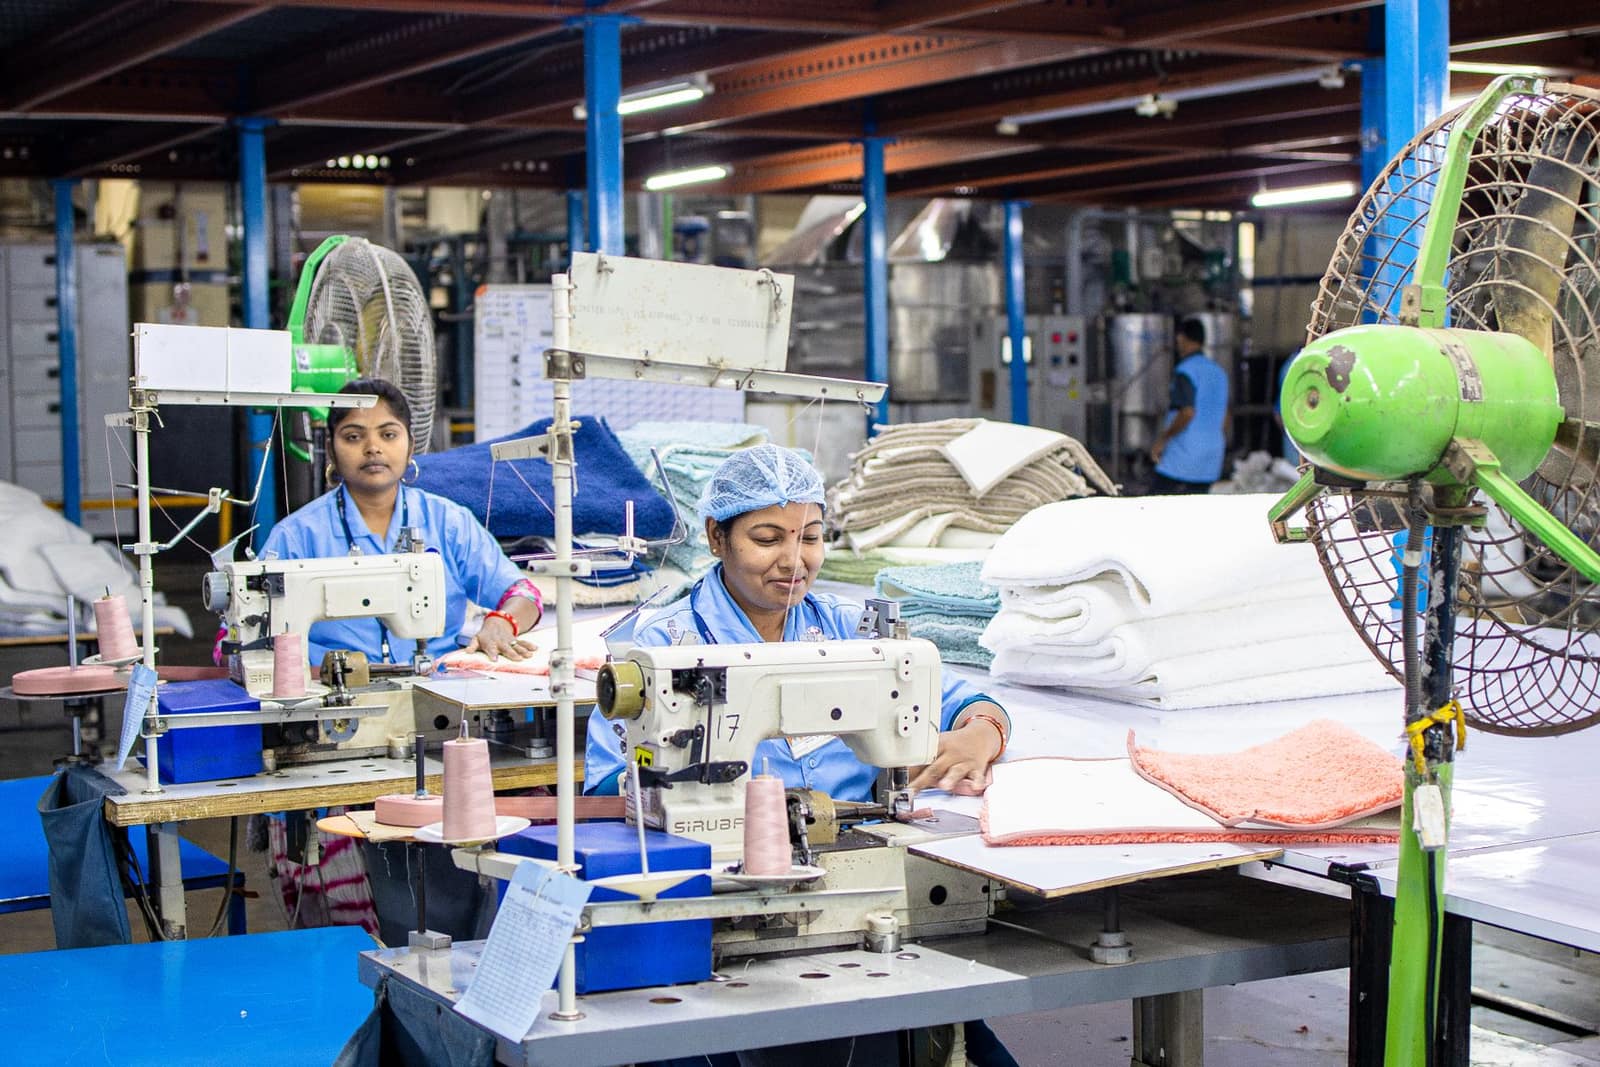 Free to exportTextiles & apparelReadymade garmentsKnitted and woven clothing for brands and retailers; the USA, UK, UAE and the EU are the big buyers.HS6109.10Exports 2025-26US$ 15.8 bn ↓1.2%
 Free to exportTextiles & apparelHome textiles (bed, bath and kitchen linen)Bedsheets, towels and kitchen linen for retailers; the USA buys more than half of India's exports.HS6302Exports 2025-26US$ 2.01 bn ↓5.7%
 Free to exportLeather & footwearFootwearLeather shoes, sandals and boots from Agra, Kanpur and Tamil Nadu; the USA, UK and Germany lead.HS6403Exports 2025-26US$ 1.69 bn ↓4.7%
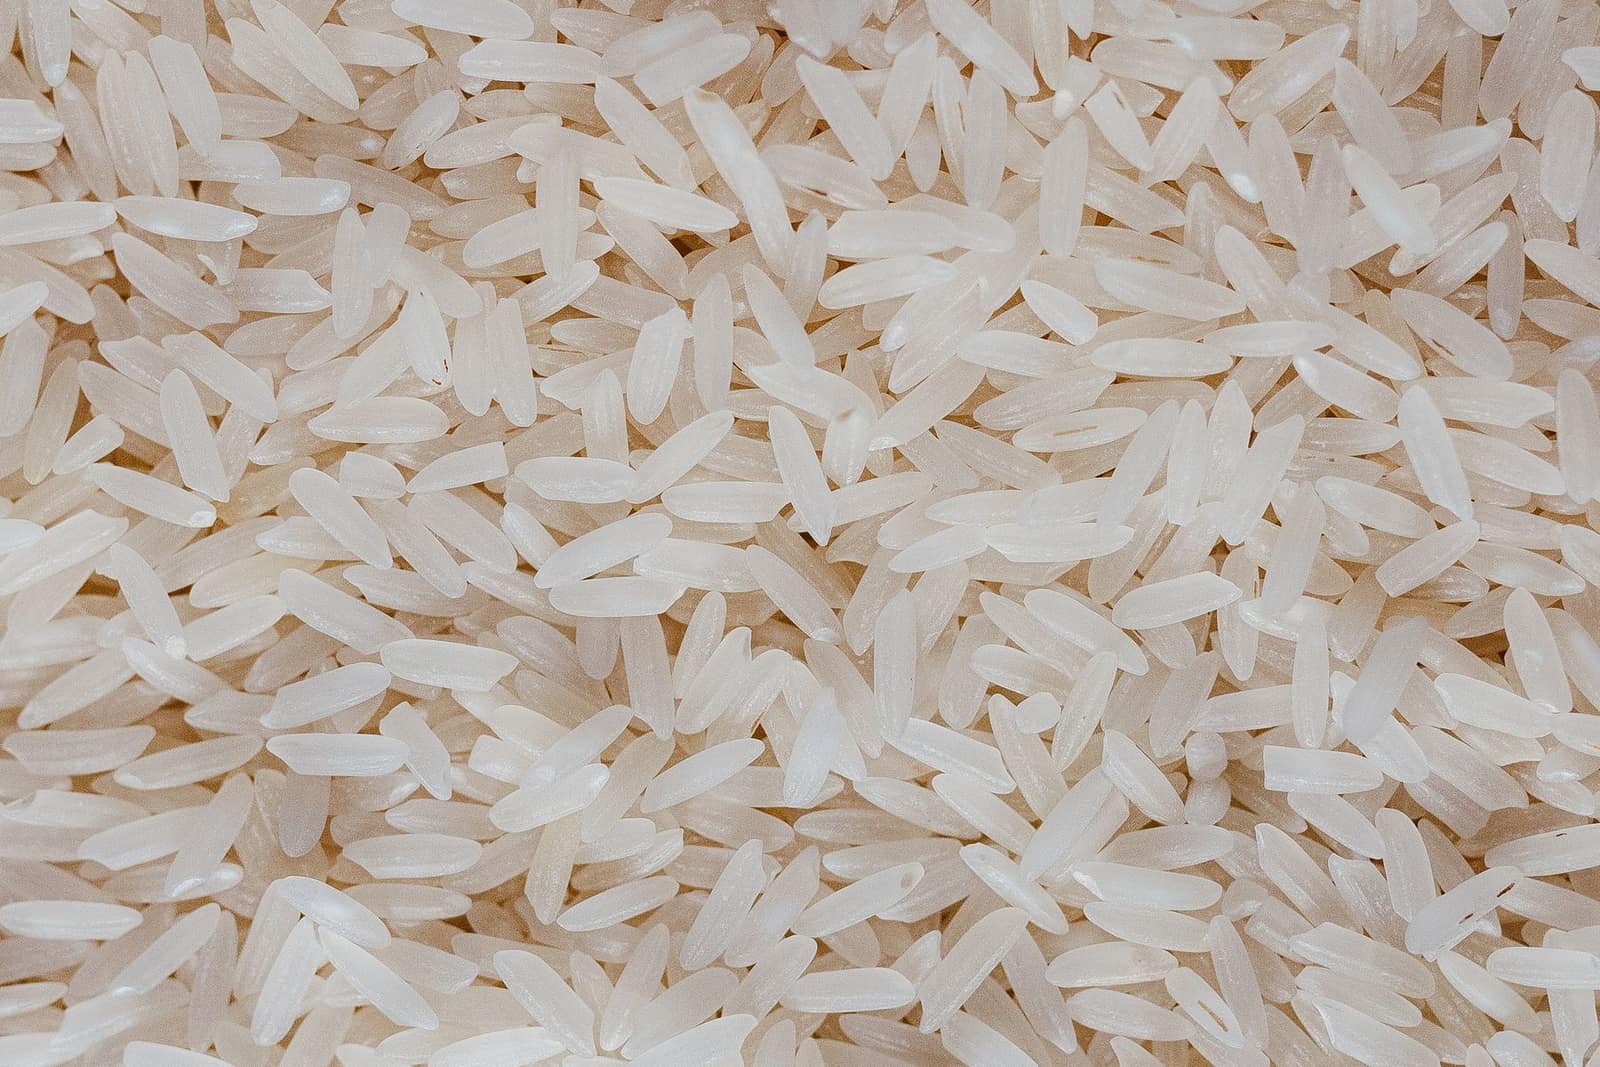 Free, with conditionsFarm produceBasmati riceIndia’s top agri export by value. Free to export, but every contract must be registered with APEDA first.HS1006.30Exports 2025-26US$ 5.67 bn ↓4.6%
 Free to exportFarm produceSpicesWhole, ground and blended spices. Spices Board registration (CRES) is compulsory; residue and ethylene oxide tests keep buyers.HS0904–0910Exports 2025-26US$ 3.12 bn ↓5.1%
 Free to exportProcessed foodProcessed foodSnacks, pickles, ready-to-eat meals, sauces, biscuits and mixes. FSSAI licence plus the buyer country’s labelling and registration rules.HS19–21Exports 2025-26US$ 4.19 bn ↑8.9%
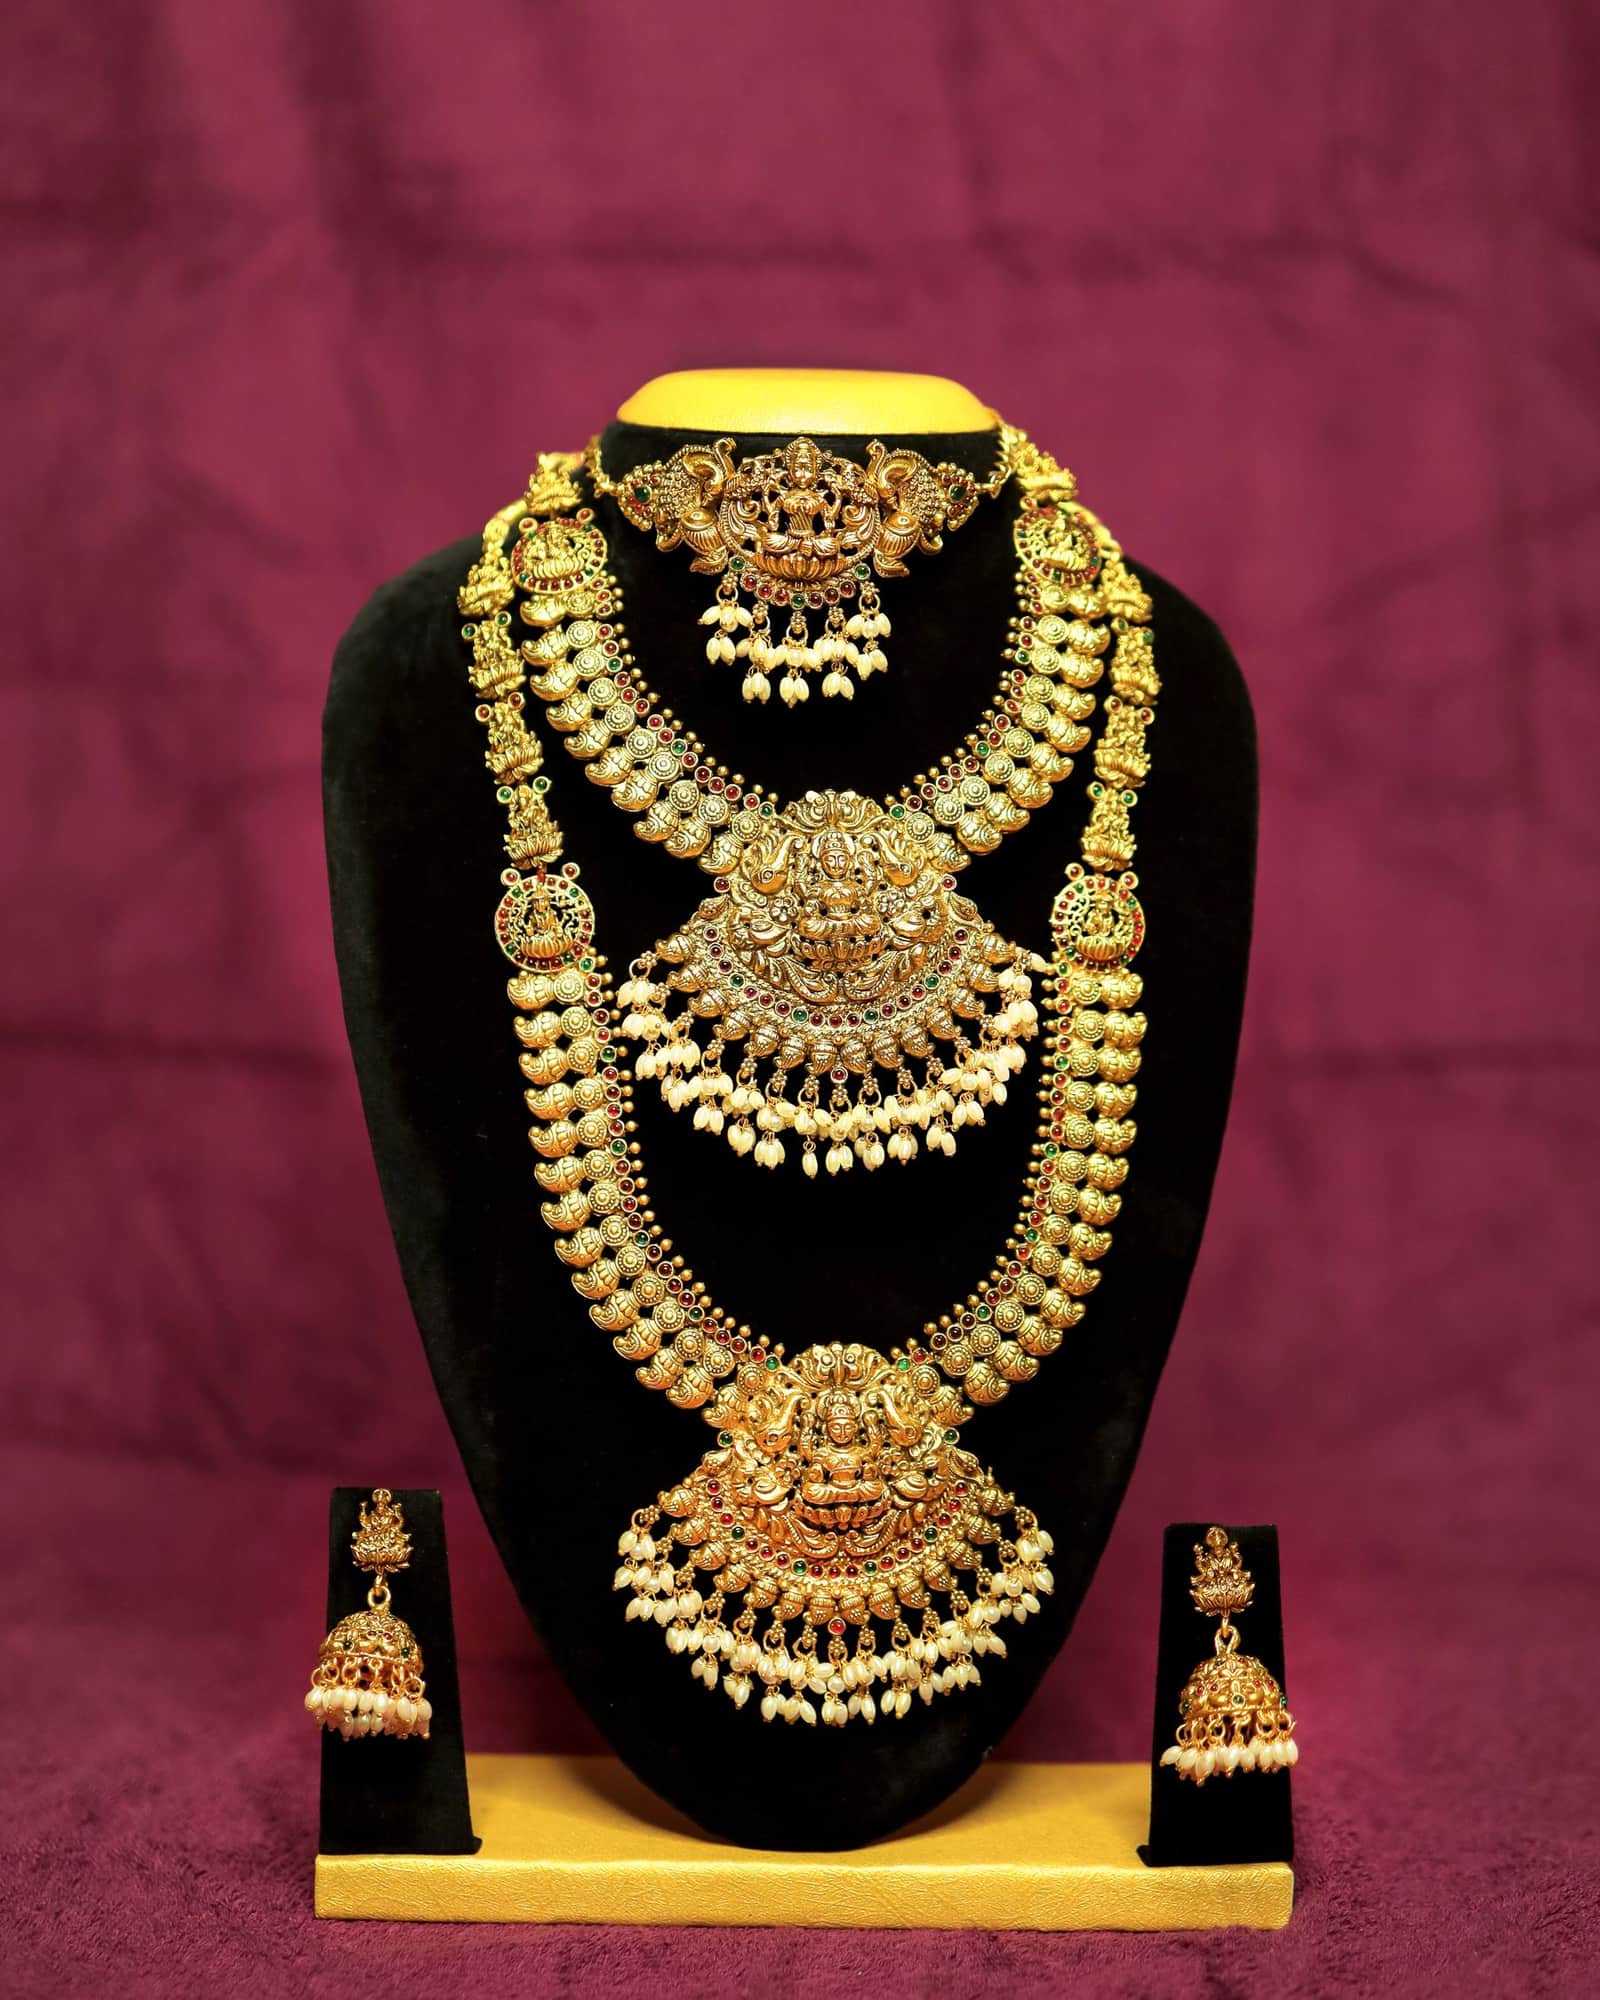 Free, with conditionsJewelleryGold jewelleryPlain and studded gold jewellery; the UAE buys about half, followed by the USA.HS7113.19Exports 2025-26US$ 11.6 bn ↑0.5%