


Consumer goods
Import ceramic sanitaryware
10% BCD, SWS on top and 18% IGST. Breakage in transit and quality checks matter more than paperwork.
- Basic customs duty
- 10% 10%
- Social welfare surcharge
- 10% of BCD
- IGST
- 18% 18%
- India’s imports, 2025-26
- US$ 80.8 mn from 29 countries
The CBIC tariff shows 10% for 6910 10 00 (porcelain or china) and 6910 90 00 (other). Budget 2026–27 made no change to chapter 69. IGST is 18% (Schedule II entry for ceramic sinks, wash basins and similar fixtures, Notification 9/2025-Integrated Tax (Rate)). Taps and metal fittings are classified separately (heading 8481), as are plastic seats and cisterns. CBIC — Customs Tariff (as on 30.06.2025), import tariff by chapter ↗
What is imported
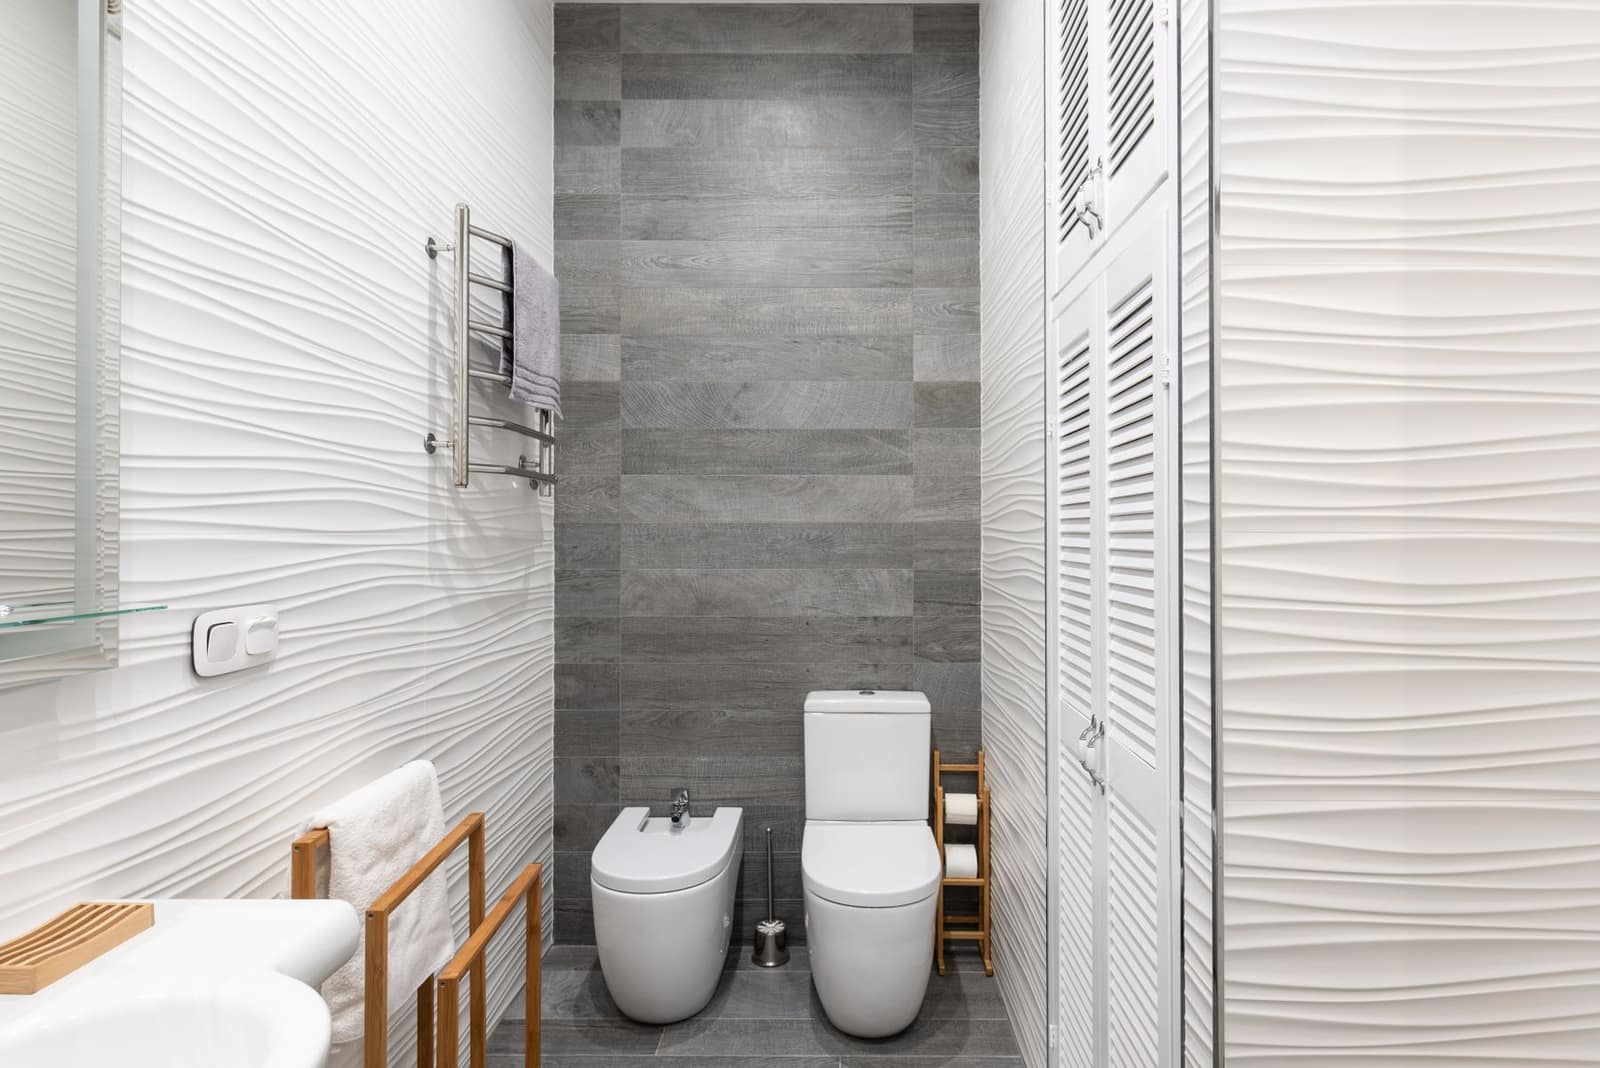
Wash basins, wall-hung and one-piece toilets, urinals and bath fixtures are imported by bath-fitting brands, builders and tile and sanitary dealers. China is the main source of imported designer ware. India also has a large domestic sanitaryware industry, so imports usually compete on design rather than price.
Free under ITC(HS). Check the BIS list for any Quality Control Order on sanitary appliances before ordering.
Licences and registrations you need
- BIS (QCO check)Check the BIS list of products under compulsory certification for sanitary appliances and fittings at the time of import.bis.gov.in ↗
- Legal Metrology and CPCB EPRRetail-packed items need Legal Metrology declarations; plastic packaging brings EPR registration as an importer.eprplastic.cpcb.gov.in ↗
What is checked at the port
- Separate lines on the invoice for ceramic ware, seat covers, cisterns and metal fittings.
- Valuation against similar imports; mixed containers are often examined.
- ISPM-15 marks on wooden pallets and crates.
Practical tips
- Insist on export-grade packing and cover breakage in your marine insurance.
- Check that the outlet type and rough-in distance suit Indian plumbing before ordering a whole container.
Where new importers go wrong
- Declaring the whole set under 6910 when taps and seats belong under other headings.
- Thin glaze or hairline cracks found only after the container is opened — book a pre-shipment inspection.
Sources (6)
- CBIC — Customs Tariff (as on 30.06.2025), import tariff by chapter
- Ministry of Finance (TRU) — explanatory letter on Budget 2026–27 customs changes
- CBIC — Notification 9/2025-Integrated Tax (Rate) dated 17.09.2025
- Bureau of Indian Standards
- CPCB — EPR portal for plastic packaging
- ICEGATE — Customs e-filing portal (tariff and duty lookup)
Import data
Where India buys ceramic sanitaryware
India’s imports from the Department of Commerce’s TradeStat, country by country. US$, financial years.
- Imports, 2025-26
- US$ 80.8 mn
- Change from 2024-25
- ↑+11.1%
- Supplying countries
- 29
- Biggest supplier
- China 74%
Biggest supplying countries
Which sources are growing and shrinking
↑ Growing sources
↓ Shrinking sources
- IndonesiaUS$ 1.7 mn → US$ 920k↓-46.2%
- NetherlandsUS$ 1.1 mn → US$ 780k↓-30.4%
- TürkiyeUS$ 4.4 mn → US$ 3.1 mn↓-28.7%
- ItalyUS$ 3.7 mn → US$ 2.9 mn↓-22.1%
- VietnamUS$ 2.5 mn → US$ 2.2 mn↓-14%
Which forms come in, and at what price
Imports by 8-digit tariff line, 2025-26. Average price = total value ÷ total quantity.
| Tariff line | Value 2025-26 | Change | Quantity | Average price |
|---|---|---|---|---|
Other sanitary fixtures(excluding of porcelain)6910 90 00 | US$ 52.7 mn | ↑+14.9% | 31,919 tonnes | US$ 1.65 per kg |
Sanitary fixtures of porcelain/china6910 10 00 | US$ 28.1 mn | ↑+4.6% | 16,089 tonnes | US$ 1.75 per kg |
Source: TradeStat — Export Import Data Bank, Department of Commerce · Figures taken 29 October 2026.
More in consumer goods
All import guides → Free, with conditionsConsumer goodsToys70% BCD, no SWS, and every toy must carry the BIS mark under the Toys QCO. IGST is 5% for non-electronic toys, 18% for electronic toys.Basic duty70%IGST5–18%India imported 2025-26US$ 95.7 mn
 Free to importConsumer goodsFurniture20% BCD plus 5% AIDC and 18% IGST. The Furniture QCO, 2025 makes BIS certification compulsory for covered items.Basic duty20%IGST5–18%India imported 2025-26US$ 637 mn
 Free to importConsumer goodsCosmetics and skin care20% BCD, SWS and 18% IGST. Every imported cosmetic needs a CDSCO import registration certificate before it arrives.Basic duty20%IGST5–18%India imported 2025-26US$ 484 mn
 Free to importConsumer goodsMedical devices and instrumentsMostly 7.5% BCD and 5% IGST, plus a Health Cess. Every device needs a CDSCO import licence under the Medical Devices Rules, 2017.Basic duty5–7.5%IGST5%India imported 2025-26US$ 3.1 bn