

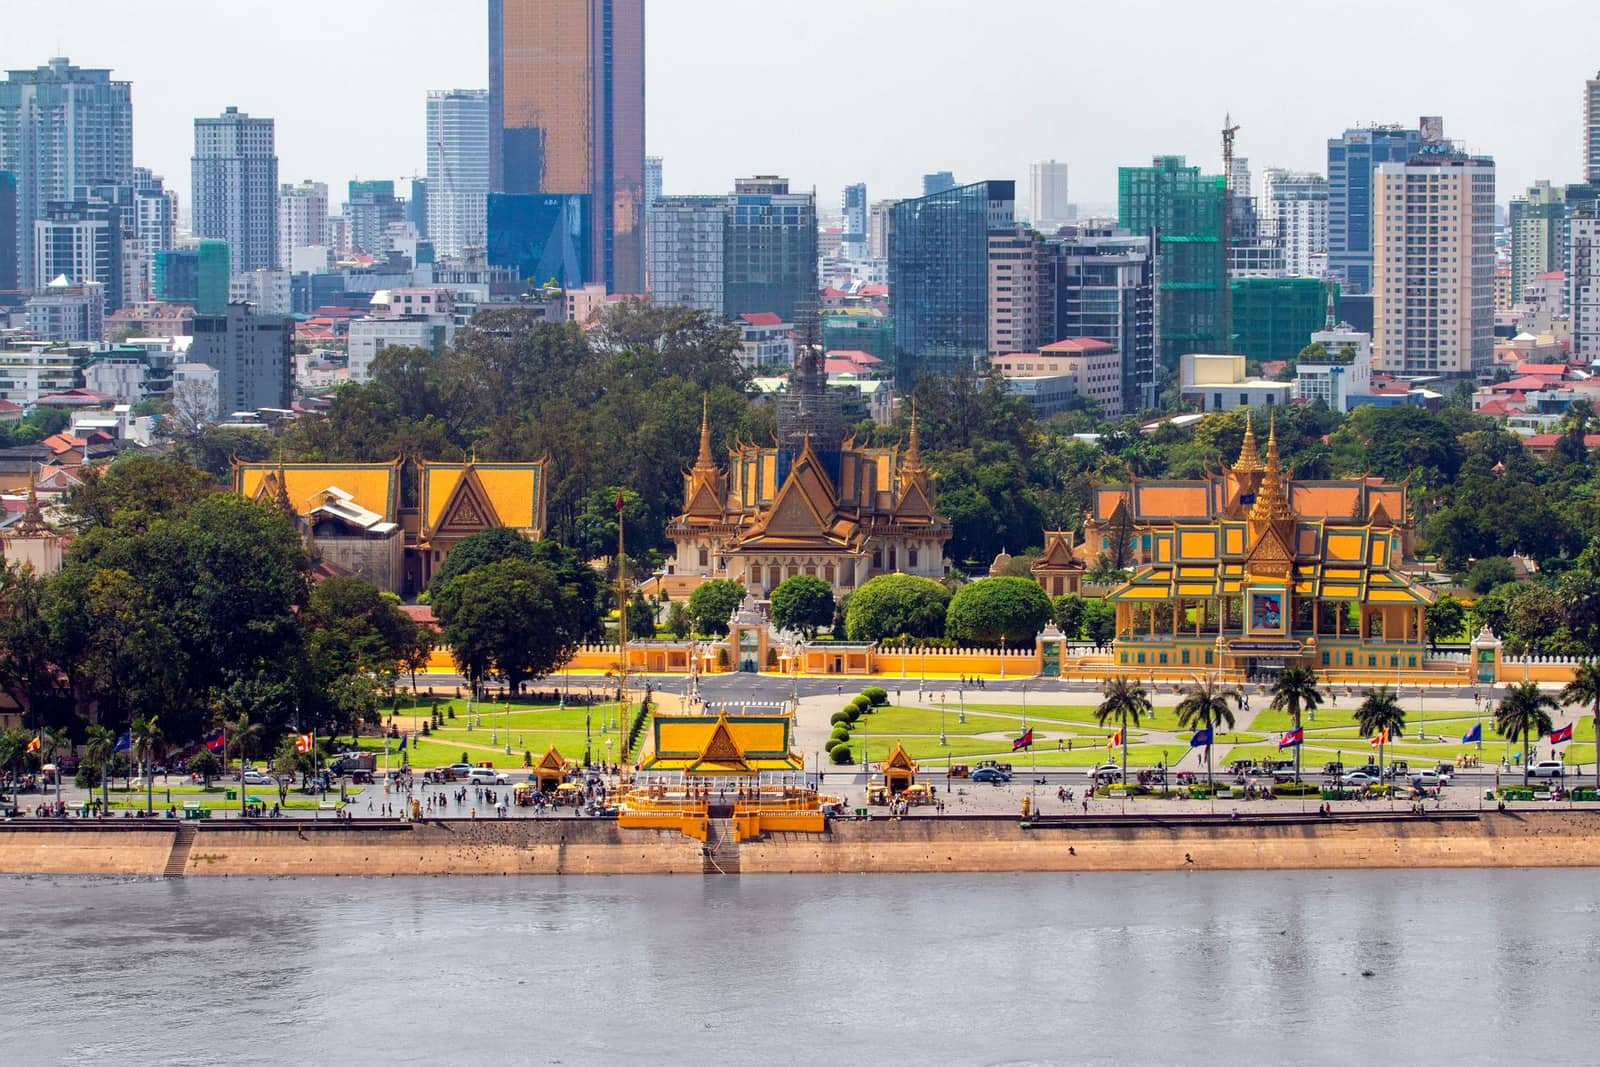
South-East Asia
Export to Cambodia
Small, dollar-using market. Buys Indian medicines, vehicles, meat and garment inputs for its clothing factories.
- Capital
- Phnom Penh
- Currency
- KHR
- Trade agreement with India
- ASEAN–India Trade in Goods Agreement (AITIGA) In force (India applied it from 1 January 2010; member dates vary)
- Main ports
- Sihanoukville Autonomous Port, Phnom Penh Autonomous Port, Techo International Airport (Phnom Penh)
Cambodia is a small but growing market where the US dollar is widely used alongside the riel. Its garment factories import yarn and fabric, and it buys Indian medicines, vehicles, buffalo meat and machinery. Much trade comes in through Sihanoukville or by road from Vietnam and Thailand.

Cambodia is an ASEAN member, so Indian goods on its tariff-reduction lists enter at a lower or zero duty when they carry an AITIGA certificate of origin (Form AI), issued online through DGFT’s certificate-of-origin platform. A review to upgrade AITIGA was still under negotiation in October 2026 (15th Joint Committee, Jakarta). Check the duty for your HS code before quoting a price.
What it buys from India
- Medicines and pharmaceutical products
- Yarn, fabrics and garment accessories
- Vehicles, machinery and buffalo meat
Import rules on their side
- Medicines must be registered with Cambodia’s Ministry of Health (Department of Drugs and Food) through a local importer.
- CamControl, under the Ministry of Commerce, checks food and consumer-product safety and labelling at the border.
- Claim AITIGA rates with a Form AI certificate of origin; check the duty for your HS code with the customs department (GDCE).
Practical tips
- Prices and payments are usually in US dollars. Ask for advance payment or an LC from an established bank.
- Garment factories are often foreign-owned and order through head offices in other Asian countries; find out who decides the purchase.
- Order sizes are small; consolidated LCL shipments through Singapore or Port Klang are common.
Sources (6)
- Department of Commerce — ASEAN-India Trade in Goods Agreement
- ASEAN Secretariat — ASEAN-India Free Trade Area
- General Department of Customs and Excise of Cambodia
- CamControl — Ministry of Commerce, Cambodia
- Department of Commerce — TradeStat export-import data bank
- Indian Trade Portal (FIEO / Department of Commerce) — market access by country
Trade data
India’s exports to Cambodia in numbers
From the Department of Commerce’s TradeStat (Indian financial years, April–March), the country’s imports from the world from UN Comtrade, and its basics from the World Bank.
- India’s exports here, 2025-26
- US$ 280 mn No. 78 of our 80 countries
- Change from 2024-25
- ↑ +39.4% US$ 201 mn → US$ 280 mn
- Share of all Indian exports
- 0.06%
- Its imports from the world
- —
What India sells here most
By HS chapter, 2025-26. Change is against 2024-25.
What is rising and what is falling
Chapters where India sells at least US$ 5 million. Change from 2024-25 to 2025-26.
↑ High demand
- AluminiumUS$ 33.3 mn → US$ 74.7 mn↑+124.5%
- MachineryUS$ 7.9 mn → US$ 15.9 mn↑+100.3%
- Electrical and electronicsUS$ 6.2 mn → US$ 9 mn↑+44.4%
- MeatUS$ 5.5 mn → US$ 7.9 mn↑+44%
- CottonUS$ 6 mn → US$ 7.4 mn↑+23.9%
- Vehicles and partsUS$ 25 mn → US$ 30.4 mn↑+21.6%
- Medicines and pharmaUS$ 57.5 mn → US$ 65.9 mn↑+14.5%
↓ Low demand
No sizeable chapter falls in this list this year.
Our product guides that sell here
India’s exports of each product to this country, 2025-26.
The 20 biggest export lines
4-digit HS lines, 2025-26, with their Harmonized System descriptions.
What India buys from Cambodia
India’s imports from this country in 2025-26 by HS chapter, from TradeStat — this country can be your supplier too.
- India’s imports, 2025-26
- US$ 127 mn US$ 97.6 mn → US$ 127 mn
- India’s exports, 2025-26
- US$ 280 mn
- Trade balance
- +US$ 154 mn exports minus imports
- Change in imports
- +29.6%
The country at a glance
- Population
- 17.8 mn 2025
- GDP
- US$ 51.3 bn 2025
- GDP per person
- US$ 2,872 2025
- Imports (goods and services)
- US$ 34.6 bn 2025
Sources: TradeStat — Export Import Data Bank, Department of Commerce · World Bank — World Development Indicators · Figures taken 29 October 2026.
What to send to Cambodia
All products →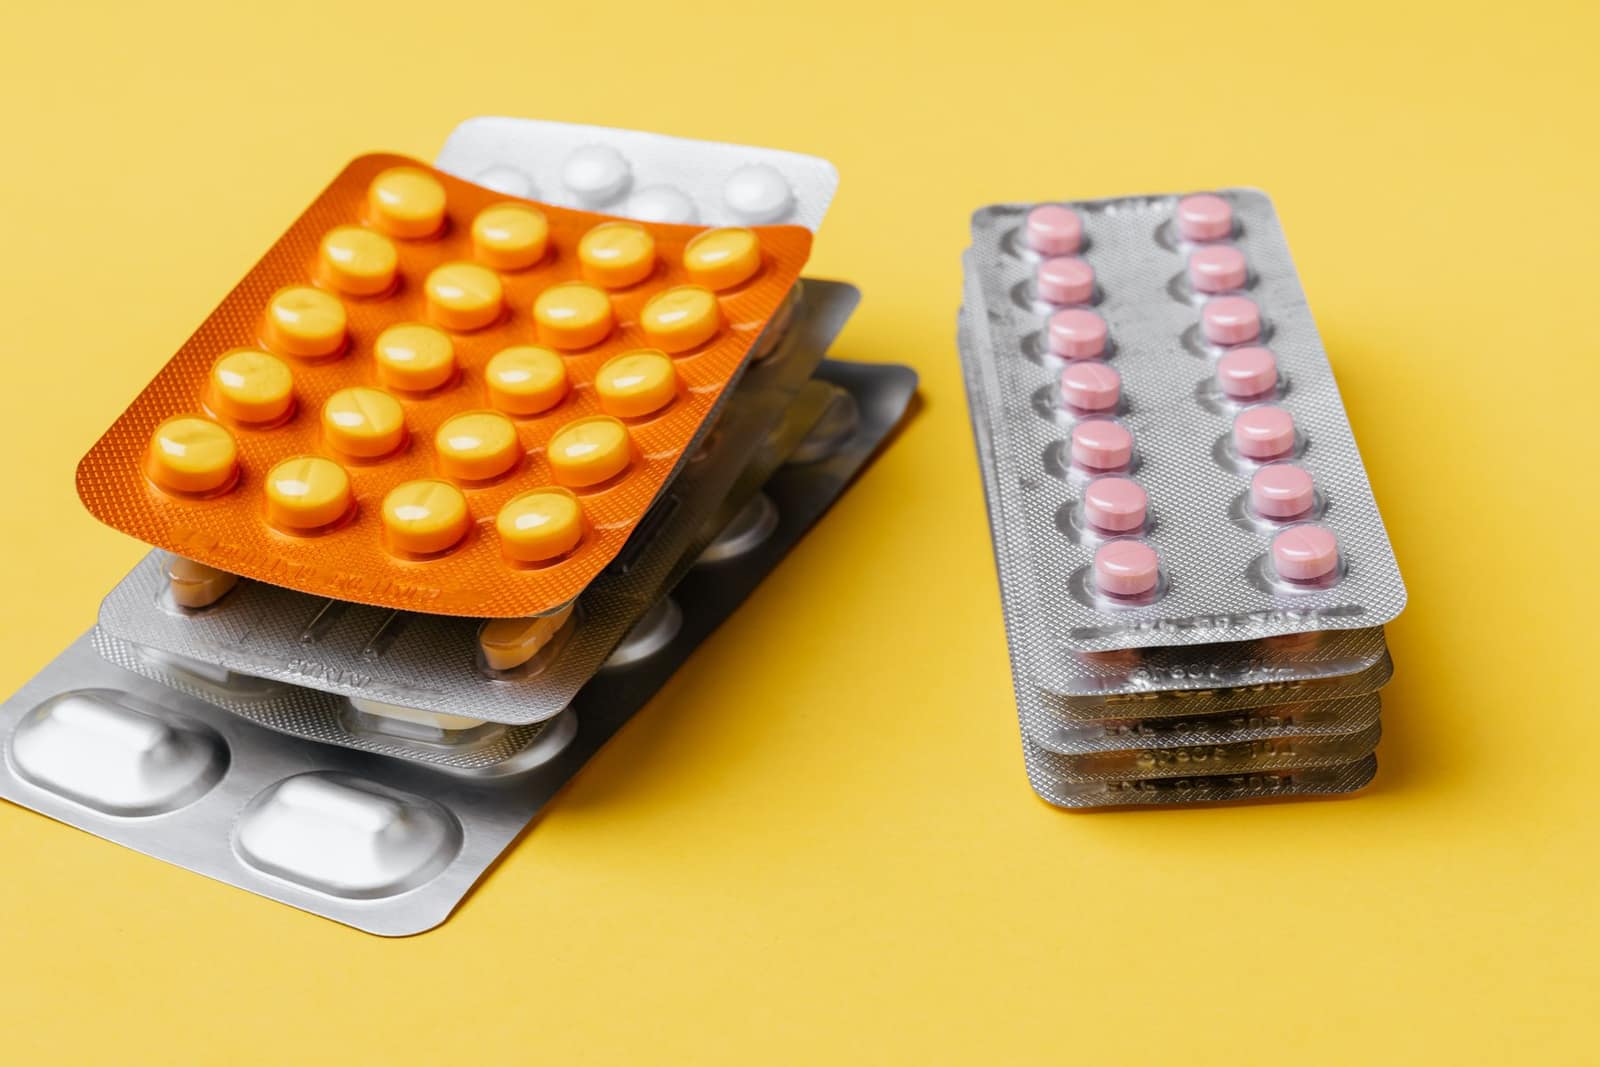 Free to exportPharma & chemicalsGeneric medicines (formulations)Tablets, capsules and injectables; every market needs product registration. The USA buys the most.HS3004Exports 2025-26US$ 21.9 bn ↓0.7%
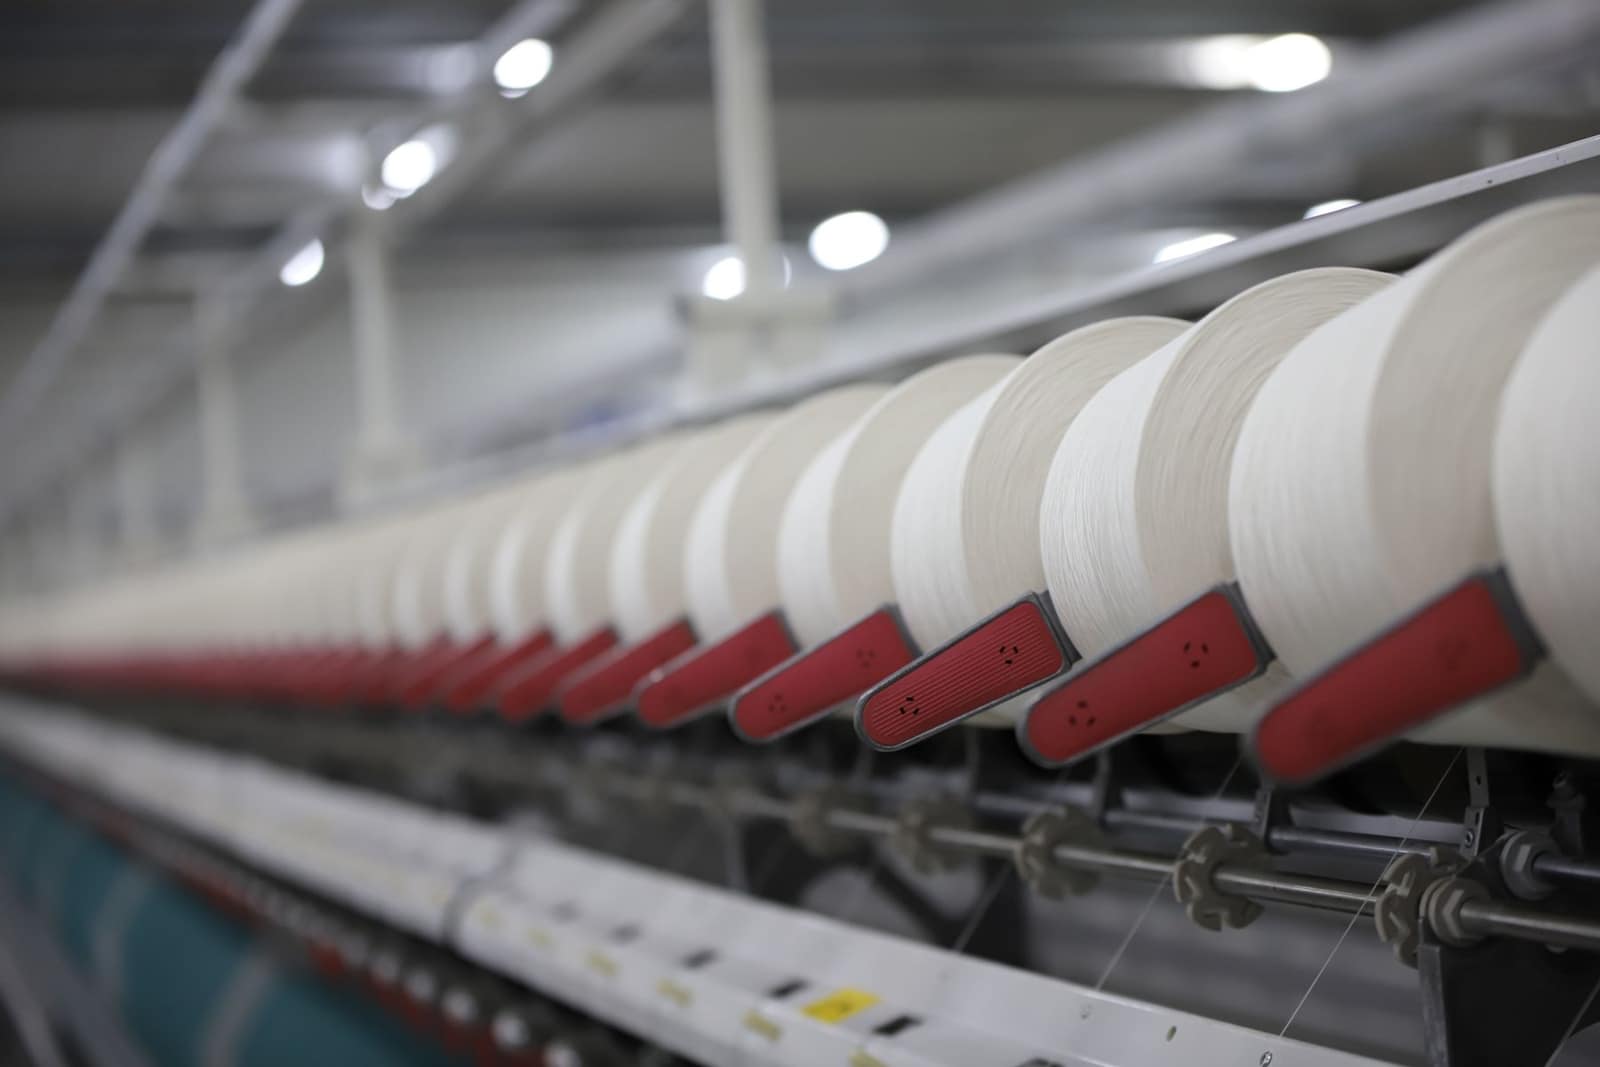 Free to exportTextiles & apparelCotton yarnBulk cotton yarn sold to weaving and knitting mills abroad; Bangladesh is by far the largest buyer.HS5205Exports 2025-26US$ 3.22 bn ↓4.1%
 Free to exportTextiles & apparelCotton woven fabricsGrey and finished cotton fabrics — shirting, sheeting, denim, poplin, voile — for garment and home-textile makers abroad.HS5208Exports 2025-26US$ 2.01 bn ↑2.7%
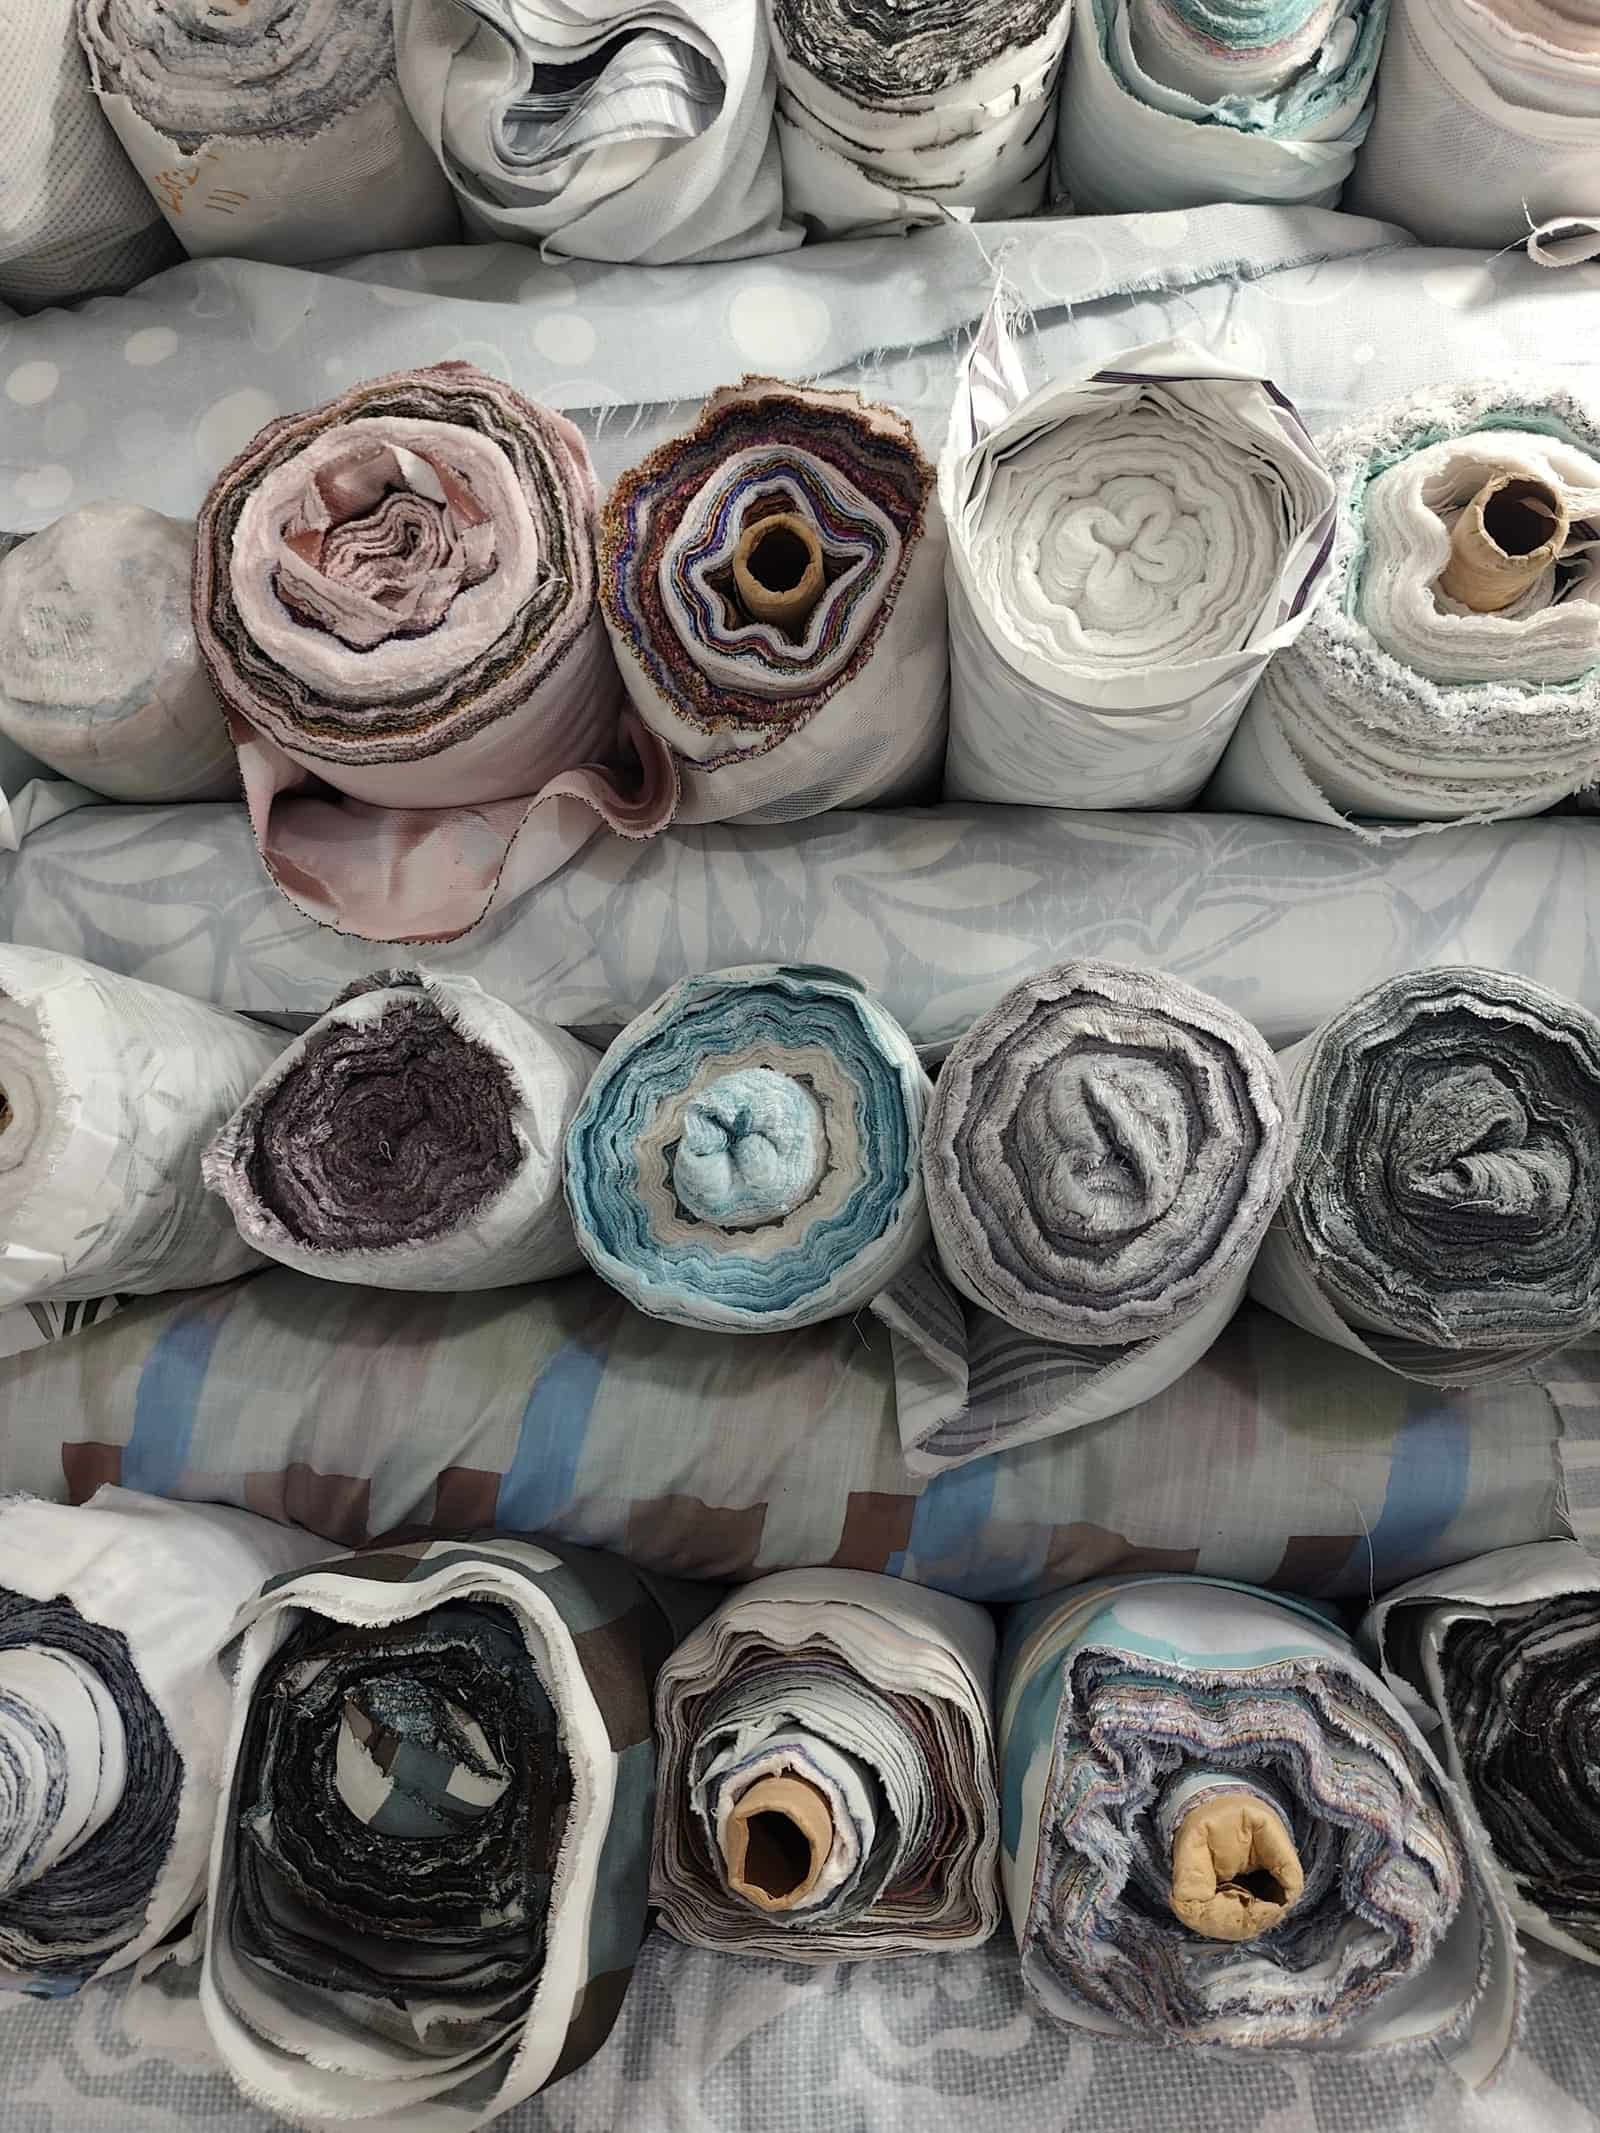 Free to exportTextiles & apparelSynthetic and viscose fabricsPolyester, nylon, poly-viscose and viscose fabrics from Surat and Bhilwara — sarees, suiting, dress material and technical cloth.HS5407Exports 2025-26US$ 1.48 bn ↑5.5%
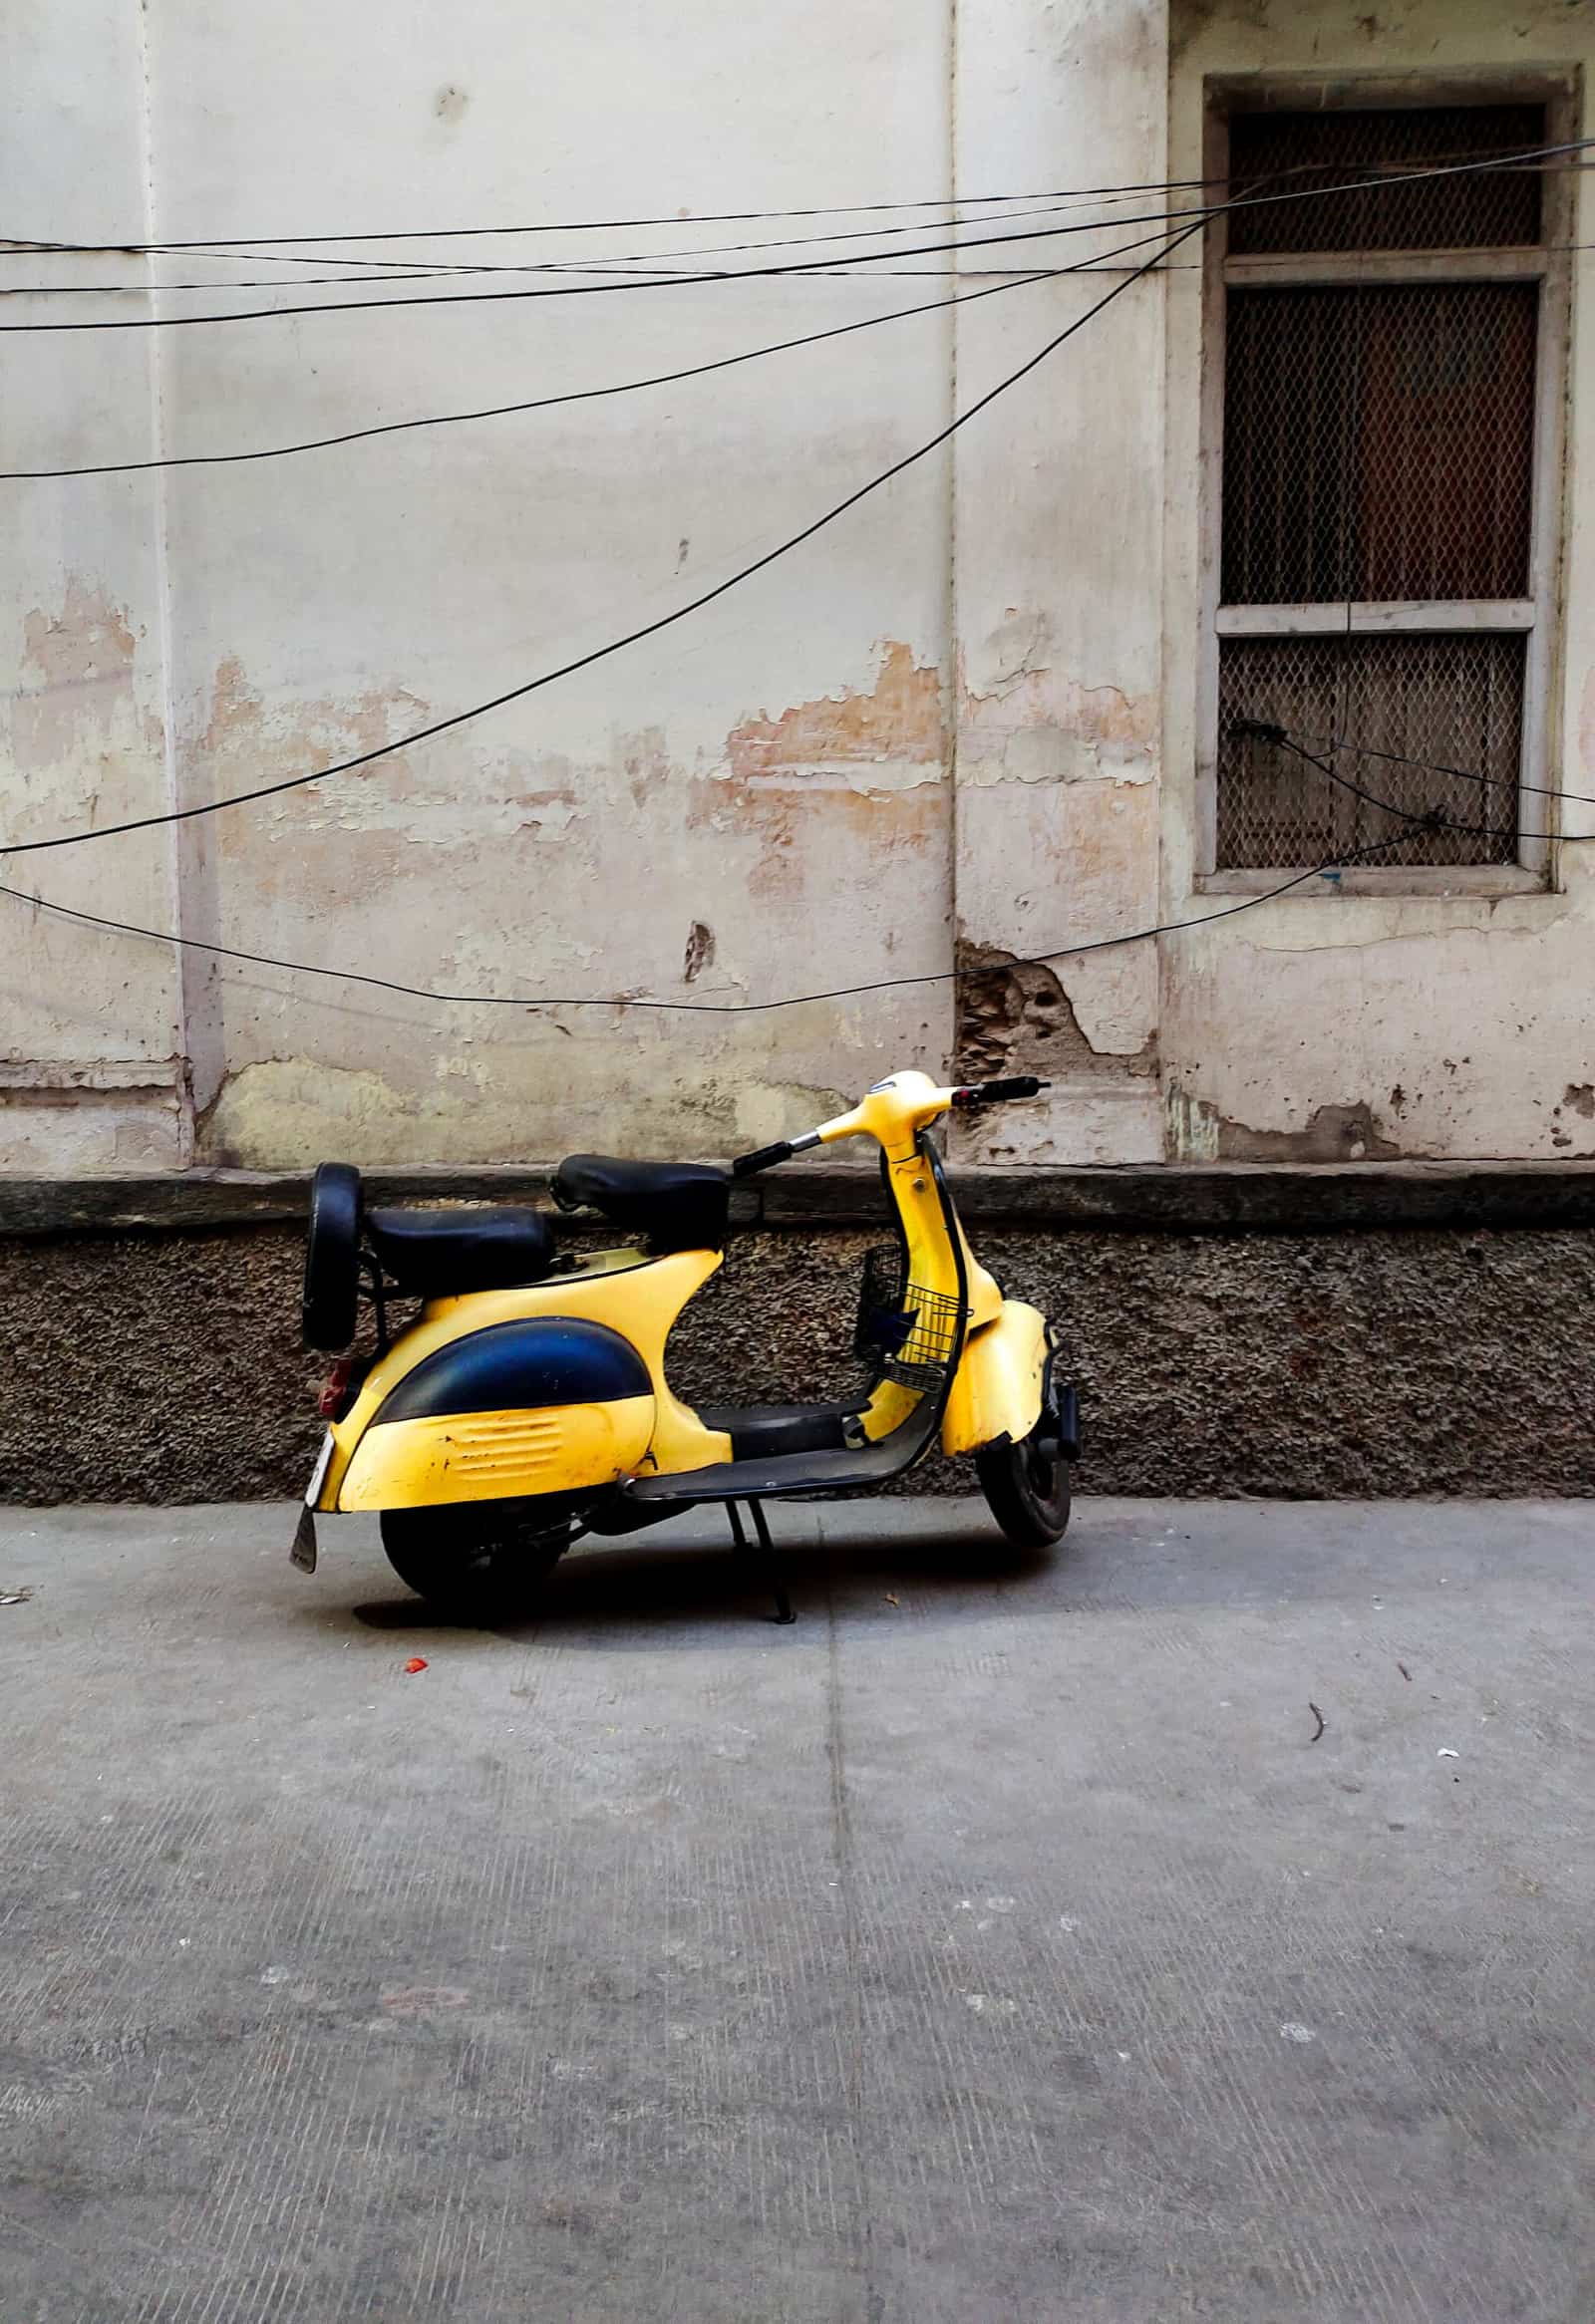 Free to exportEngineering goodsMotorcycles and scootersCommuter motorcycles and scooters for Latin America, Africa and South Asia; India is a top exporter.HS8711Exports 2025-26US$ 3.98 bn ↑24.2%
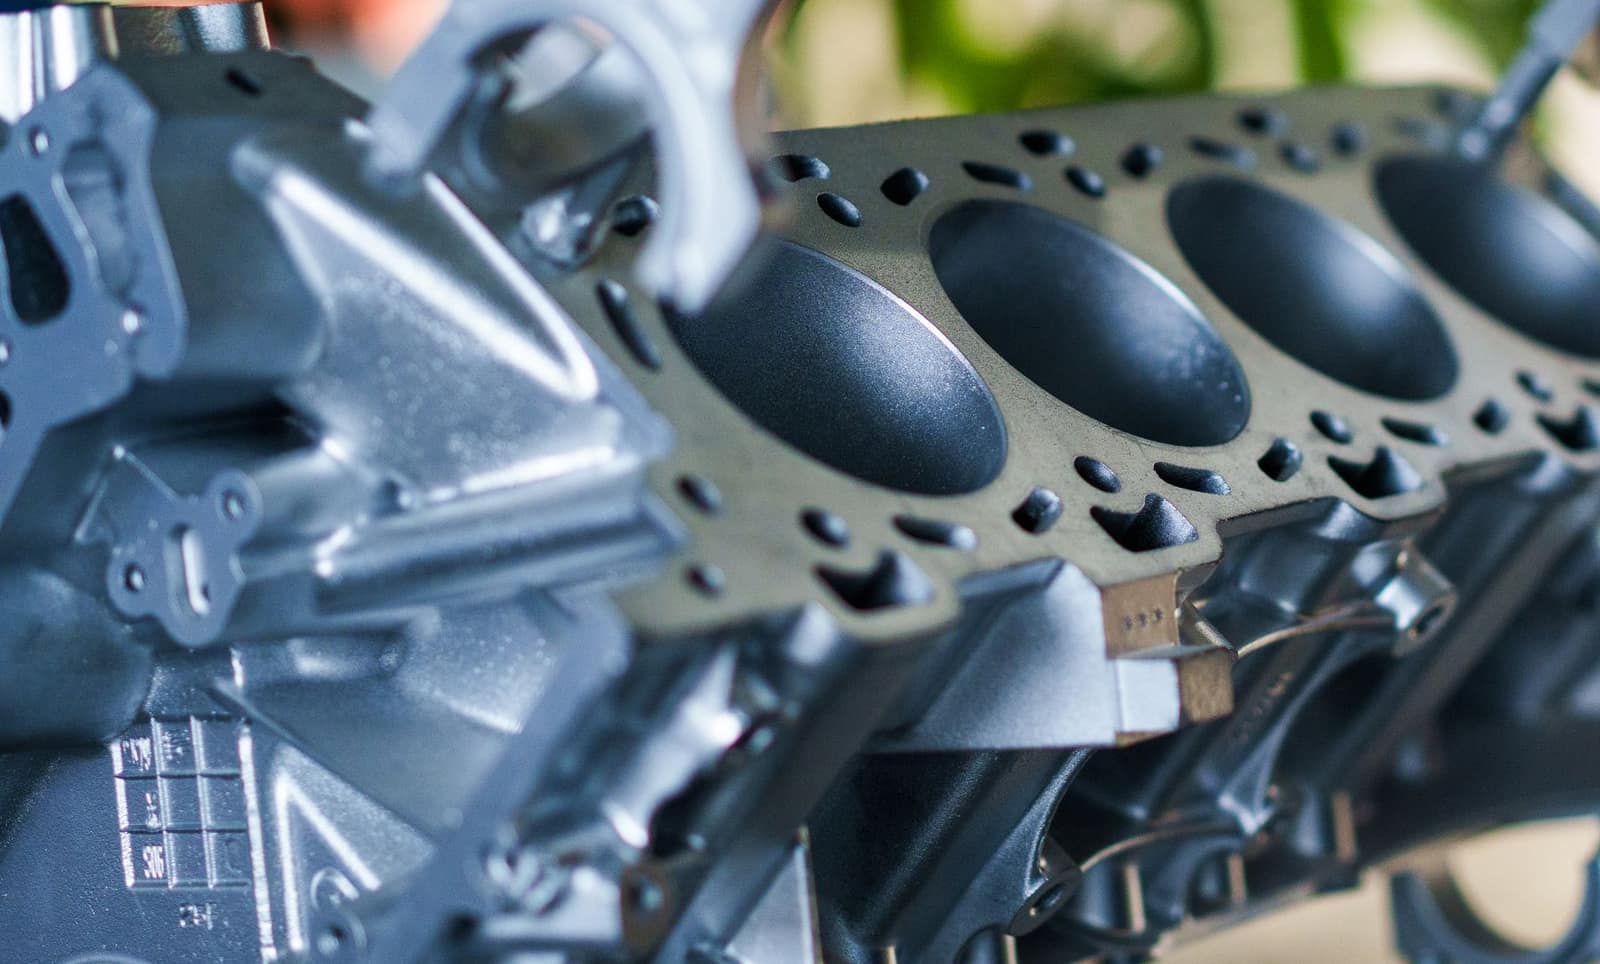 Free to exportEngineering goodsAuto parts and componentsOEM and aftermarket vehicle parts; the USA, Germany and Italy buy most, with strong demand in Latin America.HS8708Exports 2025-26US$ 7.64 bn ↑1.8%
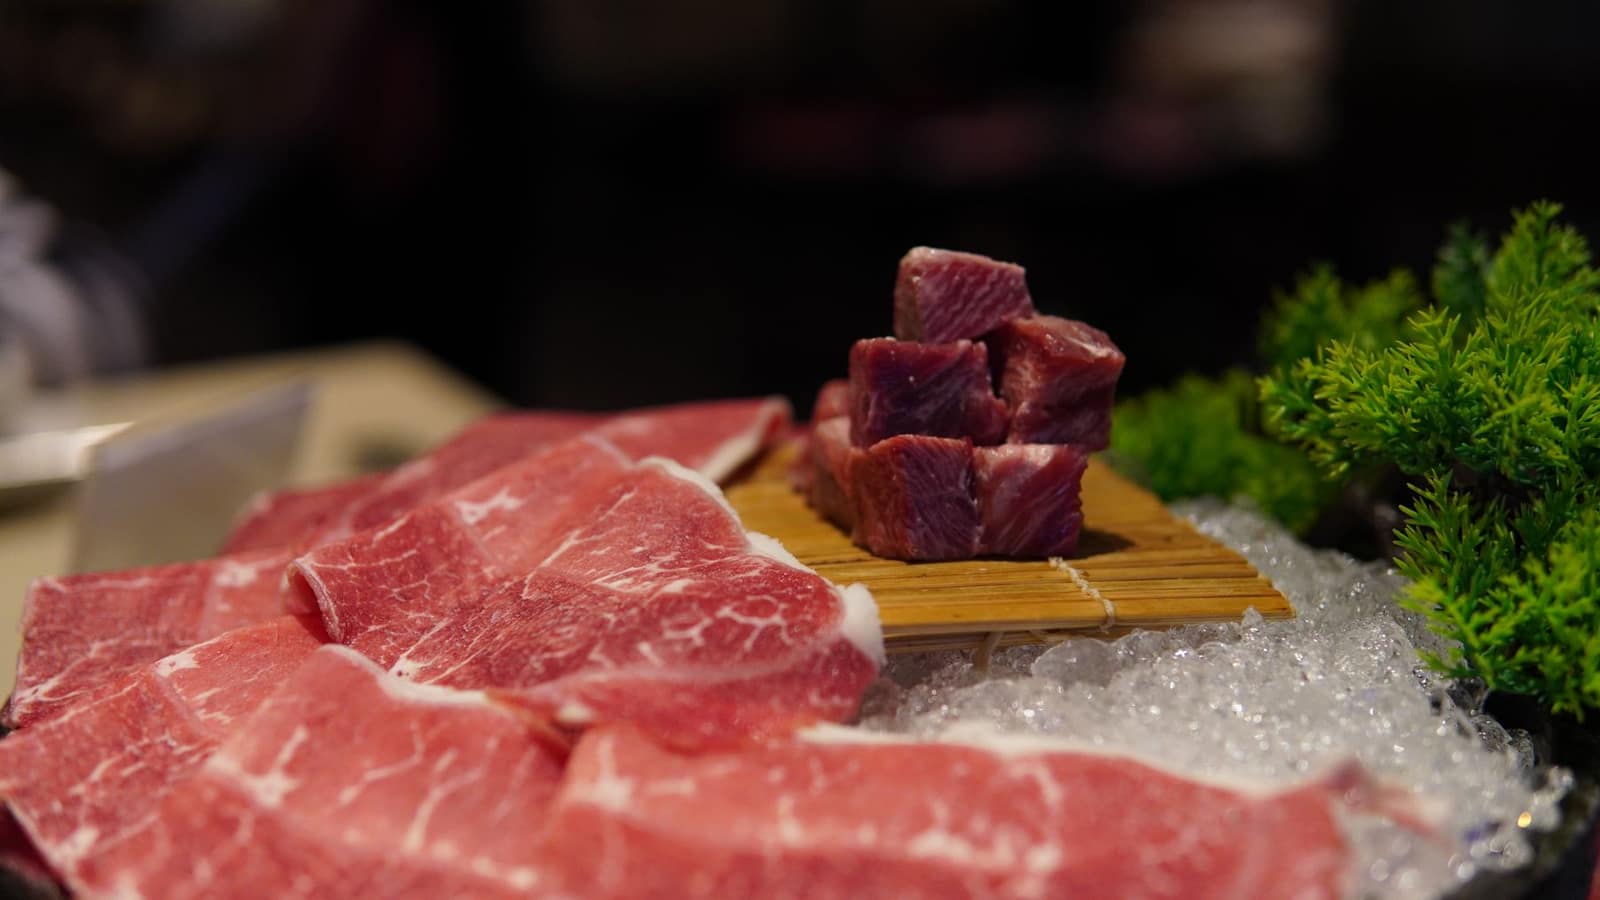 Free, with conditionsProcessed foodBuffalo meat (frozen)India is the world’s largest buffalo meat exporter. Only APEDA-registered plants, halal under i-CAS, and strict veterinary rules.HS0202Exports 2025-26US$ 4.61 bn ↑25.7%
More in South-East Asia
 CECASGDSingaporeSingaporeDuty-free trading hub for South-East Asia. Strict food licensing by SFA; big Indian community.From India 2025-26US$ 11.9 bn
 CECAMYRKuala LumpurMalaysiaMulti-ethnic market with a large Indian-origin community. Halal expectations for food; CECA and AITIGA both apply.From India 2025-26US$ 6.83 bn
 AITIGAVNDHanoiVietnamFast-growing manufacturing economy buying raw materials, yarn, steel, chemicals and feed ingredients from India.From India 2025-26US$ 6.67 bn
 AITIGAIDRJakartaIndonesiaWorld's fourth most populous country. Buys Indian vehicles, steel, chemicals, groundnuts and meat; halal and BPOM rules for food.From India 2025-26US$ 4.49 bn