


Textiles & apparel
Export nonwovens and technical textiles
Spunbond, spunlace and needle-punched nonwovens for hygiene, medical, agro and geotextile uses.
- HS code
- 5603 Nonwovens, whether or not impregnated, coated or laminated (5603): spunbond, meltblown, spunlace and needle-punched fabrics, graded by weight per square metre.
- Export policy
- Free to export Free under ITC(HS) Schedule 2; no licence is needed. Confirm the 8-digit line on the DGFT ITC(HS) search before you ship.
- Registrations
- 3 IEC, GST and those below
- India’s exports, 2025-26
- US$ 196 mn to 102 countries
What is exported
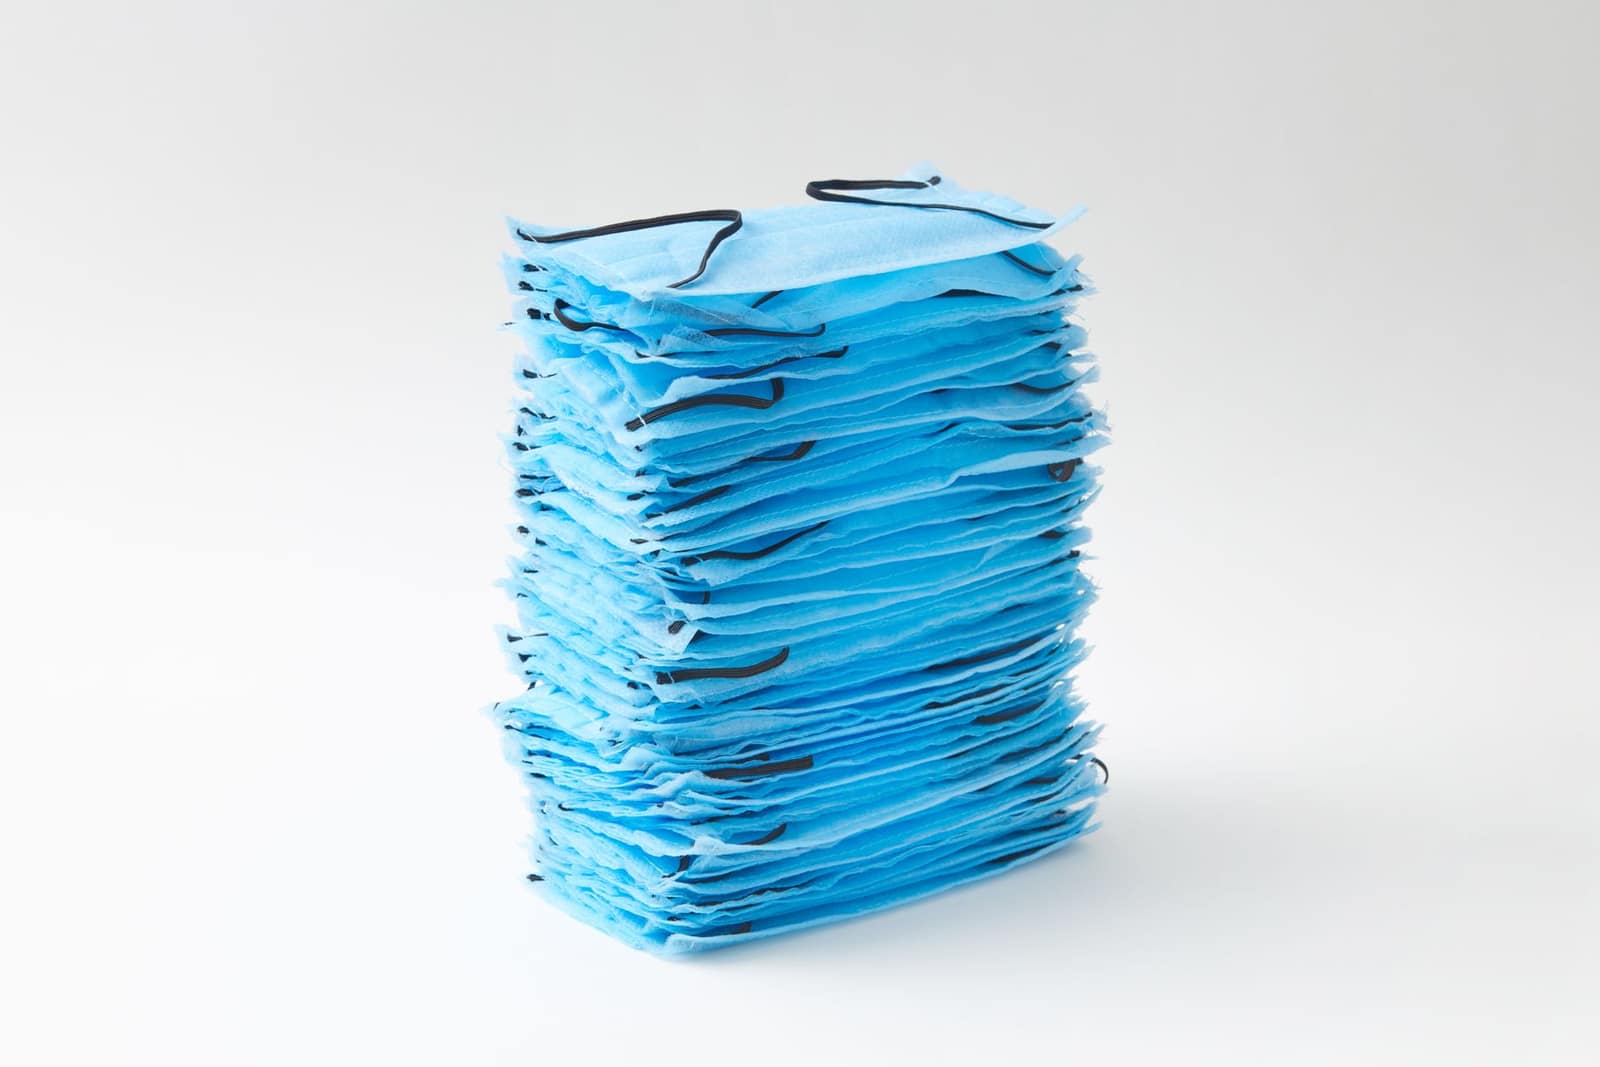
Nonwoven fabric is made by bonding fibres without weaving or knitting. Indian plants in Gujarat, Maharashtra, Tamil Nadu and the north make spunbond polypropylene for bags, masks and crop covers, spunlace for wipes, and needle-punched felts for geotextiles and automotive use. Exports go to the Gulf, Africa, Europe and the USA. Technical textiles are a focus area for the Ministry of Textiles.
Varieties, grades and forms
- Spunbond polypropyleneFor carry bags, crop covers, furniture and disposable medical items.
- SpunlaceFor wet wipes, cosmetic pads and medical dressings.
- Meltblown and SMSFiltration media, masks and surgical gowns.
- Needle-punched felts and geotextilesFor roads, drainage, automotive and carpets.
Where it is grown or made
- GujaratAhmedabad, Vadodara and Surat — spunbond and spunlace lines.
- MaharashtraPune, Mumbai and Nashik.
- Tamil Nadu and KarnatakaCoimbatore and Bengaluru.
- Delhi NCR and PunjabNeedle-punch and automotive felts.
The quality buyers ask for
- Weight
- GSM band as per tariff split: up to 25, 25–70, 70–150, over 150 g/m²
- Strength
- Tensile strength and elongation in machine and cross directions
- Function
- UV stabilisation (crop covers), absorbency (wipes), filtration efficiency (meltblown)
- Standards
- IS 16366 (crop covers), IS 17355 (mulch mats) and other BIS/EN/ISO standards as applicable
Certificates
- RCMCRequiredRegistration with the export promotion council or board for your product (not needed up to ₹3 lakh FOB per consignment since 15 Sep 2026).
- ISO 9001Often askedQuality management system; often asked for by industrial buyers.
- OEKO-TEX STANDARD 100Often askedTests the finished textile for harmful substances; widely asked for by retailers.
- ISO 13485 / CE (medical)Often askedNeeded for nonwovens sold as medical devices or into regulated medical supply chains.
Shipping, storage and shelf life
Palletised rolls in 40-ft or 40-ft high-cube containers; light fabric fills space before weight.
Sea from Mundra, Nhava Sheva and Chennai.
Dry, covered storage away from sunlight (UV degrades polypropylene that is not stabilised).
What goes on the pack and carton
- Fabric and yarn: roll or carton ticket with quality, lot/shade or merge number, length or weight, and “Made in India”.
- Every carton or bag: product, grade, lot or batch number, net and gross weight, exporter name and “Made in India” / “Product of India”, matching the invoice and packing list.
Test at Textiles Committee labs, textile research associations (SITRA, NITRA, BTRA, ATIRA, and the technical-textile centres of excellence they host) or NABL-accredited labs with nonwoven tests in scope (nabl-india.org).
Benefits of exporting this product
- RoDTEP: 1.4% of FOB
Tariff item 5603 11 10 to 5603 94 90 (nonwovens of man-made filaments and other fibres, all weights, including crop covers, mulch mats and geotextiles) earns 1.4% of FOB value, with no rupee cap, as a duty credit scrip on ICEGATE (Appendix 4R). Rates continue to 31 Dec 2026 (DGFT Notification 41/2026-27). Confirm your exact 8-digit line on DGFT before pricing an order.
DGFT — Appendix 4R, RoDTEP schedule for DTA exports w.e.f. 10 Oct 2024 (Notification 32/2024-25) ↗
Where to register
- SRTEPCRCMC from the Synthetic & Rayon Textiles Export Promotion Council for polyester, nylon, viscose and other man-made fibre yarns, fabrics and made-ups.srtepc.org ↗
Quality and checks
- GSM, tensile strength, elongation, air permeability and, for hygiene and medical use, absorbency and biocompatibility tests.
- Product standards where they apply, such as the IS standards for crop covers and geotextiles named in the tariff, or EN standards for medical fabrics in the EU.
Begin with spunbond rolls or crop covers to distributors in the Gulf or East Africa, where Indian suppliers are known. Ship a mixed container of GSMs and colours with test reports for each. Since 15 September 2026, a consignment worth up to ₹3 lakh FOB does not need an RCMC (DGFT Notification 36/2026-27). Registrations that a law requires for the product still apply.
Where new exporters go wrong
- Supplying medical-grade nonwovens without the certification the destination requires.
- GSM below the declared figure — buyers weigh rolls and claim.
Documents this product needs
Schemes that apply
Trade data
Indian nonwovens and technical textiles exports in numbers
From the Department of Commerce’s TradeStat, country by country. US$, Indian financial years (April–March).
- Exports in 2025-26
- US$ 196 mn -1.6% a year on average, 2020-21 to 2025-26
- Change from 2024-25
- ↓ -14.6% US$ 229 mn → US$ 196 mn
- Buyer countries
- 102
- Average export price
- US$ 2.13 per kg · 91,859 tonnes shipped · US$ 2.24 the year before
The price cycle
India’s average export price per kg each year (total value ÷ total quantity). Highest in 2021-22, lowest in 2025-26 — a 18% swing between them. Keep this swing in mind when you quote.
What next: a projection from the trend
The past trend carried forward — not a forecast by any authority. Sudden changes in policy, prices or demand are not in it.
Likely range US$ 154 mn to US$ 259 mn.
- Trend
- +0.6% a year
- Fit (R²)
- 0 — weak, read with care
- Based on
- 6 years of official figures
Method: a straight line through the logarithm of yearly exports (log-linear regression); range = ±1 standard error.
Biggest buyer countries
By value in 2025-26. Change is against 2024-25.
Where demand is rising and falling
Only countries that buy at least US$ 1 million or 1% of India’s exports of this product. Change from 2024-25 to 2025-26.
↑ High demand
↓ Low demand
- CzechiaUS$ 2.7 mn → US$ 90k↓-96.7%
- IsraelUS$ 4.5 mn → US$ 1.3 mn↓-71.4%
- United States of AmericaUS$ 124 mn → US$ 78.1 mn↓-36.9%
- New ZealandUS$ 3.1 mn → US$ 2 mn↓-34.3%
Which forms sell, and at what price
India’s exports by 8-digit tariff line, 2025-26. Average price = total value ÷ total quantity (TradeStat): the average of every shipment on that line, not the price of any one deal.
| Tariff line | Value 2025-26 | Change | Quantity | Average price |
|---|---|---|---|---|
Man-made filmnt wghng>25g /sqm5603 12 00 · Nonwovens, whether or not impregnated, coated, covered or laminated, of man-made filaments, | US$ 71.9 mn | ↓-22.8% | 35,044 tonnes | US$ 2.05 per kgwas US$ 2.14 |
Man-made filmnt wghng >150g/sqm5603 14 00 · Nonwovens, whether or not impregnated, coated, covered or laminated, of man-made filaments, | US$ 28.8 mn | ↓-11.5% | 9,830 tonnes | US$ 2.93 per kgwas US$ 2.95 |
Man-made filmnt wghng<25g/sqm-others5603 11 90 · Nonwovens, whether or not impregnated, coated, covered or laminated, of man-made filaments, | US$ 27.5 mn | ↓-8% | 14,566 tonnes | US$ 1.89 per kgwas US$ 1.90 |
Man-made filmnt wghng betwn 70g/sqm and 150g/sqm5603 13 00 · Nonwovens, whether or not impregnated, coated, covered or laminated, of man-made filaments, | US$ 26.4 mn | ↓-33% | 13,505 tonnes | US$ 1.96 per kgwas US$ 2.31 |
Other filmnt wghng >150g/sqm-other5603 94 90 · Nonwovens, whether or not impregnated, coated, covered or laminated, not of man-made filaments, | US$ 11.1 mn | ↑+24.6% | 3,641 tonnes | US$ 3.06 per kgwas US$ 3.36 |
Other filmnt wghng betwn 25g/sqm and 70g/sqm5603 92 00 · Nonwovens, whether or not impregnated, coated, covered or laminated, not of man-made filaments, | US$ 10.6 mn | ↑+77.1% | 5,530 tonnes | US$ 1.91 per kgwas US$ 2.26 |
Other filmnt wghng <25g/sqm5603 91 00 · Nonwovens, whether or not impregnated, coated, covered or laminated, not of man-made filaments, | US$ 9.3 mn | ↓-2.6% | 4,381 tonnes | US$ 2.12 per kgwas US$ 2.11 |
Other filmnt wghng betwn 70g/sqm and 150g/sqm - others5603 93 90 · Nonwovens, whether or not impregnated, coated, covered or laminated, not of man-made filaments, | US$ 4.6 mn | ↓-14.6% | 2,148 tonnes | US$ 2.15 per kgwas US$ 1.96 |
Other filmnt wghng >150g/sqm-non-woven geotextile and articles5603 94 10 · Nonwovens, whether or not impregnated, coated, covered or laminated, not of man-made filaments, | US$ 3.5 mn | ↑+40.2% | 1,992 tonnes | US$ 1.75 per kgwas US$ 1.80 |
Other filmnt wghng betwn 70g/sqm and 150g/sqm - mulch mats, conforming to is 173555603 93 10 · Nonwovens, whether or not impregnated, coated, covered or laminated, not of man-made filaments, | US$ 1.1 mn | ↓-5.4% | 634 tonnes | US$ 1.66 per kgwas US$ 1.70 |
Man-made filmnt wghng<25g/sqm-crop covers, confirming to is 167185603 11 10 · Nonwovens, whether or not impregnated, coated, covered or laminated, of man-made filaments, | US$ 930k | ↑+55% | 589 tonnes | US$ 1.58 per kgwas US$ 1.72 |
The world market
Each country’s own recorded exports and imports in UN Comtrade, 2023 (the latest year nearly every country has reported).
- World imports
- US$ 16.1 bn 2023
- India among exporters
- #21 of 124 countries
- India’s share of world exports
- 1% US$ 175 mn
- Left for others to win
- US$ 17 bn exported by other countries
Top exporters — your competitors
- 1ChinaUS$ 3.8 bn 22.1%
- 2GermanyUS$ 2.03 bn 11.8%
- 3USAUS$ 1.94 bn 11.3%
- 4ItalyUS$ 1.28 bn 7.5%
- 5JapanUS$ 869 mn 5.1%
- 6TürkiyeUS$ 666 mn 3.9%
- 7FranceUS$ 508 mn 3%
- 8NetherlandsUS$ 450 mn 2.6%
- 9LuxembourgUS$ 420 mn 2.4%
- 10CzechiaUS$ 404 mn 2.3%
Biggest buyers in the world
- 1USAUS$ 1.82 bn 11.3%
- 2GermanyUS$ 1.25 bn 7.8%
- 3ChinaUS$ 820 mn 5.1%
- 4JapanUS$ 752 mn 4.7%
- 5Viet NamUS$ 620 mn 3.9%
- 6ItalyUS$ 608 mn 3.8%
- 7United KingdomUS$ 568 mn 3.5%
- 8CanadaUS$ 557 mn 3.5%
- 9PolandUS$ 555 mn 3.5%
- 10FranceUS$ 539 mn 3.4%
Opportunity: what these countries buy from the world, and from India
Each country’s own recorded imports in UN Comtrade, latest year it has reported. The long light part of each bar is demand other countries are filling today.
TradeStat’s 2023-24 quantities are double-counted, so that year is left out of the price. Sources: TradeStat — Export Import Data Bank, Department of Commerce · UN Comtrade database (United Nations Statistics Division) · Figures taken 29 October 2026.
Step by step
How to export nonwovens and technical textiles
China, the EU and the USA lead world nonwovens production and trade; India is a fast-growing producer, supported by government focus on technical textiles. Demand is driven by hygiene products, wipes, medical disposables, agriculture, construction and automotive uses. Indian suppliers win on price for spunbond and crop covers in nearby markets. Openings lie in certified medical and hygiene grades and in geotextiles for infrastructure.
- 01Send samples and agree the spec
Send swatches or cones with test reports; fix construction, GSM or count, shade, tolerances, packing and the testing lab in the purchase order.
- 02Confirm standards
Agree the standard (BIS, EN, ISO or buyer) and any certification for medical or hygiene use.
- 03Produce and slit
Run the line at the agreed GSM and slit rolls to width.
- 04Test each lot
Test GSM, strength and functional properties; issue test reports.
- 05Book, stuff and file the shipping bill
Book the container, stuff it at the factory or a CFS, file the shipping bill on ICEGATE with the correct 8-digit code and the RoDTEP/RoSCTL declaration, and get the bill of lading.
- 06Get paid and close the file
Send the original documents through your bank (or to the buyer if paid in advance). Once the money arrives, get the e-BRC and claim RoDTEP, RoSCTL or drawback where they apply.
Questions
Questions about exporting nonwovens and technical textiles
Which council issues the RCMC?
Do medical nonwovens need extra approval?
How is nonwoven priced?
Why are crop covers UV-stabilised?
What RoDTEP applies?
Who buys Indian nonwovens and technical textiles
All countries → CEPAAEDAbu DhabiUnited Arab EmiratesIndia's biggest Gulf buyer and a re-export hub for the Middle East and Africa. CEPA in force since 2022.From India 2025-26US$ 37.4 bn
 SARRiyadhSaudi ArabiaLarge Gulf market for rice, food and engineering goods. Strict SFDA food rules and SABER certification for regulated goods.From India 2025-26US$ 10.3 bn
 USDWashington, D.C.United States of AmericaIndia's largest single-country export market. Strict FDA rules for food; extra 10% US duty on most goods since July 2026.From India 2025-26US$ 87.3 bn
 KESNairobiKenyaEast Africa's trade gateway via Mombasa. Buys medicines, vehicles, steel and rice; KEBS pre-shipment checks apply.From India 2025-26US$ 4.02 bn
 EURBerlinGermanyEurope's largest economy and India's biggest EU partner. Values quality, certificates and supply-chain transparency.From India 2025-26US$ 11.5 bn
More in textiles & apparel
All products →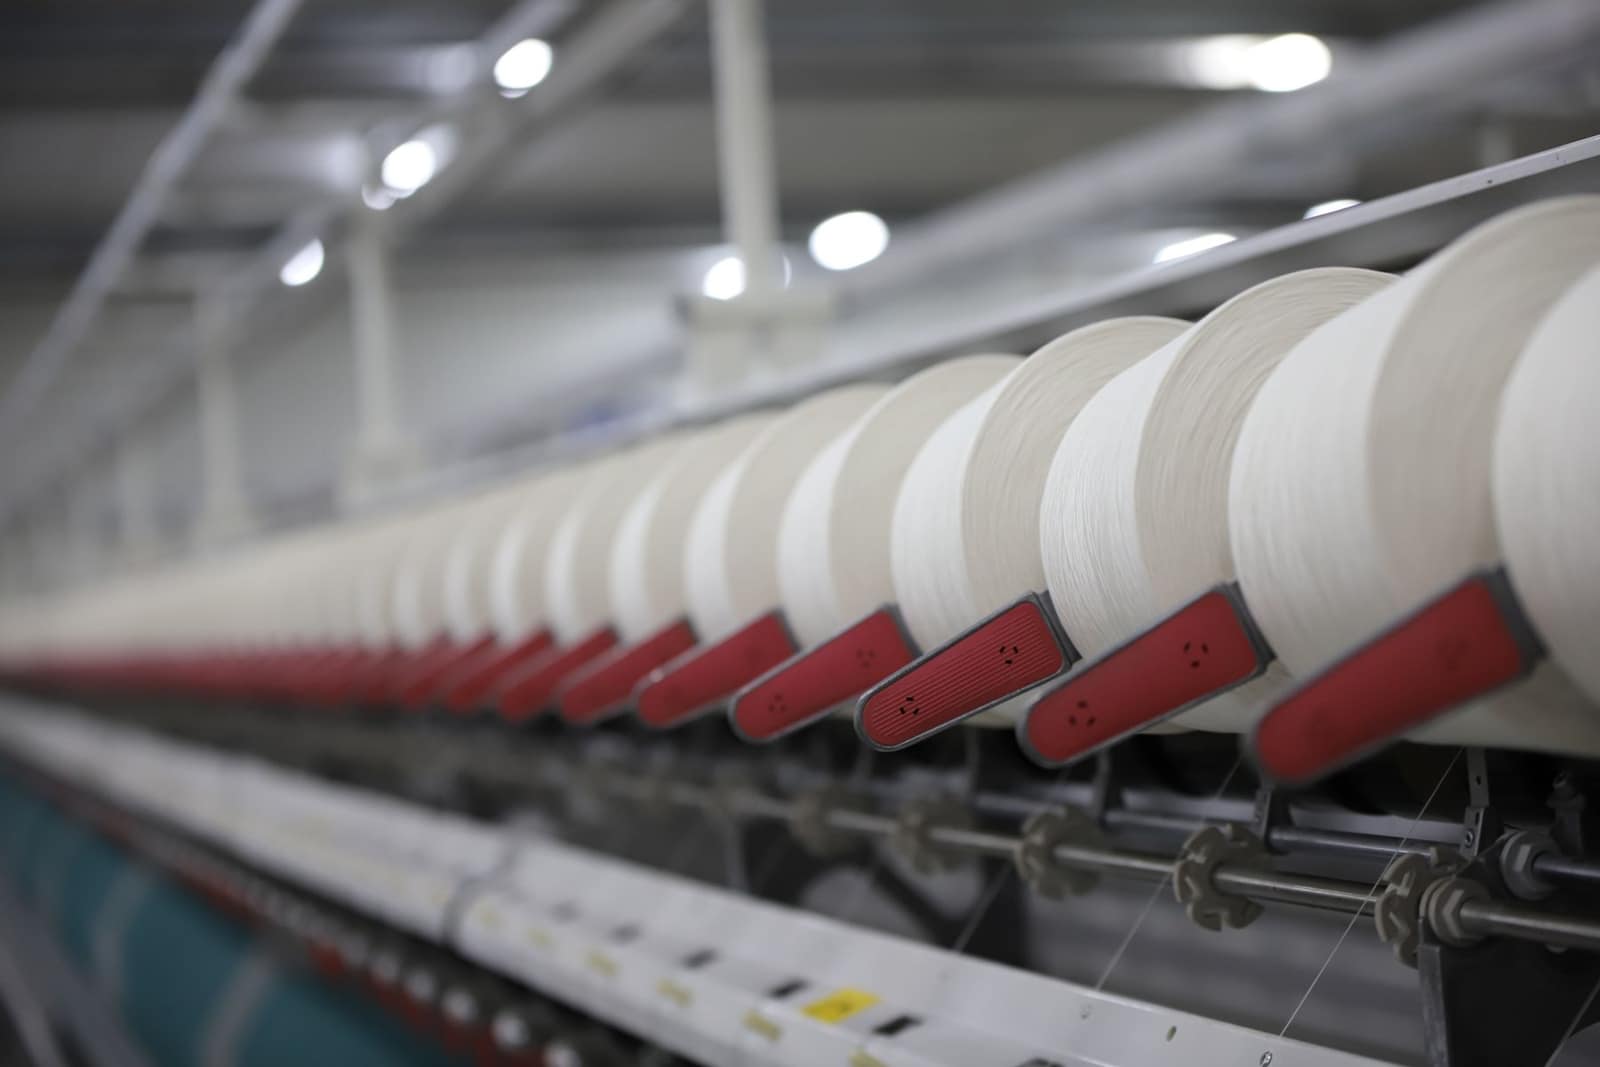 Free to exportTextiles & apparelCotton yarnBulk cotton yarn sold to weaving and knitting mills abroad; Bangladesh is by far the largest buyer.HS5205Exports 2025-26US$ 3.22 bn ↓4.1%
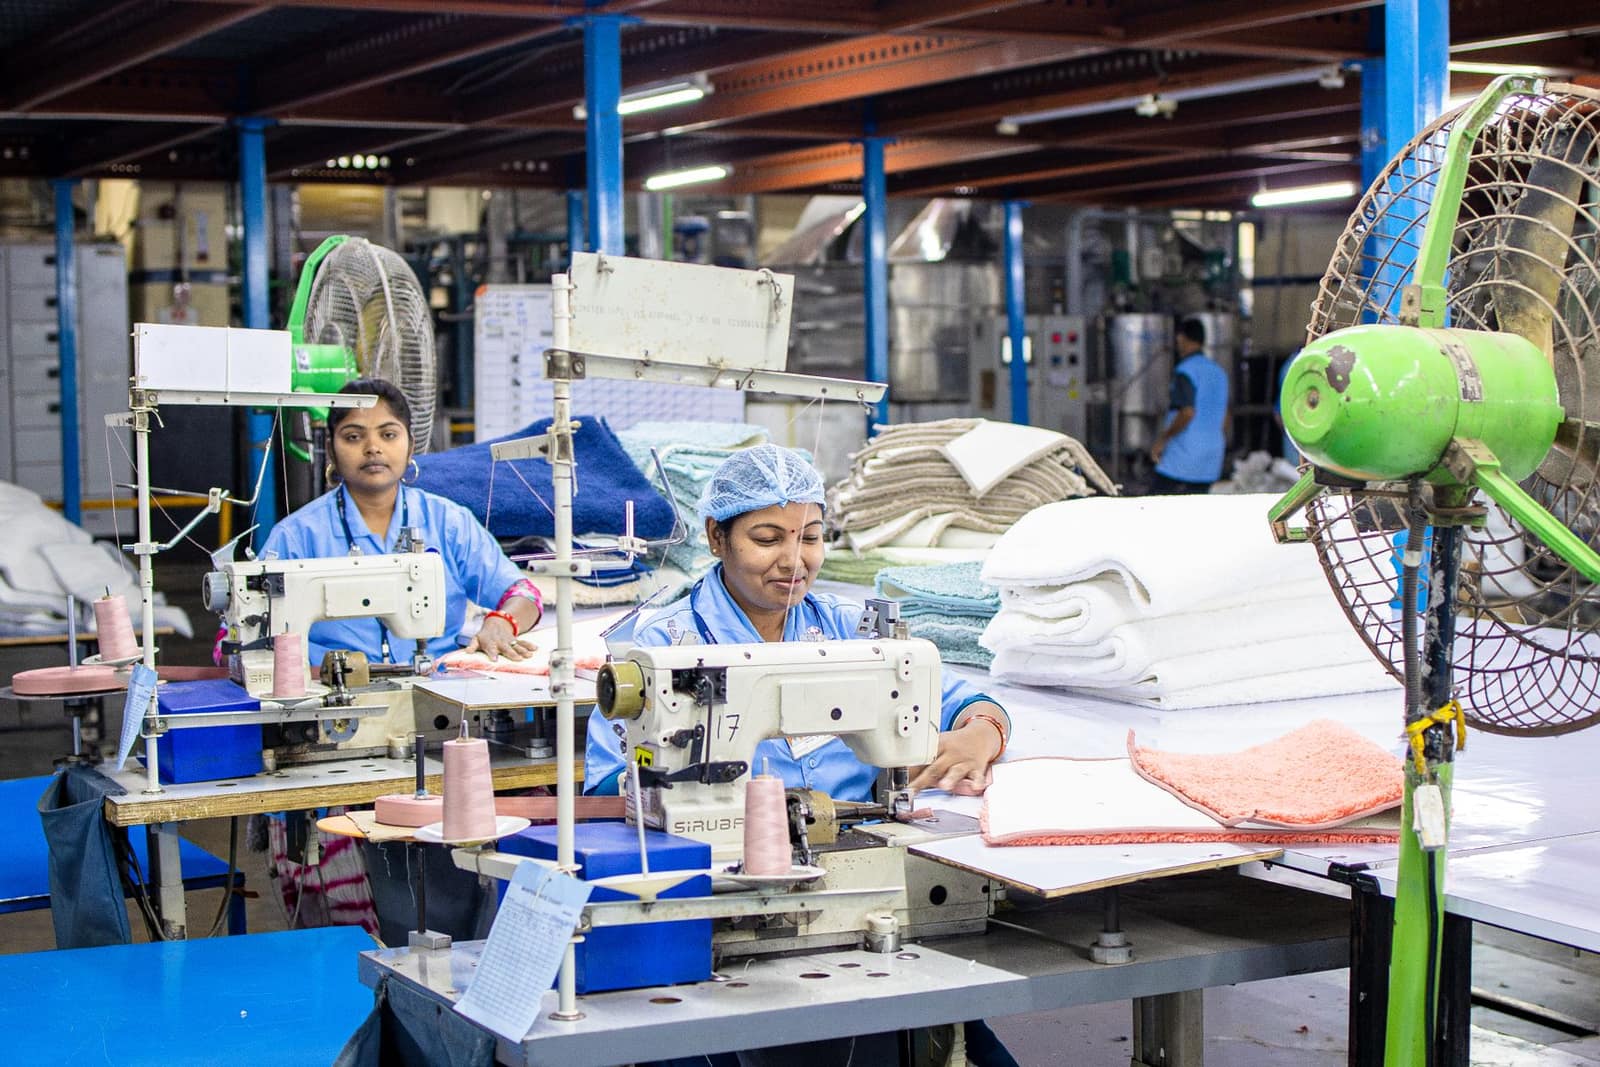 Free to exportTextiles & apparelReadymade garmentsKnitted and woven clothing for brands and retailers; the USA, UK, UAE and the EU are the big buyers.HS6109.10Exports 2025-26US$ 15.8 bn ↓1.2%
 Free to exportTextiles & apparelHome textiles (bed, bath and kitchen linen)Bedsheets, towels and kitchen linen for retailers; the USA buys more than half of India's exports.HS6302Exports 2025-26US$ 2.01 bn ↓5.7%
 Free to exportTextiles & apparelHandloom productsHand-woven fabrics, stoles and furnishings; buyers pay for craft, story and certified handloom origin.HS6304Exports 2025-26US$ 1.75 bn ↓8.6%