


Handicrafts
Export ceramic tableware and decor
Stoneware mugs, bone china, Khurja and blue pottery; the USA, Brazil and the UK lead.
- HS code
- 6911 Porcelain and bone china tableware and kitchenware (6911), stoneware, earthenware and other ceramic tableware and household articles (6912), and ceramic statuettes and ornamental articles (6913).
- Export policy
- Free to export Free to export under ITC(HS) Schedule 2 (no condition listed). Confirm the current entry on the DGFT ITC(HS) search before you sign a contract.
- Registrations
- 4 IEC, GST and those below
- India’s exports, 2025-26
- US$ 62.7 mn to 87 countries
What is exported
India exports stoneware and earthenware mugs, plates and bowls, bone china and porcelain dinnerware, and hand-painted decorative pottery from clusters such as Khurja and Jaipur. Buyers are homeware importers, department stores, online sellers and hotel suppliers. In 2025-26 India exported about US$ 43 million under HS 6912 (Brazil and the USA led), about US$ 18 million under HS 6911 (the UK and USA led) and about US$ 1.6 million under HS 6913.

Varieties, grades and forms
- Stoneware mugs, plates and bowlsReactive-glaze and hand-painted pieces for homeware stores (HS 6912).
- Bone china and porcelain dinnerwareFor hotels, gift sets and retail (HS 6911).
- Decorative potteryKhurja, blue pottery of Jaipur, black pottery of Nizamabad, terracotta (HS 6913 and 6912).
Where it is grown or made
- Uttar PradeshKhurja (Bulandshahr), Chunar (Mirzapur), Nizamabad (Azamgarh) and Gorakhpur (terracotta)
- RajasthanJaipur (blue pottery) and Pokaran
- GujaratThangadh and Morbi — ceramic tableware units
- West Bengal and RajasthanBone china and porcelain plants
The quality buyers ask for
- Lead and cadmium release
- Within EU limits for ceramic food-contact articles and US FDA action levels, tested by the buyer's method
- Body
- Stoneware, earthenware, porcelain or bone china, with water absorption stated
- Durability
- Thermal shock, dishwasher and microwave resistance where claimed
- Size and finish
- Dimensions, capacity and glaze colour within agreed tolerance
Certificates
- Lead and cadmium test reportRequiredRequired by EU, UK and US buyers for food-contact ceramics.
- EU declaration of compliance (food contact)RequiredNeeded for ceramics sold in the EU for food use.
- California Proposition 65 reviewOften askedAsked for products sold in California.
- Social auditOften askedRetail chains often ask for one.
Shipping, storage and shelf life
Ceramics fill containers by volume; first orders often go LCL. A 40-ft container holds a few thousand cartons of mugs or plates, depending on packing.
Sea from Nhava Sheva, Mundra or Kolkata; ICDs near Khurja and Jaipur.
Store in dry cartons; stack within carton strength.
What goes on the pack and carton
- Food-safe items: maker or importer details and, in the EU, the food-contact symbol or words where required.
- Decorative items not for food: clear "Not for food use" marking.
- Back-stamp or label with "Made in India" and care instructions (dishwasher, microwave).
CSIR-CGCRI (including its Khurja centre) tests ceramics. For lead and cadmium release, use NABL-accredited labs; EPCH and CAPEXIL can share lists.
Benefits of exporting this product
- RoDTEP: 1.4% of FOB
Tariff item 6912 00 10 (ceramic tableware other than porcelain) earns 1.4% of FOB value, with no rupee cap, as a duty credit scrip on ICEGATE. Bone china and soft porcelain tableware (6911 10 11) also carries 1.4%; other porcelain tableware and household articles, and ornamental ceramics (6913), carry 0.9%. These rates continue to 31 Dec 2026 (DGFT Notification 41/2026-27). Confirm your exact 8-digit line on the DGFT RoDTEP page before you price an order.
DGFT — Appendix 4R, RoDTEP schedule for DTA exports w.e.f. 10.10.2024 (Notification 32/2024-25); rates continued to 31.12.2026 by Notification 41/2026-27 ↗ - Duty drawback: 1.4% of FOB
Drawback item 6912 (ceramic tableware and household articles other than porcelain) has an All Industry Rate of 1.4% of FOB, paid into your bank account. It is not available on exports under Advance Authorisation or from EOU/SEZ units. Porcelain tableware (6911) and ornamental ceramics (6913) also get 1.4%. Check the current schedule on the CBIC drawback page before shipping.
Gazette of India — Notification 77/2023-Customs (N.T.) dated 20.10.2023: All Industry Rates of duty drawback ↗ - Registered GI tags
Khurja Pottery, Chunar Glaze Pottery and Nizamabad Black Pottery (Uttar Pradesh), and Blue Pottery of Jaipur (Rajasthan) are registered Geographical Indications. Only registered producers and authorised users may sell under these names, which helps genuine makers stand out and fetch a better price.
IP India (Geographical Indications Registry) — Registration details of Geographical Indications ↗
Where to register
- CAPEXILFactory-made ceramics are listed under CAPEXIL in Appendix 2T.capexil.org ↗
- EPCHHandmade pottery and decorative ceramics (miscellaneous handicrafts) can register with EPCH.epch.in ↗
Quality and checks
- Lead and cadmium release from glazes on anything that touches food: the EU sets limits for ceramic food-contact articles, and the US FDA applies action levels by article type (CPG 545.450).
- Decorative pieces that are not food-safe must be marked "Not for food use" (the USA has specific rules for such marking).
- Dishwasher, microwave and thermal-shock tests when the buyer claims these on the label.
Start with a small range of stoneware mugs and bowls or hand-painted Khurja or blue pottery, get lead and cadmium tests done at an accredited lab, and show at the IHGF Delhi Fair. First orders from homeware importers are usually a few hundred cartons in a shared container.
Where new exporters go wrong
- Glaze that fails the lead test — buyers recall the whole lot and claim costs.
- Breakage in transit: use partitions, double-wall cartons and drop tests.
- Colour and size variation in handmade pieces — agree tolerances with photos before production.
Documents this product needs
Schemes that apply
- RoDTEP Remission of Duties and Taxes on Exported Products
- Drawback Duty Drawback (All Industry Rates)
- EPCG Export Promotion Capital Goods Scheme
- ECGC ECGC export credit insurance for small exporters
- LUT Letter of Undertaking for zero-rated exports under GST
- Districts as Export Hubs Districts as Export Hubs
Sources (8)
- Department of Commerce, Export Import Data Bank — India's exports of HS 6911, 6912 and 6913 by country, 2025-26
- DGFT — Appendix 2T: Export Promotion Councils and the products under each
- DGFT — ITC(HS) export policy search (Schedule 2)
- CAPEXIL — official site
- EPCH (Export Promotion Council for Handicrafts) — official site
- US FDA — CPG Sec. 545.450, Pottery (ceramics); import and domestic — lead contamination
- European Commission — Food contact materials (ceramics)
- IP India (Geographical Indications Registry) — Registration details of Geographical Indications
Trade data
Indian ceramic tableware and decor exports in numbers
From the Department of Commerce’s TradeStat, country by country. US$, Indian financial years (April–March).
- Exports in 2025-26
- US$ 62.7 mn +13.6% a year on average, 2020-21 to 2025-26
- Change from 2024-25
- ↑ +11.4% US$ 56.3 mn → US$ 62.7 mn
- Buyer countries
- 87
- Average export price
- US$ 2.34 per kg · 26,756 tonnes shipped · US$ 2.44 the year before
The price cycle
India’s average export price per kg each year (total value ÷ total quantity). Highest in 2022-23, lowest in 2025-26 — a 13% swing between them. Keep this swing in mind when you quote.
What next: a projection from the trend
The past trend carried forward — not a forecast by any authority. Sudden changes in policy, prices or demand are not in it.
Likely range US$ 62.1 mn to US$ 94.6 mn.
- Trend
- +10.1% a year
- Fit (R²)
- 0.68
- Based on
- 6 years of official figures
Method: a straight line through the logarithm of yearly exports (log-linear regression); range = ±1 standard error.
Biggest buyer countries
By value in 2025-26. Change is against 2024-25.
Where demand is rising and falling
Only countries that buy at least US$ 1 million or 1% of India’s exports of this product. Change from 2024-25 to 2025-26.
↑ High demand
- NetherlandsUS$ 1.1 mn → US$ 1.8 mn↑+63.1%
- BrazilUS$ 14.4 mn → US$ 17.5 mn↑+21.1%
- United States of AmericaUS$ 14.9 mn → US$ 17.2 mn↑+15.7%
- United Arab EmiratesUS$ 2.6 mn → US$ 3 mn↑+14.6%
↓ Low demand
Which forms sell, and at what price
India’s exports by 8-digit tariff line, 2025-26. Average price = total value ÷ total quantity (TradeStat): the average of every shipment on that line, not the price of any one deal.
| Tariff line | Value 2025-26 | Change | Quantity | Average price |
|---|---|---|---|---|
Tblware of bon china and sft prcln6911 10 11 · Tableware and kitchenware, of porcelain or china | US$ 14.8 mn | ↓-4% | 2,614 tonnes | US$ 5.66 per kgwas US$ 5.48 |
Others-of-cermc tableware,kitchenware,other householdartcls etc. other than of porcelian or china6912 00 90 · Ceramic tableware, kitchenware, other household articles and toilet articles, other than of porcelain or china | US$ 12.4 mn | ↑+13.7% | 6,665 tonnes | US$ 1.87 per kgwas US$ 2.06 |
Clay articls as tableware, kitchenware etc.6912 00 40 · Ceramic tableware, kitchenware, other household articles and toilet articles, other than of porcelain or china | US$ 12.3 mn | ↑+9.9% | 6,824 tonnes | US$ 1.80 per kgwas US$ 1.90 |
Ceramic tableware (e.g. of imitation porcelain/or semi-porcelain)6912 00 10 · Ceramic tableware, kitchenware, other household articles and toilet articles, other than of porcelain or china | US$ 9.3 mn | ↑+20.9% | 4,890 tonnes | US$ 1.89 per kgwas US$ 1.73 |
Ceramic tableware, kitchenware, other household articles and toilet articles, other than of porcelain or china — ceremic kitchenware6912 00 20 | US$ 8.8 mn | ↑+63.5% | 3,743 tonnes | US$ 2.36 per kgwas US$ 2.23 |
Tblware of other thn bon china and sft prcln6911 10 19 · Tableware and kitchenware, of porcelain or china | US$ 2.8 mn | ↓-8.4% | 1,400 tonnes | US$ 2.03 per kgwas US$ 2.11 |
Other statuette etc.(excluding of porclain/china)6913 90 00 · Ceramic statuettes and other ornamental ceramic articles, other than of porcelain or china | US$ 1.4 mn | ↑+26.1% | 321 tonnes | US$ 4.37 per kgwas US$ 4.31 |
Ktchnware of other thn bon chna and sft prcln6911 10 29 · Tableware and kitchenware, of porcelain or china | US$ 290k | ↓-59.7% | 142 tonnes | US$ 2.05 per kgwas US$ 2.81 |
Other of other hsehld and tolt articles of prcln6911 90 90 · Household and toilet articles in heading no. 6911, of porcelain or china | US$ 200k | ↓-47.4% | 65 tonnes | US$ 3.10 per kgwas US$ 4.79 |
Statuettes etc. of porcelain/china6913 10 00 · Ceramic statuettes and other ornamental ceramic articles, of porcelain or china | US$ 200k | ↑+33.3% | 15 tonnes | US$ 13.72 per kgwas US$ 10.22 |
Toilet articles other than porcelain/china6912 00 30 · Ceramic tableware, kitchenware, other household articles and toilet articles, other than of porcelain or china | US$ 100k | ↑+150% | 31 tonnes | US$ 3.18 per kgwas US$ 1.00 |
Ktchnware of bon china and sft prcln6911 10 21 · Tableware and kitchenware, of porcelain or china | US$ 90k | ↓-59.1% | 41 tonnes | US$ 2.17 per kgwas US$ 2.15 |
Toilet articles of prcln china6911 90 10 · Household and toilet articles in heading no. 6911, of porcelain or china | US$ 10k | ↑0% | 6.7 tonnes | US$ 1.49 per kgwas US$ 18.38 |
Wtr fltr of capcty not excdng 40lts of prcl6911 90 20 · Household and toilet articles in heading no. 6911, of porcelain or china | US$ 0 | ↓-100% | 0.1 tonnes | — |
The world market
Each country’s own recorded exports and imports in UN Comtrade, 2023 (the latest year nearly every country has reported).
- World imports
- US$ 8.99 bn 2023
- India among exporters
- #24 of 154 countries
- India’s share of world exports
- 0.3% US$ 47.9 mn
- Left for others to win
- US$ 14.1 bn exported by other countries
Top exporters — your competitors
- 1ChinaUS$ 9.16 bn 64.8%
- 2GermanyUS$ 671 mn 4.7%
- 3PortugalUS$ 412 mn 2.9%
- 4NetherlandsUS$ 348 mn 2.5%
- 5FranceUS$ 335 mn 2.4%
- 6ItalyUS$ 248 mn 1.8%
- 7United KingdomUS$ 239 mn 1.7%
- 8PolandUS$ 238 mn 1.7%
- 9TürkiyeUS$ 221 mn 1.6%
- 10ThailandUS$ 219 mn 1.6%
Biggest buyers in the world
- 1USAUS$ 2.02 bn 22.5%
- 2GermanyUS$ 664 mn 7.4%
- 3FranceUS$ 432 mn 4.8%
- 4United KingdomUS$ 385 mn 4.3%
- 5NetherlandsUS$ 374 mn 4.2%
- 6ItalyUS$ 351 mn 3.9%
- 7CanadaUS$ 251 mn 2.8%
- 8JapanUS$ 216 mn 2.4%
- 9PolandUS$ 212 mn 2.4%
- 10SpainUS$ 208 mn 2.3%
Opportunity: what these countries buy from the world, and from India
Each country’s own recorded imports in UN Comtrade, latest year it has reported. The long light part of each bar is demand other countries are filling today.
TradeStat’s 2023-24 quantities are double-counted, so that year is left out of the price. Sources: TradeStat — Export Import Data Bank, Department of Commerce · UN Comtrade database (United Nations Statistics Division) · Figures taken 29 October 2026.
Step by step
How to export ceramic tableware and decor
China dominates ceramic tableware exports, with Portugal, Germany, the UK, Thailand, Vietnam and Turkey also strong. India is a small but growing supplier of stoneware, bone china and hand-crafted pottery, valued for handmade looks and short runs. Demand is driven by homeware retail, online sellers and hotels and restaurants. Buyers look for distinctive designs, reactive glazes and artisan stories, but also strict food-safety compliance on lead and cadmium. Openings are in stoneware for homeware brands, GI-tagged decorative pottery, and bone china for hospitality.
- 01Develop designs
Create a small collection with consistent glazes and sizes.
- 02Test glazes
Get lead and cadmium release tests done on every glaze before sampling.
- 03Register
IEC, GST LUT and RCMC (CAPEXIL or EPCH).
- 04Sample and fair
Show at the IHGF Delhi Fair; send samples to importers.
- 05Produce and inspect
Check each lot for chips, glaze defects and colour.
- 06Pack, ship and claim
Partitioned cartons; file the shipping bill and claim RoDTEP and drawback.
Meet buyers
Trade fairs
- February, every year — check datesAmbiente (includes stationery and writing products)Frankfurt, Germanyambiente.messefrankfurt.com ↗
- Twice a year: spring (February–March) and autumn (October) — check datesIHGF Delhi Fair (EPCH)Greater Noida, Indiaihgfdelhifair.in ↗
- January and September — check datesMaison&ObjetParis, Francemaison-objet.com ↗
- February and August — check datesNY NOW (home, gift and lifestyle)New York, USAnynow.com ↗
- Usually April — check datesHKTDC Home InStyle (housewares)Hong Konghktdc.com ↗
Questions
Questions about exporting ceramic tableware and decor
Why do buyers insist on lead tests?
CAPEXIL or EPCH?
What RoDTEP applies?
Which GI tags exist for pottery?
What order size should I expect?
Sources (8)
- CAPEXIL — official site
- EPCH (Export Promotion Council for Handicrafts) — official site
- US FDA — CPG Sec. 545.450, Pottery (ceramics); import and domestic — lead contamination
- European Commission — Food contact materials (ceramics)
- CSIR-Central Glass and Ceramic Research Institute (CGCRI)
- NABL — search for accredited testing laboratories
- IP India (Geographical Indications Registry) — Registration details of Geographical Indications
- DGFT — Appendix 4R, RoDTEP schedule for DTA exports w.e.f. 10.10.2024 (Notification 32/2024-25); rates continued to 31.12.2026 by Notification 41/2026-27
Who buys Indian ceramic tableware and decor
All countries → USDWashington, D.C.United States of AmericaIndia's largest single-country export market. Strict FDA rules for food; extra 10% US duty on most goods since July 2026.From India 2025-26US$ 87.3 bn
 CETAGBPLondonUnited KingdomNew CETA in force since July 2026 — most Indian goods now enter duty-free. Strong market for garments, food and engineering.From India 2025-26US$ 13.4 bn
 CEPAAEDAbu DhabiUnited Arab EmiratesIndia's biggest Gulf buyer and a re-export hub for the Middle East and Africa. CEPA in force since 2022.From India 2025-26US$ 37.4 bn
 CADOttawaCanadaLarge Indian diaspora market. Importer needs a CFIA licence for food; labels in English and French.From India 2025-26US$ 4.67 bn
 ECTAAUDCanberraAustraliaZero duty on all Indian goods since Jan 2026 — but some of the world's strictest biosecurity rules.From India 2025-26US$ 7.28 bn
 EURBerlinGermanyEurope's largest economy and India's biggest EU partner. Values quality, certificates and supply-chain transparency.From India 2025-26US$ 11.5 bn
 EURAmsterdamNetherlandsEurope's main gateway: Rotterdam handles goods for the whole EU. EU food-safety and residue rules apply.From India 2025-26US$ 17.5 bn
 EURMadridSpainGrowing EU buyer of Indian garments, seafood, chemicals and auto parts; Valencia and Algeciras are key ports.From India 2025-26US$ 6.96 bn
More in handicrafts
All products →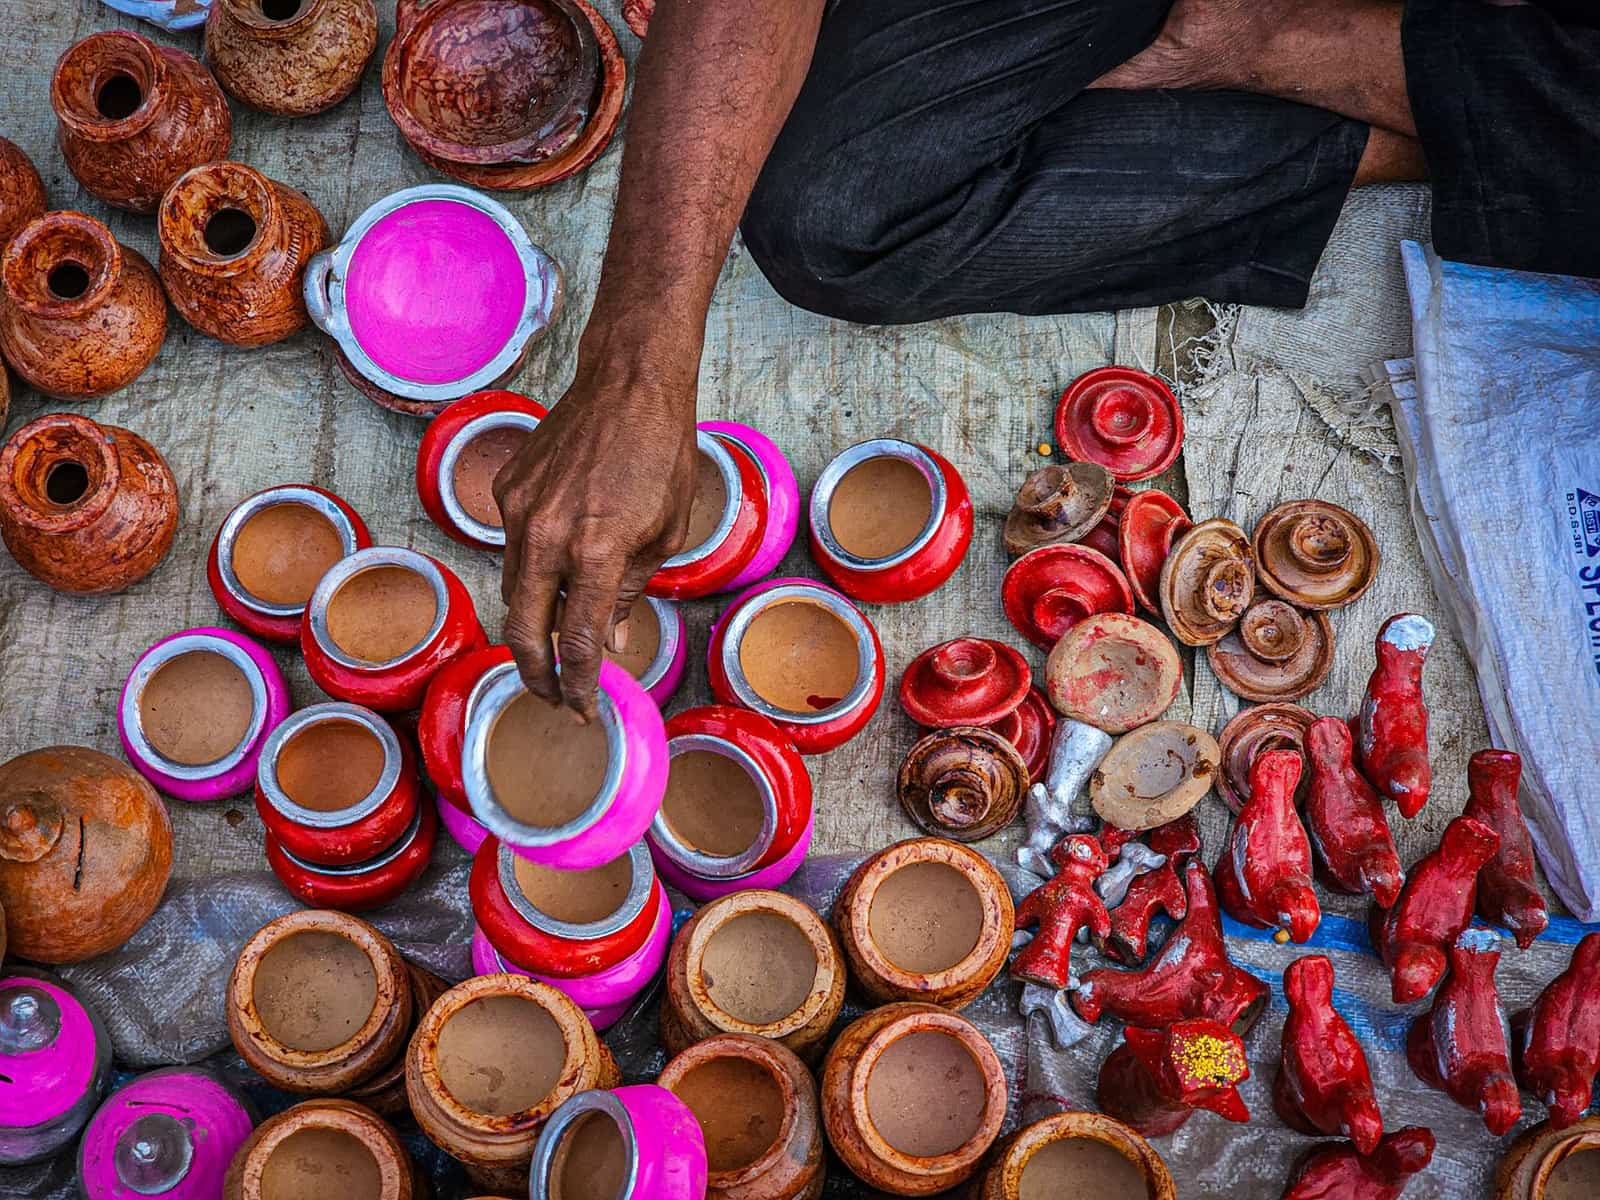 Free to exportHandicraftsHandicrafts (cane, bamboo, jute and natural fibre)Baskets, storage, lamps and décor from cane, bamboo and grasses, sold to home-décor importers.HS4602Exports 2025-26US$ 23.3 mn ↓20.7%
 Free to exportHandicraftsBrass and art metalwareMoradabad-style brass décor, lamps, bells and tableware for gift and home-décor buyers.HS8306Exports 2025-26US$ 36.4 mn ↑11.4%
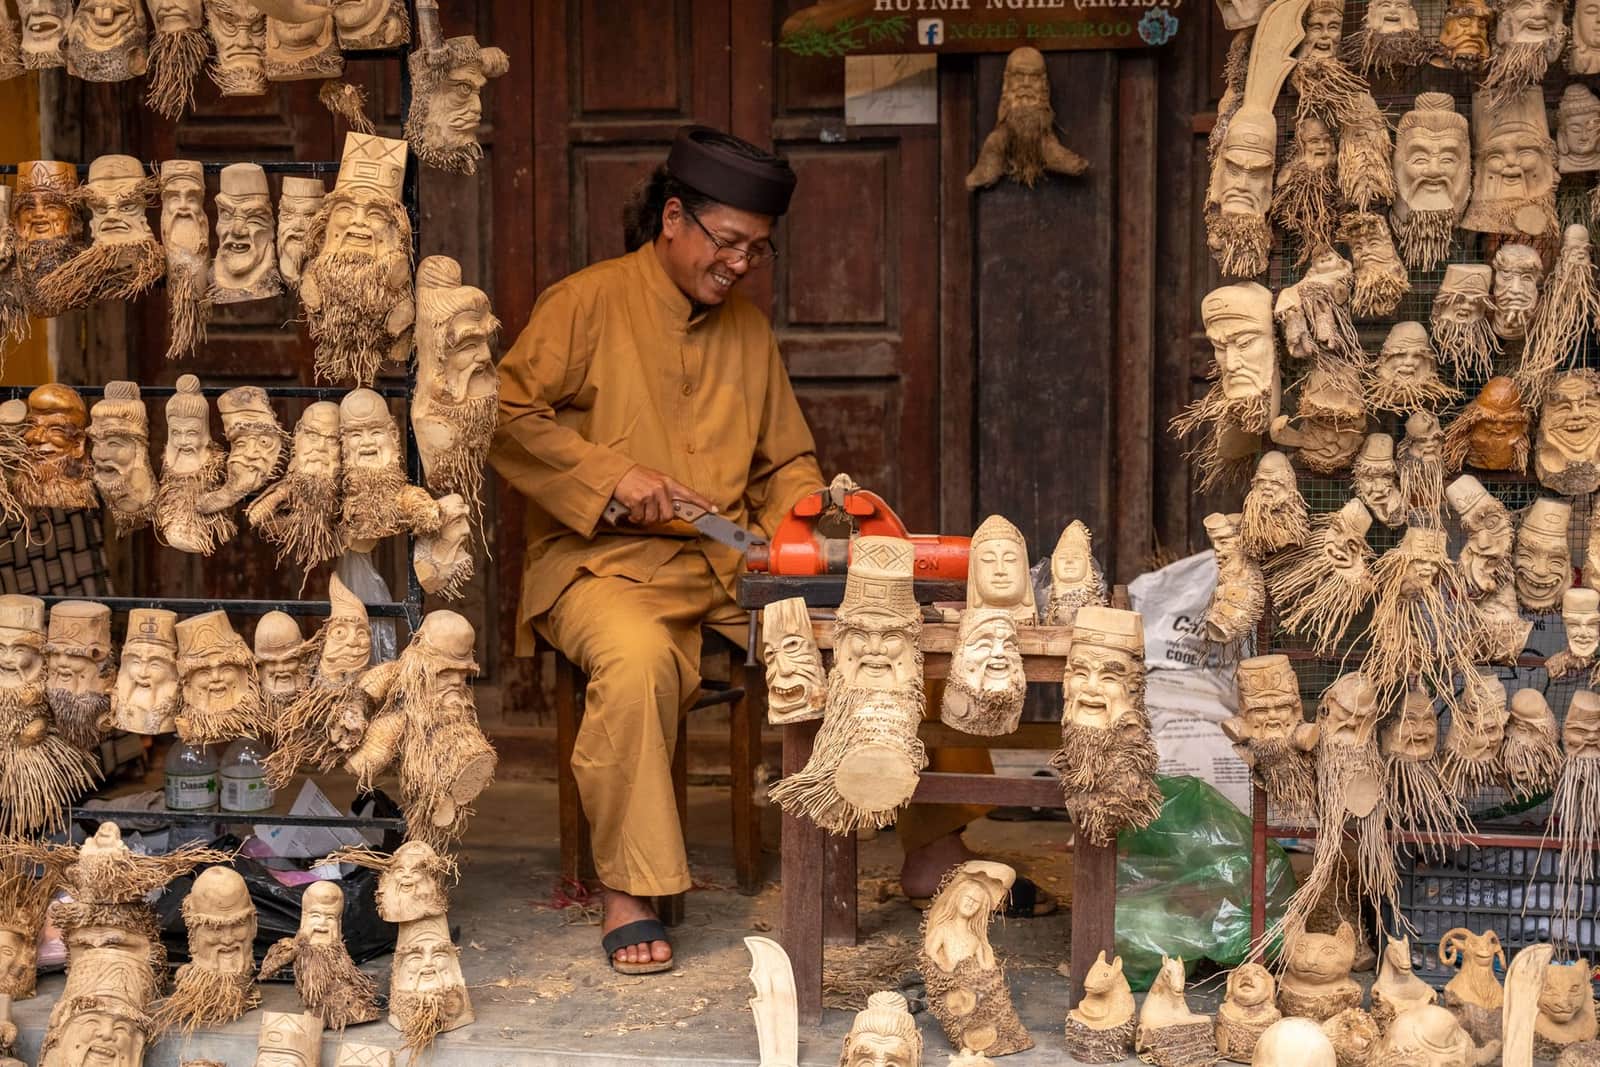 Free, with conditionsHandicraftsWooden handicraftsCarved, inlaid and turned wooden décor, boxes and kitchenware from Saharanpur, Jodhpur and Channapatna.HS4420Exports 2025-26US$ 11.5 mn ↓9%
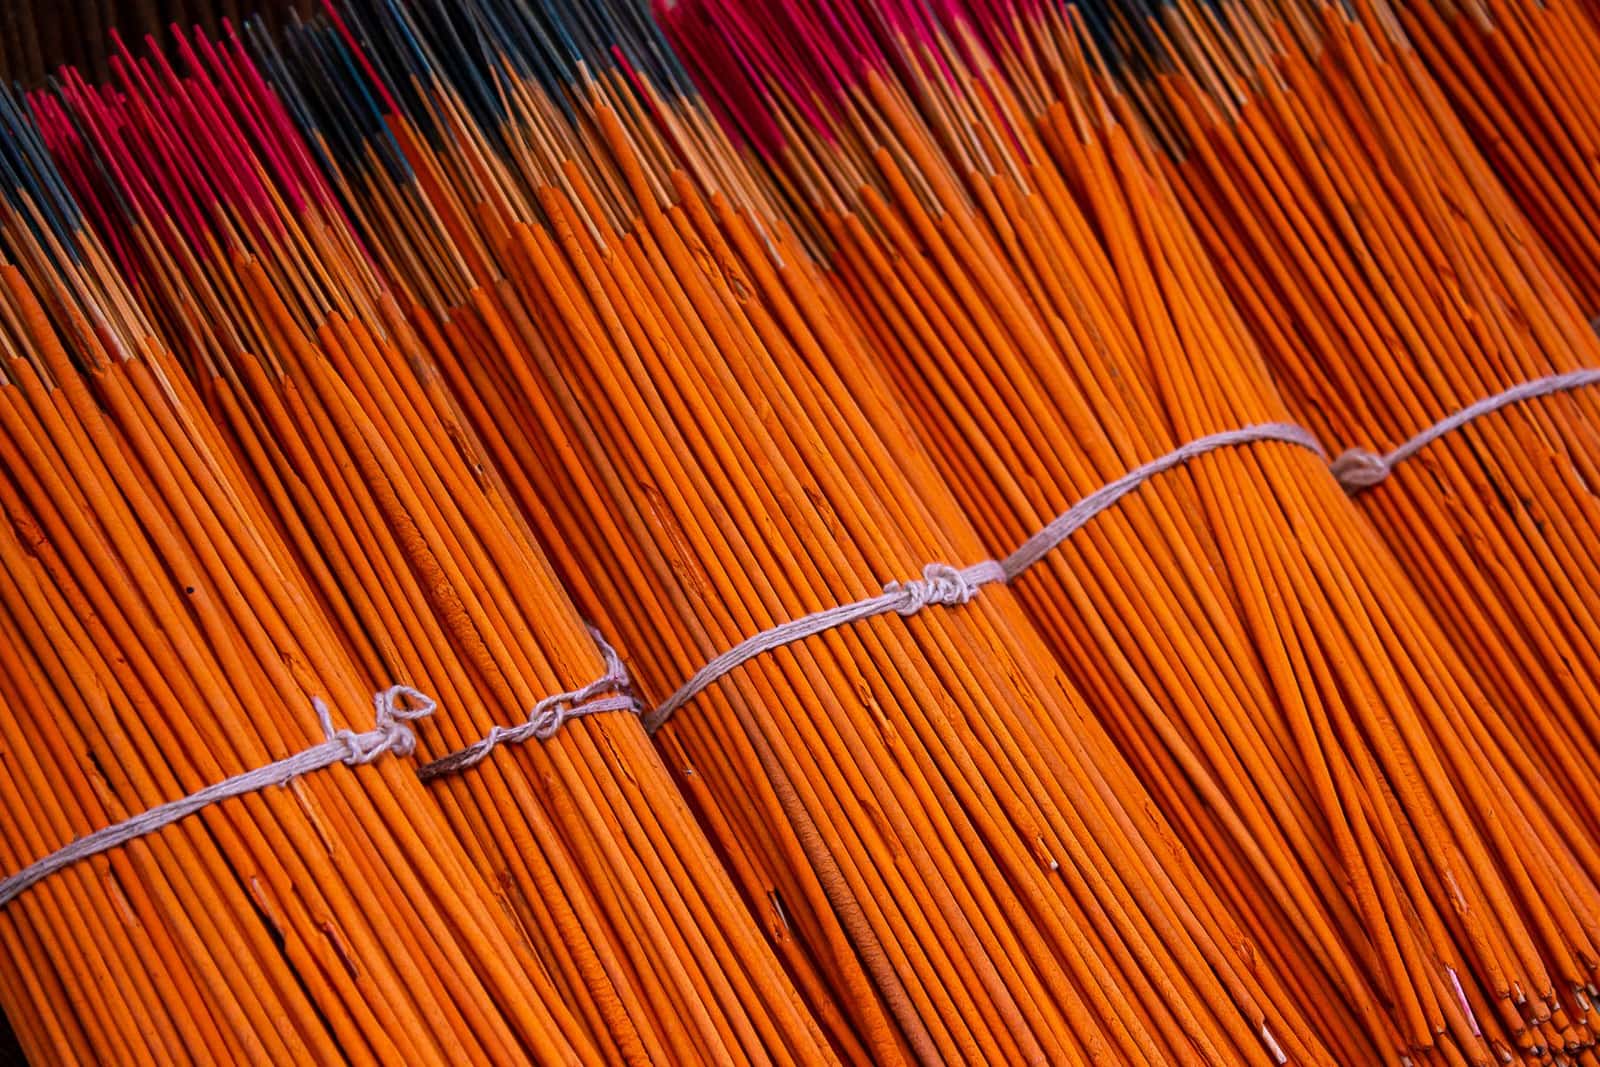 Free to exportHandicraftsIncense sticks (agarbatti) and dhoopMasala and dipped incense sticks, cones and dhoop for the USA, the Gulf, Africa and Latin America.HS3307.41Exports 2025-26US$ 151 mn ↓0.4%