

Pharma & chemicals
Export soaps and detergents
Toilet and laundry soaps, detergent powders and surfactants; the UAE, USA and Bangladesh lead.
- HS code
- 3401 Soap in bars, cakes, flakes or liquid form (3401); surface-active agents, washing and cleaning preparations, detergents (3402).
- Export policy
- Free to export Free to export under ITC(HS) Schedule 2 as checked in November 2026. Toilet soaps are cosmetics under Indian law and need a cosmetic manufacturing licence; laundry soaps and detergents follow BIS standards for the home market. Confirm your exact 8-digit line on the DGFT ITC(HS) search before you ship.
- Registrations
- 3 IEC, GST and those below
- India’s exports, 2025-26
- US$ 803 mn to 161 countries
What is exported
India exports toilet soaps (including herbal and ayurvedic-style bars), laundry soaps, detergent powders and surfactants such as LABSA. Large plants are in Maharashtra, Gujarat, Uttar Pradesh, Himachal Pradesh, Tamil Nadu and Kerala, with many small soap makers in every state. In 2025-26 India exported about US$ 159 million of soap (HS 3401), led by the UAE and the USA, and about US$ 644 million of detergents and surfactants (3402), led by the UAE, the USA and Bangladesh.
Varieties, grades and forms
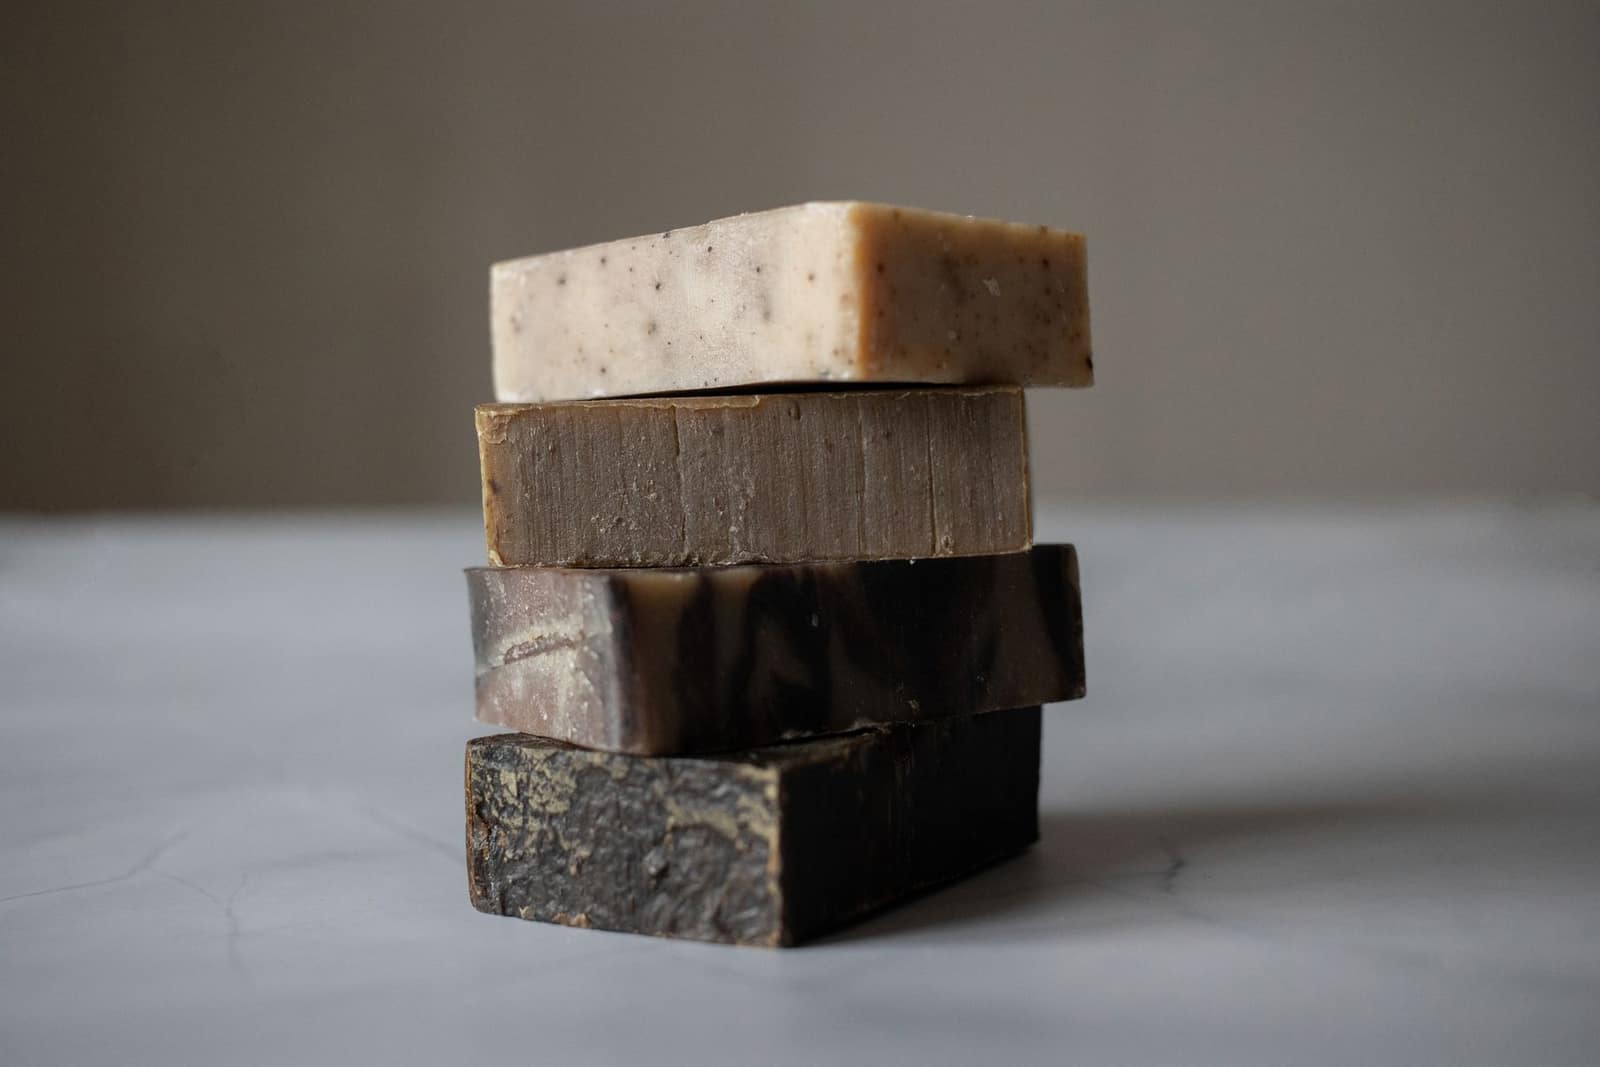
- Toilet soapsHerbal, glycerine, sandalwood and medicated bars.
- Laundry soapsDetergent cakes and bars.
- Detergent powders and liquidsRetail and bulk washing preparations (3402).
- SurfactantsLABSA, SLES and other surface-active agents for industry.
Where it is grown or made
- Maharashtra and GujaratMumbai, Nagpur; Ahmedabad, Vadodara
- Uttar Pradesh and Himachal PradeshKanpur, Ghaziabad; Baddi
- Kerala and Tamil NaduKochi, Kozhikode; Chennai
- KarnatakaBengaluru and Mysuru (sandalwood soaps)
The quality buyers ask for
- Total fatty matter (TFM)
- Grade 1 toilet soap 76% min. TFM under IS 2888; laundry soap grades under IS 285 — or the buyer's figure
- Moisture and free alkali
- Within the limits of the standard named in the contract
- Weight
- Net weight per bar at packing and allowance for moisture loss
- Detergents
- Active matter %, biodegradability of surfactants (EU Detergents Regulation), phosphate content where restricted
- Fragrance
- IFRA-compliant fragrance; EU allergens declared above thresholds
Certificates
- Cosmetic manufacturing licence (toilet soaps)RequiredToilet soaps are cosmetics under Indian law and need this licence.
- EU cosmetics compliance (toilet soaps)Often askedResponsible Person, safety report and CPNP notification.
- EU Detergents Regulation complianceOften askedBiodegradability and labelling for detergents sold in the EU.
- ISO 22716 / ISO 9001Often askedQuality systems buyers often ask for.
- Halal certificateOften askedAsked for by many Gulf and South-East Asian buyers.
Shipping, storage and shelf life
A 20-ft container typically holds about 12–18 tonnes of soap in cartons; detergent powder fills by volume.
Sea freight; road to Nepal, Bhutan and Bangladesh.
Cool, dry storage; avoid heat that softens bars or cakes powder.
Typically two to three years for soap bars as stated by the maker.
What goes on the pack and carton
- Product name, net weight, ingredients, maker and country of origin; batch and date.
- EU toilet soaps: cosmetic labelling with INCI list and Responsible Person; detergents: ingredient bands and dosing instructions under Regulation (EC) 648/2004.
- Arabic or local language for the Gulf and other markets as required.
NABL-accredited chemical labs test TFM, moisture, free alkali and detergent active matter (search 'soaps' or 'detergents' in the NABL directory). BIS-recognised labs test to IS 2888 and IS 285.
Benefits of exporting this product
- RoDTEP: 0.8% of FOB
Tariff item 3401 11 10 (medicated toilet soaps) earns 0.8% of FOB value, with no rupee cap, as a duty credit scrip on ICEGATE. Other soaps under 3401 and most detergent lines under 3402 carry 0.8%; non-ionic and cationic surfactants (3402 41/42) carry 0.9%. These rates continue to 31 Dec 2026 (DGFT Notification 41/2026-27). Confirm your exact 8-digit line on the DGFT RoDTEP page before you price an order.
DGFT — Appendix 4R, RoDTEP schedule for DTA exports w.e.f. 10.10.2024 (Notification 32/2024-25); rates continued to 31.12.2026 by Notification 41/2026-27 ↗ - Duty drawback: 1.2% of FOB
Drawback item 3401 (soap and organic surface-active products in bars and cakes) has an All Industry Rate of 1.2% of FOB, paid into your bank account. It is not available on exports under Advance Authorisation or from EOU/SEZ units. Most detergents (340299) have 1.2%; sodium alpha olefin sulphonate (340201) has 1.5%. Check the current schedule on the CBIC drawback page before shipping.
Gazette of India — Notification 77/2023-Customs (N.T.) dated 20.10.2023: All Industry Rates of duty drawback ↗
Where to register
- CHEMEXCILCosmetics and toiletries are listed under CHEMEXCIL in Appendix 2T; take your RCMC from CHEMEXCIL.chemexcil.in ↗
Quality and checks
- EU: toilet soaps are cosmetics under Regulation (EC) 1223/2009 (Responsible Person, safety report, CPNP); detergents must meet the Detergents Regulation (EC) 648/2004 on biodegradability and labelling.
- USA: a "true soap" (only fats and alkali, sold as soap) is regulated by CPSC; soaps with cosmetic or drug claims fall under FDA.
- Total fatty matter (TFM), moisture and free alkali per the buyer's or BIS standard (IS 2888 toilet soap, IS 285 laundry soap).
Herbal toilet soaps and laundry bars for Indian grocery stores abroad, Gulf distributors and Nepal are a common start. Fix TFM and weight per bar, print multilingual wrappers, and ship a mixed container on advance or LC terms.
Where new exporters go wrong
- Bars shrinking in weight through moisture loss — declared net weight must hold at the shelf.
- Cosmetic or "antibacterial" claims that need registration in the buyer country.
- Fragrance allergens not listed on EU labels.
Documents this product needs
Schemes that apply
- RoDTEP Remission of Duties and Taxes on Exported Products
- Drawback Duty Drawback (All Industry Rates)
- Advance Authorisation Advance Authorisation
- EPCG Export Promotion Capital Goods Scheme
- ECGC ECGC export credit insurance for small exporters
- LUT Letter of Undertaking for zero-rated exports under GST
- Status Holder Status Holder certificate (One to Five Star Export House)
- MAI / MAS Market Access Initiative (now Market Access Support under EPM)
Sources (6)
- Department of Commerce, Export Import Data Bank — India's exports of HS 3401 by country, 2025-26
- DGFT — Appendix 2T: Export Promotion Councils and the products under each
- DGFT — ITC(HS) export policy search (Schedule 2) and SCOMET list (Appendix 3)
- European Commission — Cosmetics (Regulation (EC) No 1223/2009)
- EUR-Lex — Regulation (EC) No 648/2004 on detergents
- CHEMEXCIL — official site
Trade data
Indian soaps and detergents exports in numbers
From the Department of Commerce’s TradeStat, country by country. US$, Indian financial years (April–March).
- Exports in 2025-26
- US$ 803 mn +7.3% a year on average, 2020-21 to 2025-26
- Change from 2024-25
- ↓ -0.8% US$ 809 mn → US$ 803 mn
- Buyer countries
- 161
- Average export price
- US$ 1.85 per kg · 4,33,137 tonnes shipped · US$ 1.81 the year before
The price cycle
India’s average export price per kg each year (total value ÷ total quantity). Highest in 2022-23, lowest in 2020-21 — a 39% swing between them. Keep this swing in mind when you quote.
What next: a projection from the trend
The past trend carried forward — not a forecast by any authority. Sudden changes in policy, prices or demand are not in it.
Likely range US$ 903 mn to US$ 1.06 bn.
- Trend
- +7.2% a year
- Fit (R²)
- 0.89
- Based on
- 6 years of official figures
Method: a straight line through the logarithm of yearly exports (log-linear regression); range = ±1 standard error.
Biggest buyer countries
By value in 2025-26. Change is against 2024-25.
Where demand is rising and falling
Only countries that buy at least US$ 1 million or 1% of India’s exports of this product. Change from 2024-25 to 2025-26.
↑ High demand
- SingaporeUS$ 15.7 mn → US$ 24.4 mn↑+55.5%
- AustraliaUS$ 7.5 mn → US$ 10.6 mn↑+40.7%
- NetherlandsUS$ 8.3 mn → US$ 11.6 mn↑+40%
- TanzaniaUS$ 8.1 mn → US$ 11.3 mn↑+39.5%
- RussiaUS$ 24.1 mn → US$ 33.6 mn↑+39.3%
- IndonesiaUS$ 15.4 mn → US$ 18.8 mn↑+22.4%
- South AfricaUS$ 10 mn → US$ 12.2 mn↑+21.3%
- CanadaUS$ 12 mn → US$ 14 mn↑+16.7%
↓ Low demand
- ArgentinaUS$ 8.8 mn → US$ 3.7 mn↓-58%
- United States of AmericaUS$ 99.2 mn → US$ 64.5 mn↓-35%
- BangladeshUS$ 54.7 mn → US$ 44.2 mn↓-19.2%
- ThailandUS$ 16.8 mn → US$ 13.8 mn↓-17.8%
- BrazilUS$ 43.8 mn → US$ 38 mn↓-13.2%
Which forms sell, and at what price
India’s exports by 8-digit tariff line, 2025-26. Average price = total value ÷ total quantity (TradeStat): the average of every shipment on that line, not the price of any one deal.
| Tariff line | Value 2025-26 | Change | Quantity | Average price |
|---|---|---|---|---|
Non-ionic (other organic surface active agents, whether or not put up for retail sale)3402 42 00 · Organic surface-active agents, non-ionic, whether or not put up for retail sale | US$ 192 mn | ↓-1% | 89,108 tonnes | US$ 2.16 per kgwas US$ 2.14 |
Linear alkylbenzenesulphonic acids and their salts (anionic organic surface active agents, whether or not put up for retail sale)3402 31 00 · Anionic organic surface-active agents, linear alkylbenzene sulphonic acids and their salts, whether or not… | US$ 133 mn | ↓-9.3% | 99,027 tonnes | US$ 1.34 per kgwas US$ 1.26 |
Others-of-others-of-orgnc surface-actv agents(other thn soap)other washing prpns whether or not containing soap other than those of heading no 33402 39 00 · Anionic organic surface-active agents, other than linear alkylbenzene sulphonic acids and their salts… | US$ 121 mn | ↑+7.9% | 61,295 tonnes | US$ 1.98 per kgwas US$ 1.74 |
Other soap and orgnc surface active productfor tiolet use (including medicated prdcts)3401 11 90 · Soap and organic surface-active products, in the form of bars, cakes, moulded shapes, and paper, wadding… | US$ 81 mn | ↓-1.2% | 28,366 tonnes | US$ 2.85 per kgwas US$ 2.85 |
Other (other preparations) not elsewhere specified3402 90 99 · Washing and cleaning preparations, surface-active, whether or not containing soap, including auxiliary… | US$ 62.6 mn | ↑+27.5% | 29,301 tonnes | US$ 2.14 per kgwas US$ 2.22 |
Others-of-others-of-orgnc surface-actv agents(other thn soap)other washing prpns whether or not containing soap other than those of heading no 33402 49 00 · Organic surface-active agents, whether or not put up for retail sale in item no. 3402 | US$ 55.8 mn | ↑+13.9% | 38,564 tonnes | US$ 1.45 per kgwas US$ 1.32 |
Preparations put up for retail sale (other organic surface active agents)3402 50 00 · Washing and cleaning preparations, powders, flakes and granules, surface-active, whether or not containing… | US$ 29.5 mn | ↓-7.7% | 13,668 tonnes | US$ 2.16 per kgwas US$ 2.60 |
Other organic surface-active prod(toilet)3401 30 19 · Organic surface-active products and preparations for washing the skin, in the form of liquid or cream and… | US$ 24.4 mn | ↓-8.5% | 10,551 tonnes | US$ 2.32 per kgwas US$ 2.38 |
Washing and cleaning preparations having basis of soap/other organic surface active(synthetic detergents)3402 90 11 · Washing and cleaning preparations, surface-active, whether or not containing soap, including auxiliary… | US$ 19 mn | ↑+2.3% | 23,402 tonnes | US$ 0.81 per kgwas US$ 0.79 |
Soap and organic surface-active products, in the form of bars, cakes, moulded shapes, and paper, wadding… — medicated soaps3401 11 10 | US$ 15.8 mn | ↑+7.6% | 4,767 tonnes | US$ 3.32 per kgwas US$ 3.10 |
Other organic surface-active product not elsewhere specified3401 30 90 · Organic surface-active products and preparations for washing the skin, in the form of liquid or cream and… | US$ 15.6 mn | ↓-6.5% | 4,237 tonnes | US$ 3.67 per kgwas US$ 4.24 |
Other (synthetic detergents)3402 90 19 · Washing and cleaning preparations, surface-active, whether or not containing soap, including auxiliary… | US$ 9.1 mn | ↑+16.9% | 7,029 tonnes | US$ 1.30 per kgwas US$ 1.60 |
Soap, in forms in item no. 3401.11 — soap in other forms3401 20 00 | US$ 6.9 mn | ↓-3.4% | 4,490 tonnes | US$ 1.53 per kgwas US$ 1.53 |
Cationic (other organic surface active agents, whether or not put up for retail sale)3402 41 00 · Organic surface-active agents, cationic, whether or not put up for retail sale | US$ 6.7 mn | ↑+29.3% | 2,724 tonnes | US$ 2.44 per kgwas US$ 2.53 |
The world market
Each country’s own recorded exports and imports in UN Comtrade, 2023 (the latest year nearly every country has reported).
- World imports
- US$ 52.2 bn 2023
- India among exporters
- #20 of 164 countries
- India’s share of world exports
- 1.4% US$ 759 mn
- Left for others to win
- US$ 52.6 bn exported by other countries
Top exporters — your competitors
- 1GermanyUS$ 5.61 bn 10.5%
- 2USAUS$ 4.83 bn 9.1%
- 3ChinaUS$ 4.75 bn 8.9%
- 4FranceUS$ 3.06 bn 5.7%
- 5ItalyUS$ 2.63 bn 4.9%
- 6PolandUS$ 2.62 bn 4.9%
- 7NetherlandsUS$ 2.45 bn 4.6%
- 8United KingdomUS$ 1.82 bn 3.4%
- 9BelgiumUS$ 1.81 bn 3.4%
- 10SpainUS$ 1.74 bn 3.3%
Biggest buyers in the world
- 1GermanyUS$ 3.98 bn 7.6%
- 2USAUS$ 3.59 bn 6.9%
- 3FranceUS$ 2.68 bn 5.1%
- 4ChinaUS$ 2.67 bn 5.1%
- 5United KingdomUS$ 2.42 bn 4.6%
- 6CanadaUS$ 2.38 bn 4.6%
- 7NetherlandsUS$ 1.83 bn 3.5%
- 8PolandUS$ 1.3 bn 2.5%
- 9ItalyUS$ 1.23 bn 2.4%
- 10BelgiumUS$ 1.11 bn 2.1%
Opportunity: what these countries buy from the world, and from India
Each country’s own recorded imports in UN Comtrade, latest year it has reported. The long light part of each bar is demand other countries are filling today.
TradeStat’s 2023-24 quantities are double-counted, so that year is left out of the price. Sources: TradeStat — Export Import Data Bank, Department of Commerce · UN Comtrade database (United Nations Statistics Division) · Figures taken 29 October 2026.
Step by step
How to export soaps and detergents
India has a large soap and detergent industry, from multinational plants to thousands of small makers, and exports mainly to the Gulf, neighbouring countries and the diaspora. Germany, the USA, China, Turkey and Indonesia lead world trade in soaps and detergents. Demand comes from population growth and hygiene awareness in Africa and Asia, interest in herbal and handmade soaps in Western markets, and industrial demand for surfactants. Openings are in herbal and ayurvedic-style soaps, laundry bars for African markets and surfactants for Asian detergent makers.
- 01Pick the product
Herbal toilet soap, laundry bar, detergent powder or surfactant.
- 02Fix specification
TFM, weight, fragrance and packaging with the buyer.
- 03Test
TFM, moisture and free alkali at an NABL lab; stability.
- 04Register where needed
EU CPNP for toilet soaps; Gulf product registration.
- 05Print and pack
Multilingual wrappers; shrink packs and cartons.
- 06Ship and claim
File the shipping bill; claim RoDTEP and drawback.
- 07Payment
Advance or LC; FMCG distributors may ask for credit later — use ECGC cover.
Meet buyers
Trade fairs
- Usually October — check datesBeautyworld Middle EastDubai, UAEbeautyworldme.com ↗
- Usually March — check datesCosmoprof Worldwide BolognaBologna, Italycosmoprof.com ↗
- Usually April — check datesin-cosmetics GlobalEurope (city changes)in-cosmetics.com ↗
- Spring (April–May) and autumn (October–November) — check datesChina Import and Export Fair (Canton Fair)Guangzhou, Chinacantonfair.org.cn ↗
Questions
Questions about exporting soaps and detergents
Is soap a cosmetic?
What is TFM?
Which council?
What RoDTEP applies?
Can I call my soap "antibacterial"?
Sources (6)
- European Commission — Cosmetics (Regulation (EC) No 1223/2009)
- EUR-Lex — Regulation (EC) No 648/2004 on detergents
- CHEMEXCIL — official site
- Bureau of Indian Standards — official site
- NABL — search for accredited testing laboratories
- DGFT — Appendix 4R, RoDTEP schedule for DTA exports w.e.f. 10.10.2024 (Notification 32/2024-25); rates continued to 31.12.2026 by Notification 41/2026-27
Who buys Indian soaps and detergents
All countries → CEPAAEDAbu DhabiUnited Arab EmiratesIndia's biggest Gulf buyer and a re-export hub for the Middle East and Africa. CEPA in force since 2022.From India 2025-26US$ 37.4 bn
 USDWashington, D.C.United States of AmericaIndia's largest single-country export market. Strict FDA rules for food; extra 10% US duty on most goods since July 2026.From India 2025-26US$ 87.3 bn
 CECASGDSingaporeSingaporeDuty-free trading hub for South-East Asia. Strict food licensing by SFA; big Indian community.From India 2025-26US$ 11.9 bn
 SAFTANPRKathmanduNepalOpen land border, rupee payments and a market that relies on Indian goods — an easy first market by road.From India 2025-26US$ 7.45 bn
 SARRiyadhSaudi ArabiaLarge Gulf market for rice, food and engineering goods. Strict SFDA food rules and SABER certification for regulated goods.From India 2025-26US$ 10.3 bn
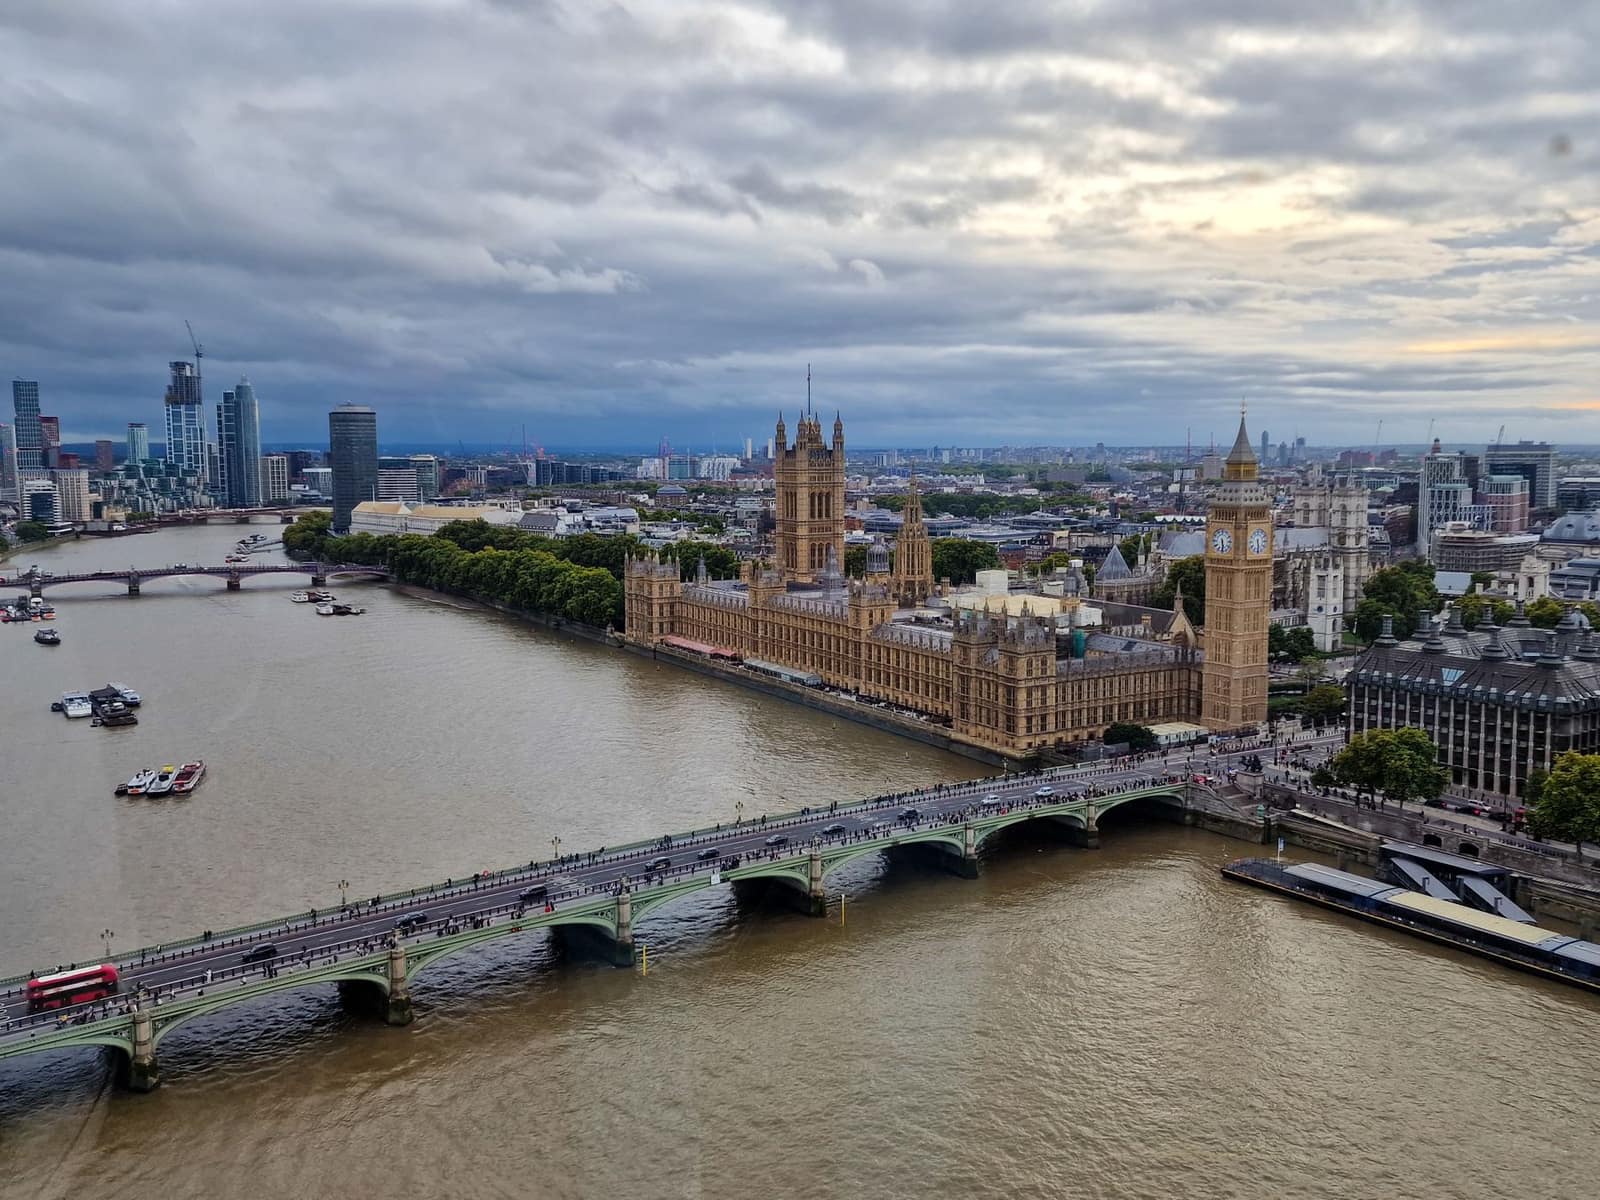 CETAGBPLondonUnited KingdomNew CETA in force since July 2026 — most Indian goods now enter duty-free. Strong market for garments, food and engineering.From India 2025-26US$ 13.4 bn
 AITIGAIDRJakartaIndonesiaWorld's fourth most populous country. Buys Indian vehicles, steel, chemicals, groundnuts and meat; halal and BPOM rules for food.From India 2025-26US$ 4.49 bn
 SAFTABDTDhakaBangladeshBig neighbour market for cotton, yarn, food and machinery. Mostly LC-based; land and sea routes.From India 2025-26US$ 10.6 bn
More in pharma & chemicals
All products → Free to exportPharma & chemicalsGeneric medicines (formulations)Tablets, capsules and injectables; every market needs product registration. The USA buys the most.HS3004Exports 2025-26US$ 21.9 bn ↓0.7%
 Free, with conditionsPharma & chemicalsAyurvedic and herbal productsAyurvedic medicines, supplements and herbal cosmetics; register with AYUSHEXCIL and the buyer's regulator.HS3004.90Exports 2025-26US$ 176 mn ↑7.1%
 Free, with conditionsPharma & chemicalsEssential oilsMint, lemongrass, vetiver and other oils for flavour, fragrance and aromatherapy buyers; the USA leads.HS3301Exports 2025-26US$ 899 mn ↓3.3%
 Free to exportPharma & chemicalsSpice oils and oleoresinsConcentrated flavour and colour extracts for food, nutraceutical and pharma makers. India is the world leader; the USA is the biggest buyer.HS3301.90Exports 2025-26US$ 543 mn ↓1.4%