

Engineering goods
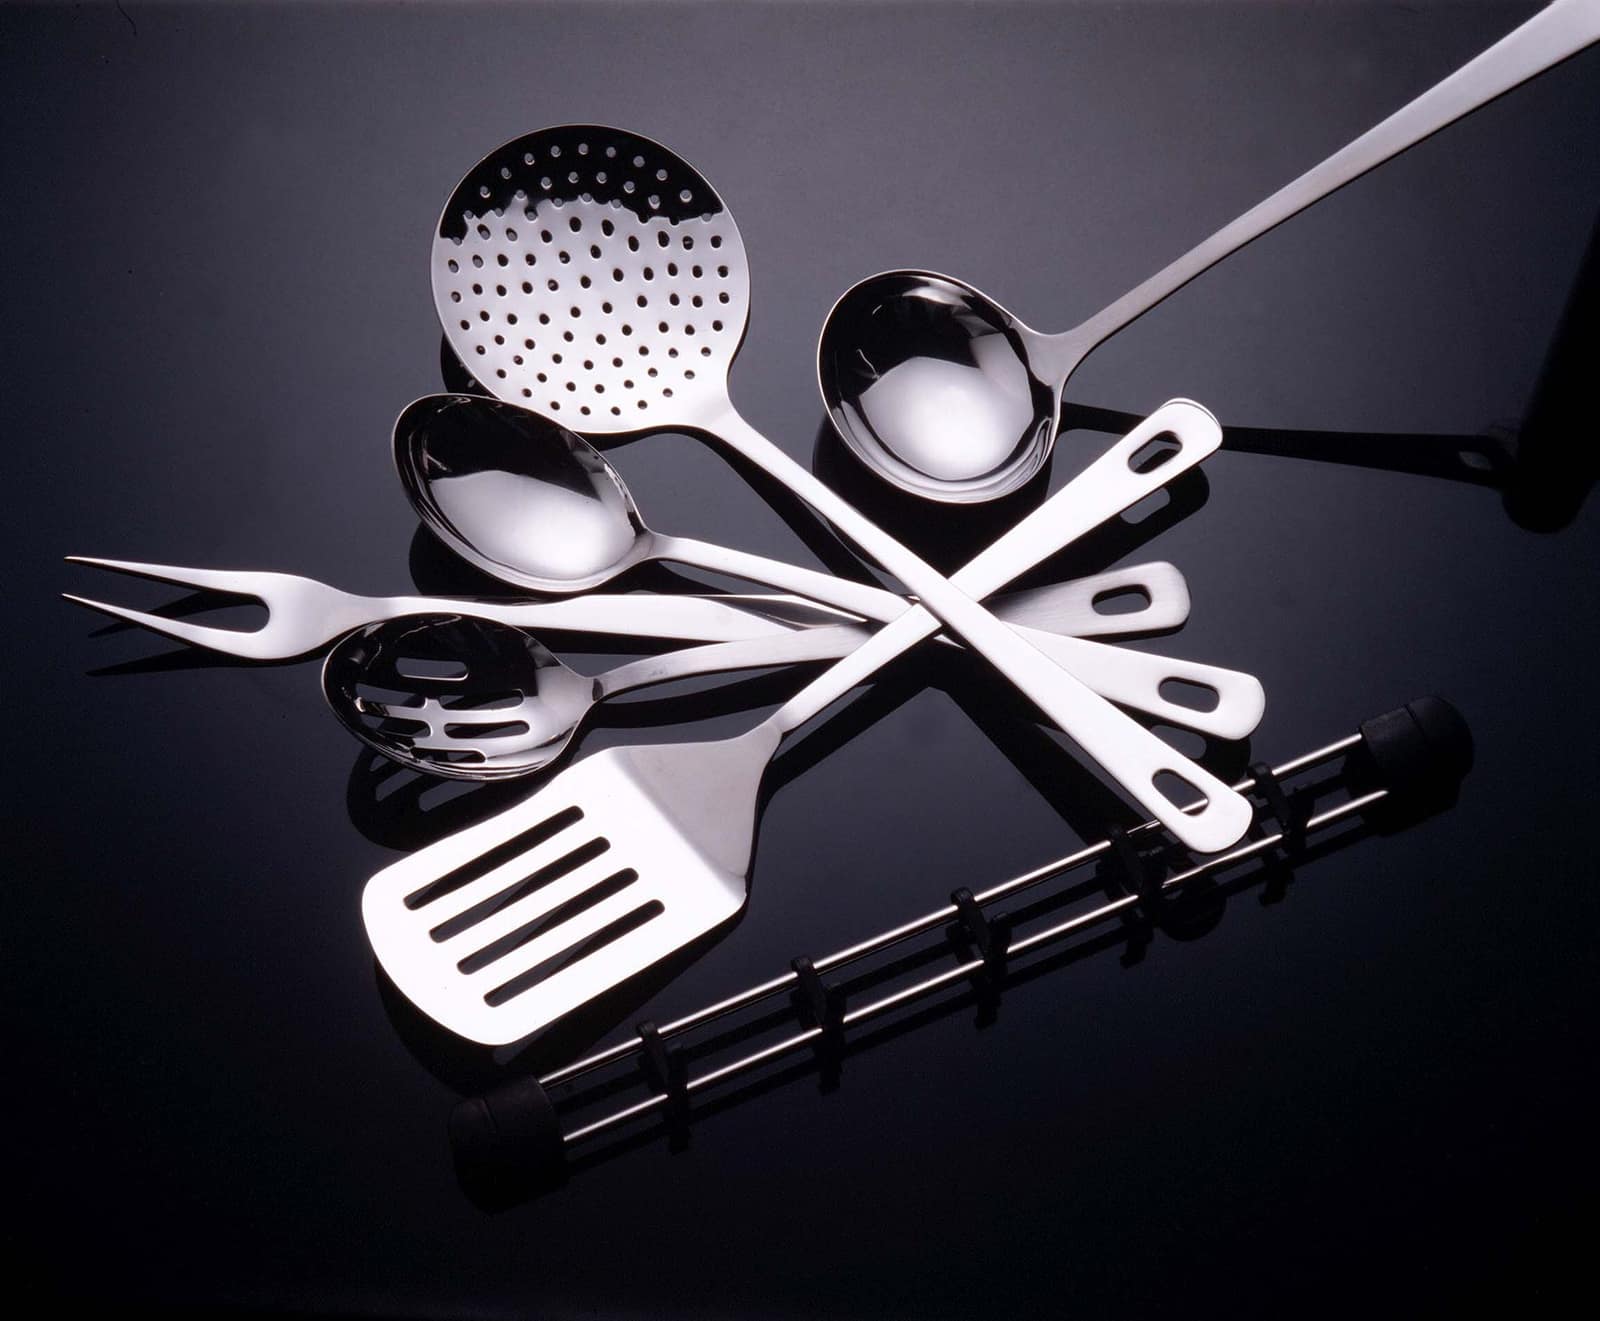
Export stainless steel utensils
Cookware, tableware and kitchen tools in stainless steel; the USA, UAE, Saudi Arabia and UK buy the most.
- HS code
- 7323 Table, kitchen and other household articles of iron or steel; stainless steel utensils are sub-heading 7323.93.
- Export policy
- Free to export Free to export under ITC(HS) Schedule 2 as checked in November 2026. No licence is needed for household utensils. Confirm your exact 8-digit line on the DGFT ITC(HS) search before you ship.
- Registrations
- 3 IEC, GST and those below
- India’s exports, 2025-26
- US$ 528 mn to 151 countries
What is exported
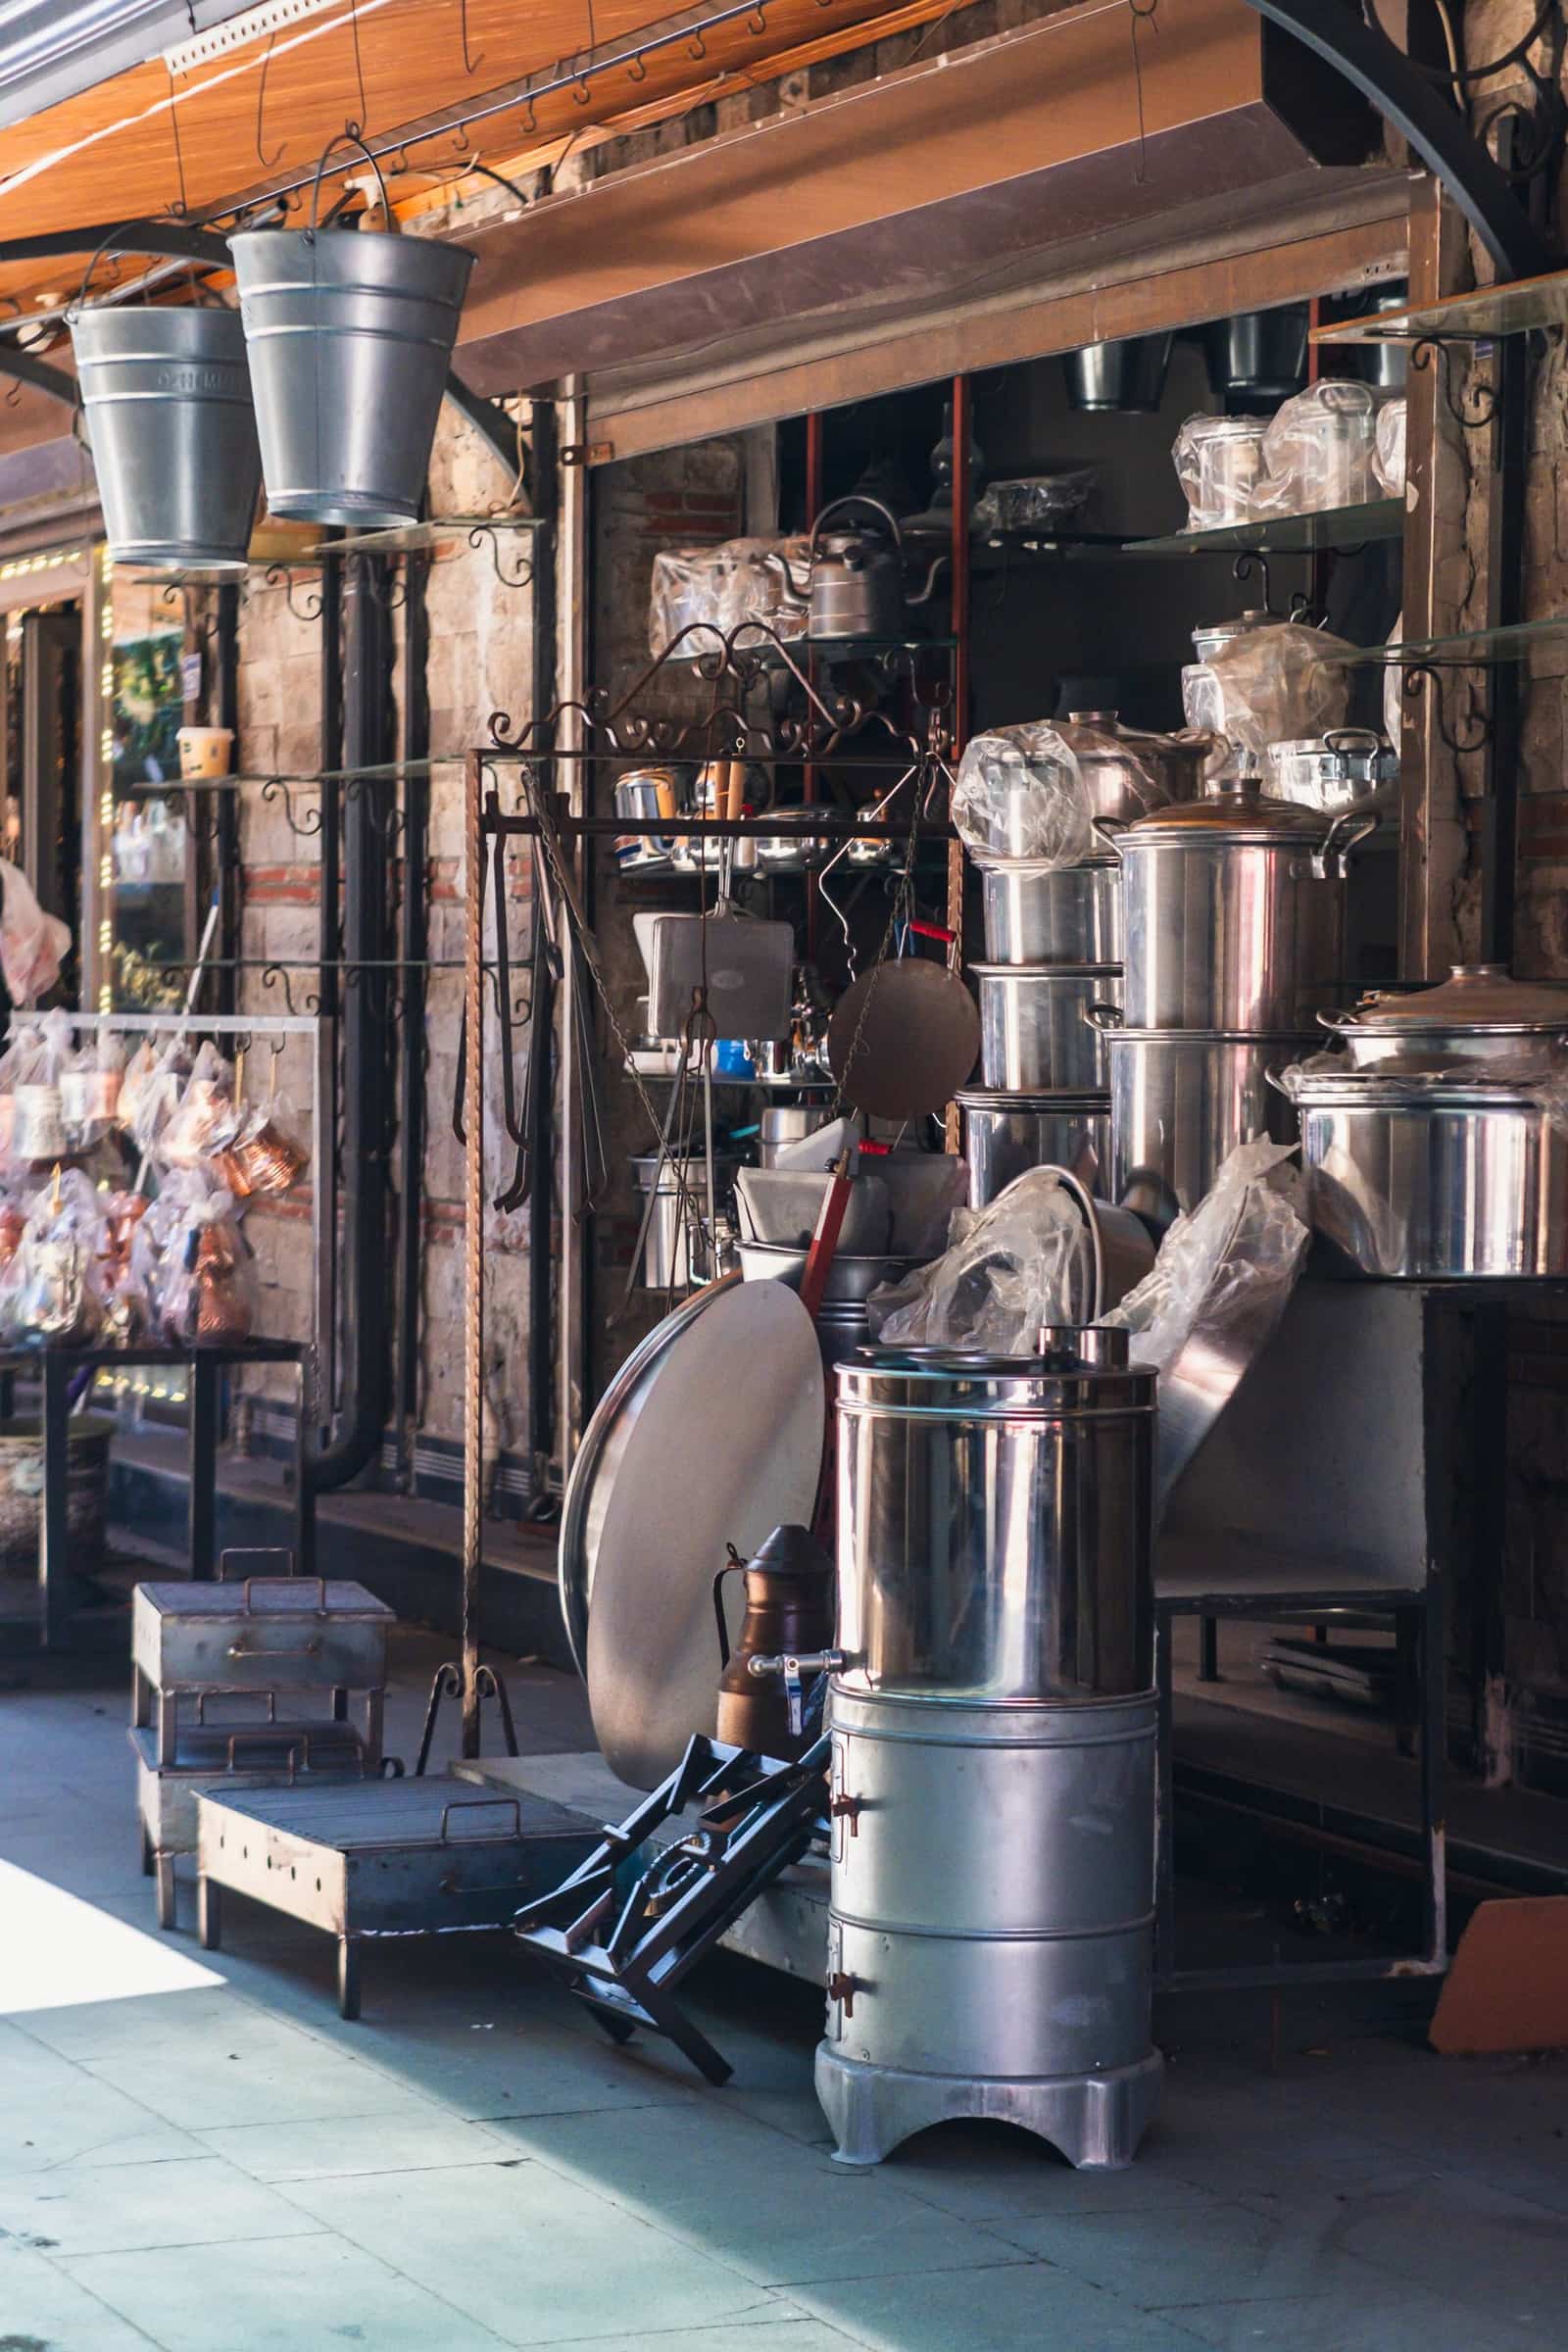
India exports stainless steel cookware, tiffins, thalis, bowls, pressure cookers and hotel ware, mostly from Jagadhri, Mumbai–Thane, Delhi NCR and Ahmedabad. Buyers are retail chains, kitchenware brands and hotel suppliers. In 2025-26 India exported about US$ 528 million under HS 7323; the USA led, followed by the UAE, Saudi Arabia, the UK and the Netherlands.
Varieties, grades and forms
- CookwareSaucepans, kadhais, tri-ply and sandwich-bottom pots, pressure cookers.
- Tableware and servewareThalis, bowls, tumblers, buffet and hotel ware.
- Lunch boxes and storageTiffins, canisters, bottles and flasks.
- Kitchen tools and sinksLadles, strainers, graters; sinks are a separate line (7324).
Where it is grown or made
- HaryanaJagadhri (Yamunanagar) — utensil cluster
- MaharashtraMumbai–Thane and Bhiwandi
- Delhi NCRDelhi, Faridabad and Ghaziabad
- GujaratAhmedabad and Rajkot
The quality buyers ask for
- Steel grade
- AISI 304 (18/8) for food-contact premium ranges; 201 or 430 for budget lines — always state the grade
- Gauge / thickness
- Sheet thickness in mm as agreed (for example 0.6–1.0 mm), checked by micrometer
- Finish
- Mirror, satin or matt; no pits, scratches or weld marks on visible surfaces
- Base
- Induction-compatible (magnetic) base where the buyer asks for it; sandwich or tri-ply construction
- Food-contact migration
- Metal release within the limits the buyer applies (EU CoE guidance on metals and alloys is widely used)
Certificates
- EU food-contact declaration of complianceRequiredRequired for kitchenware sold in the EU under Regulation (EC) 1935/2004.
- Mill test certificateOften askedShows the steel grade and chemistry; buyers ask for it with each lot.
- ISO 9001Often askedBasic quality system expected by retail buyers.
- Social compliance audit (for example BSCI or SMETA)Often askedMany European and US retailers require it before listing a supplier.
Shipping, storage and shelf life
Cartons on pallets or floor-loaded; a 40-ft container typically takes about 1,200–2,000 cartons depending on nesting. Utensils fill space before weight.
Sea freight; LCL for first orders.
Dry warehouse; silica gel and anti-tarnish wrapping against sea humidity.
What goes on the pack and carton
- Steel grade, product name, size or capacity, country of origin and care instructions.
- EU: the "glass and fork" food-contact symbol (or "for food contact") and the name and address of the EU business responsible.
- Barcode (EAN/UPC) on each retail box.
Use an NABL-accredited lab for food-contact migration and metal-release tests (search 'food contact' or 'metals' in the NABL directory). Grade can be checked by any NABL metallurgical lab with spectro analysis.
Benefits of exporting this product
- RoDTEP: 0.9% of FOB
Tariff item 7323 93 90 (other table and kitchen articles of stainless steel) earns 0.9% of FOB value, with no rupee cap, as a duty credit scrip on ICEGATE. Stainless steel pressure cookers (7323 93 10) also carry 0.9%. These rates continue to 31 Dec 2026 (DGFT Notification 41/2026-27). Confirm your exact 8-digit line on the DGFT RoDTEP page before you price an order.
DGFT — Appendix 4R, RoDTEP schedule for DTA exports w.e.f. 10.10.2024 (Notification 32/2024-25); rates continued to 31.12.2026 by Notification 41/2026-27 ↗ - Duty drawback: 1.5% of FOB
Drawback item 732301 (utensils of stainless steel) has an All Industry Rate of 1.5% of FOB, paid into your bank account. It is not available on exports under Advance Authorisation or from EOU/SEZ units. Check the current schedule on the CBIC drawback page before shipping.
Gazette of India — Notification 77/2023-Customs (N.T.) dated 20.10.2023: All Industry Rates of duty drawback ↗ - Zero duty into the UK (CETA)
The India-UK CETA came into force on 15 July 2026 and gives zero-duty access to nearly 99% of India's exports; the Commerce Ministry named engineering goods among the sectors that gain. Claim it with a CETA certificate of origin and check the line for your code on the UK Trade Tariff.
PIB — India-UK CETA enters into force (15 Jul 2026): zero-duty access for nearly 99% of India's exports ↗
Where to register
- EEPC IndiaPrime iron and steel products are listed under EEPC in Appendix 2T; take your RCMC from EEPC.eepcindia.org ↗
Quality and checks
- Food-contact safety: EU Regulation (EC) 1935/2004 and a declaration of compliance; US FDA food-contact rules. Buyers often ask for metal-release (nickel, chromium) tests.
- Steel grade proof (for example 304 / 18-8 or 201) with mill test certificates; magnet and spectro checks by the buyer.
- Pre-shipment inspection for finish, weight and gauge, often by a third-party agency named by the buyer.
Start with a small range (tiffins, bowls, thalis) for Indian grocery chains abroad or a Gulf distributor. Buy from a Jagadhri or Mumbai maker with mill certificates, get a food-contact test from an NABL lab, and ship a mixed LCL lot on advance payment.
Where new exporters go wrong
- Selling 201-grade steel as 304 — buyers test with spectrometers and reject or claim.
- No food-contact declaration for EU buyers; customs or retailers hold the goods.
- Scratches and rust spots from poor packing and damp containers.
Documents this product needs
Schemes that apply
- RoDTEP Remission of Duties and Taxes on Exported Products
- Drawback Duty Drawback (All Industry Rates)
- Advance Authorisation Advance Authorisation
- EPCG Export Promotion Capital Goods Scheme
- ECGC ECGC export credit insurance for small exporters
- LUT Letter of Undertaking for zero-rated exports under GST
- Status Holder Status Holder certificate (One to Five Star Export House)
- Districts as Export Hubs Districts as Export Hubs
Sources (5)
- Department of Commerce, Export Import Data Bank — India's exports of HS 7323 by country, 2025-26
- DGFT — Appendix 2T: Export Promotion Councils and the products under each
- DGFT — ITC(HS) export policy search (Schedule 2) and SCOMET list (Appendix 3)
- European Commission — Food contact materials
- EEPC India — official site
Trade data
Indian stainless steel utensils exports in numbers
From the Department of Commerce’s TradeStat, country by country. US$, Indian financial years (April–March).
- Exports in 2025-26
- US$ 528 mn +0.2% a year on average, 2020-21 to 2025-26
- Change from 2024-25
- ↓ -3.3% US$ 546 mn → US$ 528 mn
- Buyer countries
- 151
- Average export price
- US$ 2.29 per kg · 2,30,917 tonnes shipped · US$ 2.16 the year before
The price cycle
India’s average export price per kg each year (total value ÷ total quantity). Highest in 2021-22, lowest in 2020-21 — a 144% swing between them. Keep this swing in mind when you quote.
What next: a projection from the trend
The past trend carried forward — not a forecast by any authority. Sudden changes in policy, prices or demand are not in it.
Likely range US$ 443 mn to US$ 600 mn.
- Trend
- -1.8% a year
- Fit (R²)
- 0.13 — weak, read with care
- Based on
- 6 years of official figures
Method: a straight line through the logarithm of yearly exports (log-linear regression); range = ±1 standard error.
Biggest buyer countries
By value in 2025-26. Change is against 2024-25.
Where demand is rising and falling
Only countries that buy at least US$ 1 million or 1% of India’s exports of this product. Change from 2024-25 to 2025-26.
↑ High demand
↓ Low demand
- SenegalUS$ 8.9 mn → US$ 5.8 mn↓-34.1%
- MexicoUS$ 9.1 mn → US$ 6.7 mn↓-25.9%
- KenyaUS$ 6 mn → US$ 4.9 mn↓-18.5%
- ItalyUS$ 7.1 mn → US$ 6.1 mn↓-14.3%
- NetherlandsUS$ 21.1 mn → US$ 18.4 mn↓-12.7%
- United States of AmericaUS$ 166 mn → US$ 148 mn↓-11.2%
Which forms sell, and at what price
India’s exports by 8-digit tariff line, 2025-26. Average price = total value ÷ total quantity (TradeStat): the average of every shipment on that line, not the price of any one deal.
| Tariff line | Value 2025-26 | Change | Quantity | Average price |
|---|---|---|---|---|
Other houshold articl of stainless stl not elsewhere specified7323 93 90 · Steel, stainless, table, kitchen and other household articles and parts thereof | US$ 409 mn | ↓-1.8% | 148 mn pieces | US$ 2.76 per piecewas US$ 2.55 |
Other household utensils and its parts n.e.s7323 99 90 · Iron or steel, table, kitchen and other household articles and parts thereof, of iron or steel in heading… | US$ 33.2 mn | ↑+5.1% | 24.9 mn pieces | US$ 1.33 per piecewas US$ 1.36 |
Other household articles of iron n.e.s. (other than cast iron)or steel,enamelled7323 94 90 · Iron or steel, table, kitchen and other household articles and parts thereof, enamelled | US$ 28 mn | ↓-15.7% | 7.5 mn pieces | US$ 3.75 per piecewas US$ 2.85 |
Iron or steel, table, kitchen and other household articles and parts thereof, enamelled — utensils7323 94 20 | US$ 21.4 mn | ↓-13.4% | 9.6 mn pieces | US$ 2.23 per piecewas US$ 2.00 |
Other utensils of cast iron not enameld7323 91 90 · Cast iron, table, kitchen and other household articles and parts thereof, of cast iron, not enamelled | US$ 14.4 mn | ↓-22% | 5.4 mn pieces | US$ 2.69 per piecewas US$ 3.35 |
Irn/stl wool;pot scourers and scouring or polishing pads,gloves and the like7323 10 00 · Iron or steel, wool, pot scourers and scouring or polishing pads, gloves and the like | US$ 7.6 mn | ↓-2.6% | 32.9 mn pieces | US$ 0.23 per piecewas US$ 0.24 |
Steel, stainless, table, kitchen and other household articles and parts thereof — pressure cookers7323 93 10 | US$ 7 mn | ↑+7.5% | 842k pieces | US$ 8.33 per piecewas US$ 6.16 |
Iron or steel, table, kitchen and other household articles and parts thereof, of iron or steel in heading… — other utensils7323 99 20 | US$ 4.4 mn | ↓-4.6% | 969k pieces | US$ 4.52 per piecewas US$ 1.82 |
Cast iron pans,not enameld7323 91 10 · Cast iron, table, kitchen and other household articles and parts thereof, of cast iron, not enamelled | US$ 1.4 mn | ↑+52.7% | 312k pieces | US$ 4.55 per piecewas US$ 3.76 |
Other houshold articles of cast irn,enameld7323 92 00 · Cast iron, table, kitchen and other household articles and parts thereof, of cast iron, enamelled | US$ 700k | ↓-4.1% | 94k pieces | US$ 7.48 per piecewas US$ 6.94 |
Iron or steel, table, kitchen and other household articles and parts thereof, enamelled — ghamellas7323 94 10 | US$ 600k | ↑+71.4% | 368k pieces | US$ 1.63 per piecewas US$ 1.95 |
Utensils of galvanised iron7323 99 10 · Iron or steel, table, kitchen and other household articles and parts thereof, of iron or steel in heading… | US$ 560k | ↓-49.5% | 188k pieces | US$ 2.98 per piecewas US$ 3.42 |
The world market
Each country’s own recorded exports and imports in UN Comtrade, 2023 (the latest year nearly every country has reported).
- World imports
- US$ 12.2 bn 2023
- India among exporters
- #3 of 156 countries
- India’s share of world exports
- 3.3% US$ 531 mn
- Left for others to win
- US$ 15.4 bn exported by other countries
Top exporters — your competitors
- 1ChinaUS$ 10.8 bn 67.6%
- 2GermanyUS$ 736 mn 4.6%
- 3IndiaUS$ 531 mn 3.3%
- 4ItalyUS$ 370 mn 2.3%
- 5FranceUS$ 351 mn 2.2%
- 6TürkiyeUS$ 335 mn 2.1%
- 7USAUS$ 278 mn 1.7%
- 8NetherlandsUS$ 259 mn 1.6%
- 9PolandUS$ 237 mn 1.5%
- 10SpainUS$ 203 mn 1.3%
Biggest buyers in the world
- 1USAUS$ 3.53 bn 28.9%
- 2GermanyUS$ 1.08 bn 8.9%
- 3FranceUS$ 478 mn 3.9%
- 4JapanUS$ 459 mn 3.8%
- 5United KingdomUS$ 431 mn 3.5%
- 6Rep. of KoreaUS$ 405 mn 3.3%
- 7NetherlandsUS$ 362 mn 3%
- 8CanadaUS$ 328 mn 2.7%
- 9SpainUS$ 306 mn 2.5%
- 10PolandUS$ 288 mn 2.4%
Opportunity: what these countries buy from the world, and from India
Each country’s own recorded imports in UN Comtrade, latest year it has reported. The long light part of each bar is demand other countries are filling today.
TradeStat’s 2023-24 quantities are double-counted, so that year is left out of the price. Sources: TradeStat — Export Import Data Bank, Department of Commerce · UN Comtrade database (United Nations Statistics Division) · Figures taken 29 October 2026.
Step by step
How to export stainless steel utensils
India is a long-standing exporter of stainless steel kitchenware, strong in traditional Indian shapes and in hotel and catering ware. China is the largest competitor on price and volume, with Vietnam, Thailand and Turkey also active. Demand comes from diaspora grocery chains, Western retailers moving away from single-country sourcing, and hotel and catering suppliers in the Gulf. Openings are in tri-ply cookware, insulated bottles and lunch boxes, and private-label ranges for supermarkets.
- 01Choose range and market
Pick 20–40 items that fit the buyer type (diaspora grocery, retail, hotel).
- 02Find a maker
Visit Jagadhri or Mumbai units; check grade with a magnet and spectro report.
- 03Test
Get a food-contact migration test from an NABL lab for EU or US buyers.
- 04Sample and price
Send samples; quote FOB with steel price validity of a few days.
- 05Inspect and pack
Pre-shipment inspection for finish and weight; pack with dividers and silica gel.
- 06Ship and claim
File the shipping bill with the right 8-digit code; claim RoDTEP and drawback.
- 07Payment
Advance or LC for new buyers; open account only after repeat orders.
Meet buyers
Trade fairs
- February, every year — check datesAmbienteFrankfurt, Germanyambiente.messefrankfurt.com ↗
- Usually April — check datesHKTDC Home InStyle (housewares)Hong Konghktdc.com ↗
- Twice a year, spring and autumn — check datesIHGF Delhi Fair (EPCH)Greater Noida, Indiaihgfdelhifair.in ↗
- Spring (April–May) and autumn (October–November) — check datesChina Import and Export Fair (Canton Fair)Guangzhou, Chinacantonfair.org.cn ↗
Questions
Questions about exporting stainless steel utensils
Is 201 steel allowed for export?
Do I need BIS certification to export?
Which council do I join?
How do I prevent rust spots in transit?
What RoDTEP rate applies?
Sources (5)
- EEPC India — official site
- European Commission — Food contact materials
- NABL — search for accredited testing laboratories
- Bureau of Indian Standards — official site
- DGFT — Appendix 4R, RoDTEP schedule for DTA exports w.e.f. 10.10.2024 (Notification 32/2024-25); rates continued to 31.12.2026 by Notification 41/2026-27
Who buys Indian stainless steel utensils
All countries → USDWashington, D.C.United States of AmericaIndia's largest single-country export market. Strict FDA rules for food; extra 10% US duty on most goods since July 2026.From India 2025-26US$ 87.3 bn
 CEPAAEDAbu DhabiUnited Arab EmiratesIndia's biggest Gulf buyer and a re-export hub for the Middle East and Africa. CEPA in force since 2022.From India 2025-26US$ 37.4 bn
 SARRiyadhSaudi ArabiaLarge Gulf market for rice, food and engineering goods. Strict SFDA food rules and SABER certification for regulated goods.From India 2025-26US$ 10.3 bn
 CETAGBPLondonUnited KingdomNew CETA in force since July 2026 — most Indian goods now enter duty-free. Strong market for garments, food and engineering.From India 2025-26US$ 13.4 bn
 EURAmsterdamNetherlandsEurope's main gateway: Rotterdam handles goods for the whole EU. EU food-safety and residue rules apply.From India 2025-26US$ 17.5 bn
 EURBerlinGermanyEurope's largest economy and India's biggest EU partner. Values quality, certificates and supply-chain transparency.From India 2025-26US$ 11.5 bn
 ECTAAUDCanberraAustraliaZero duty on all Indian goods since Jan 2026 — but some of the world's strictest biosecurity rules.From India 2025-26US$ 7.28 bn
 EURParisFranceFashion, food and design market. EU rules plus French-language labels; SIAL Paris is a key food fair.From India 2025-26US$ 7.1 bn
More in engineering goods
All products → Free to exportEngineering goodsAuto parts and componentsOEM and aftermarket vehicle parts; the USA, Germany and Italy buy most, with strong demand in Latin America.HS8708Exports 2025-26US$ 7.64 bn ↑1.8%
 Free to exportEngineering goodsIron and steel castingsGrey and ductile iron and steel castings from Kolhapur, Rajkot, Coimbatore and Howrah; the USA leads.HS7325Exports 2025-26US$ 1.25 bn ↑3.2%
 Free to exportEngineering goodsHand toolsHammers, wrenches, pliers and garden tools from Jalandhar and Ludhiana; the USA buys most.HS8205Exports 2025-26US$ 161 mn ↓7%
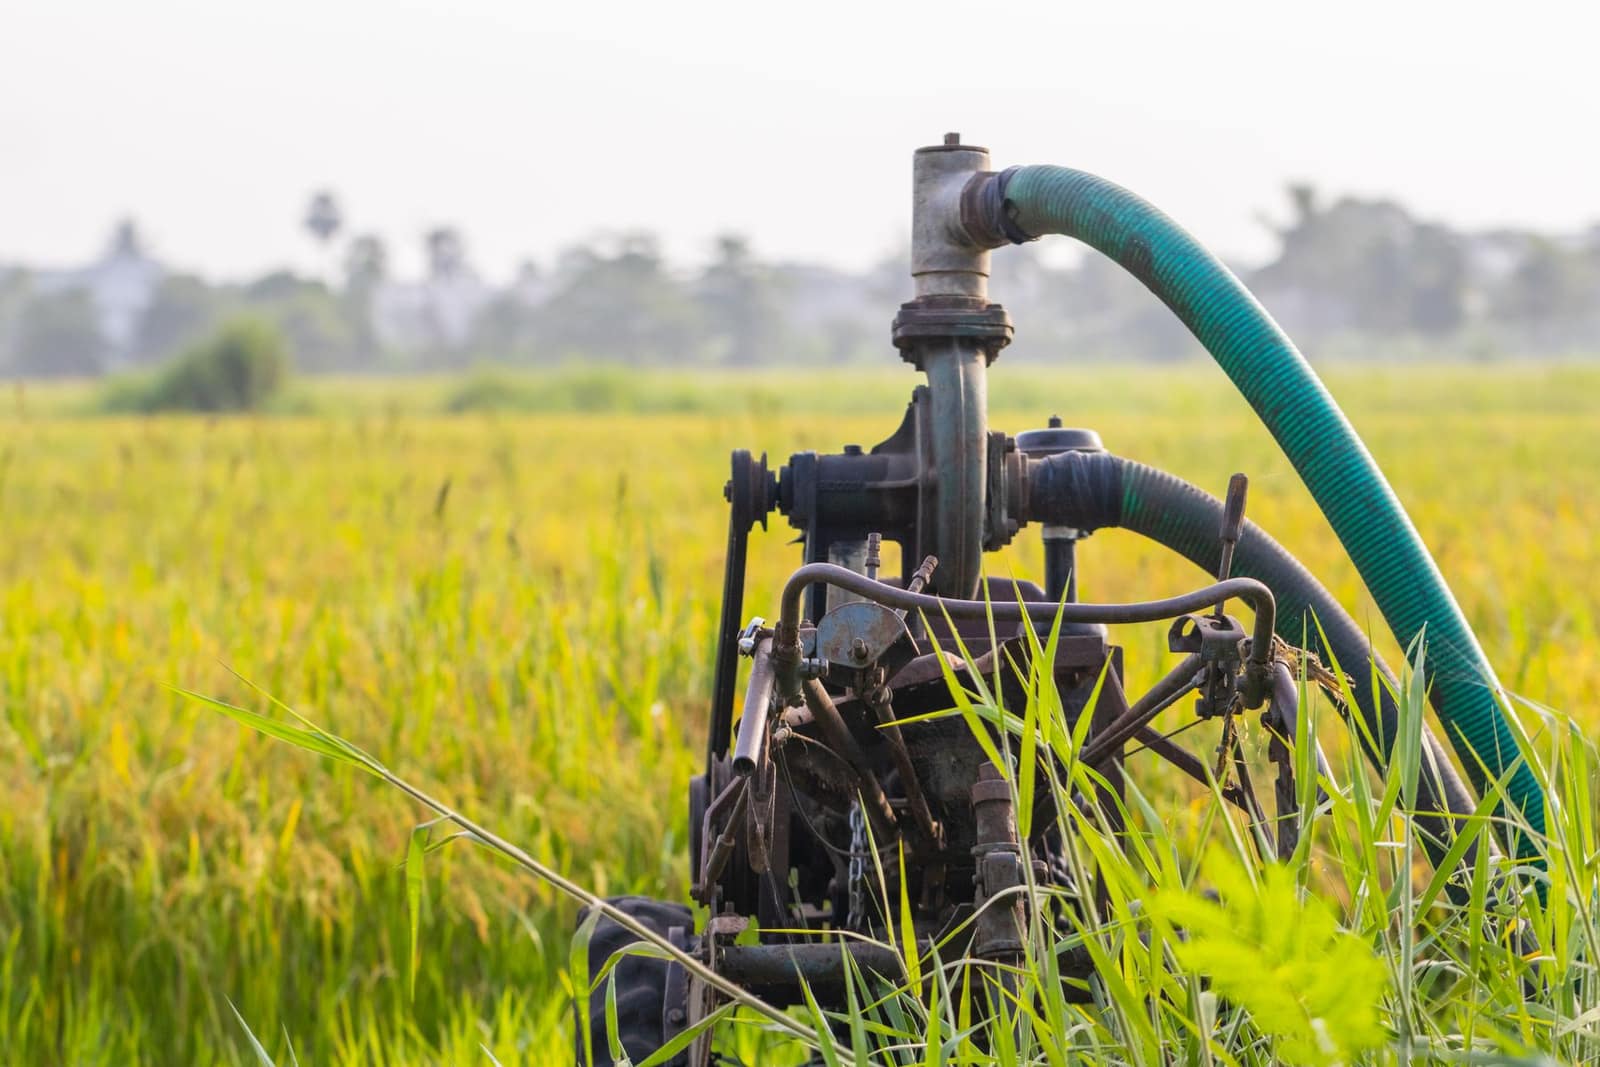 Free to exportEngineering goodsPumpsAgricultural, domestic and industrial pumps from Coimbatore, Rajkot and Ahmedabad; the USA leads.HS8413Exports 2025-26US$ 1.6 bn ↑5.2%