

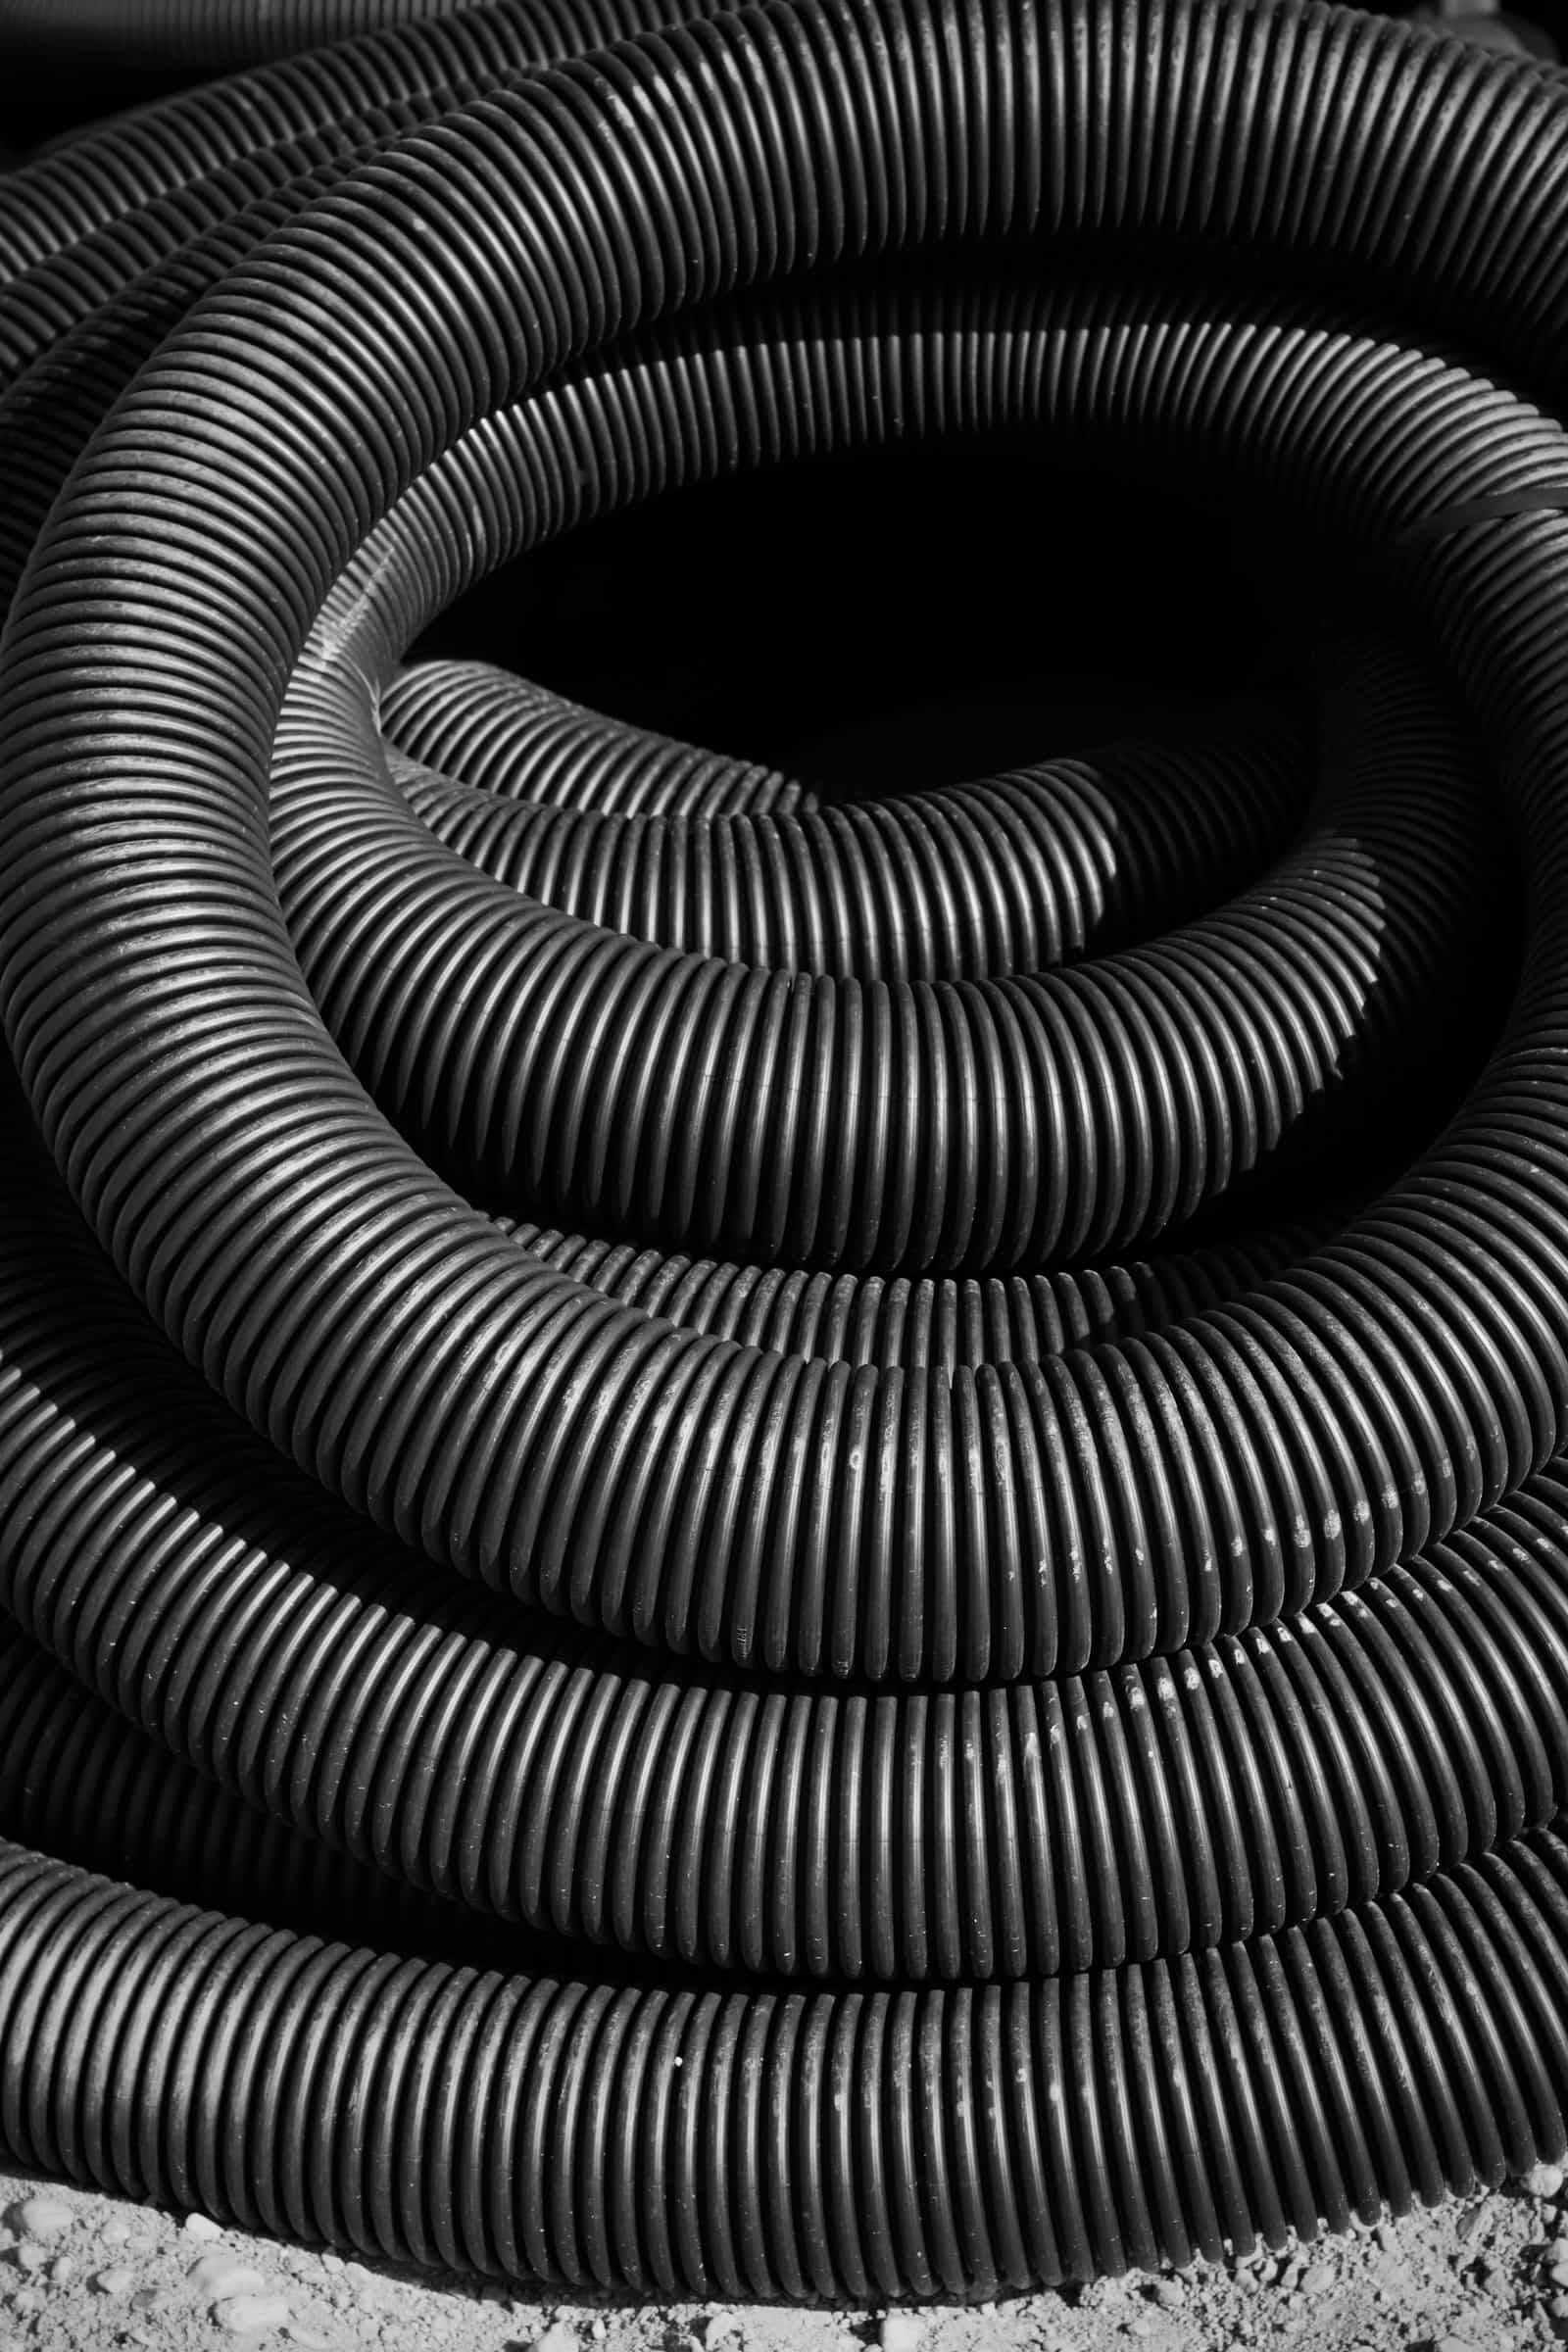
Other goods
Export rubber products (belts, hoses, seals)
Hoses, belts, seals and moulded rubber parts for vehicles and industry; the USA and Germany lead.
- HS code
- 4009 Rubber tubes, pipes and hoses (4009); conveyor and transmission belts (4010); other articles such as gaskets, seals, O-rings, mountings and mats (4016).
- Export policy
- Free to export Free to export under ITC(HS) Schedule 2 as checked in November 2026. No licence is needed for ordinary rubber articles. Confirm your exact 8-digit line on the DGFT ITC(HS) search before you ship.
- Registrations
- 3 IEC, GST and those below
- India’s exports, 2025-26
- US$ 1.2 bn to 165 countries
What is exported
India makes hoses, V-belts, conveyor belts, seals, gaskets and moulded parts in Kerala, Punjab (Jalandhar, Ludhiana), Gujarat, Maharashtra, Tamil Nadu and West Bengal, many as suppliers to vehicle and machinery makers. In 2025-26 India exported about US$ 276 million of hoses (HS 4009), led by the USA, Germany and the UK, and about US$ 720 million of other rubber articles (4016), led by the USA, Germany and the Netherlands.
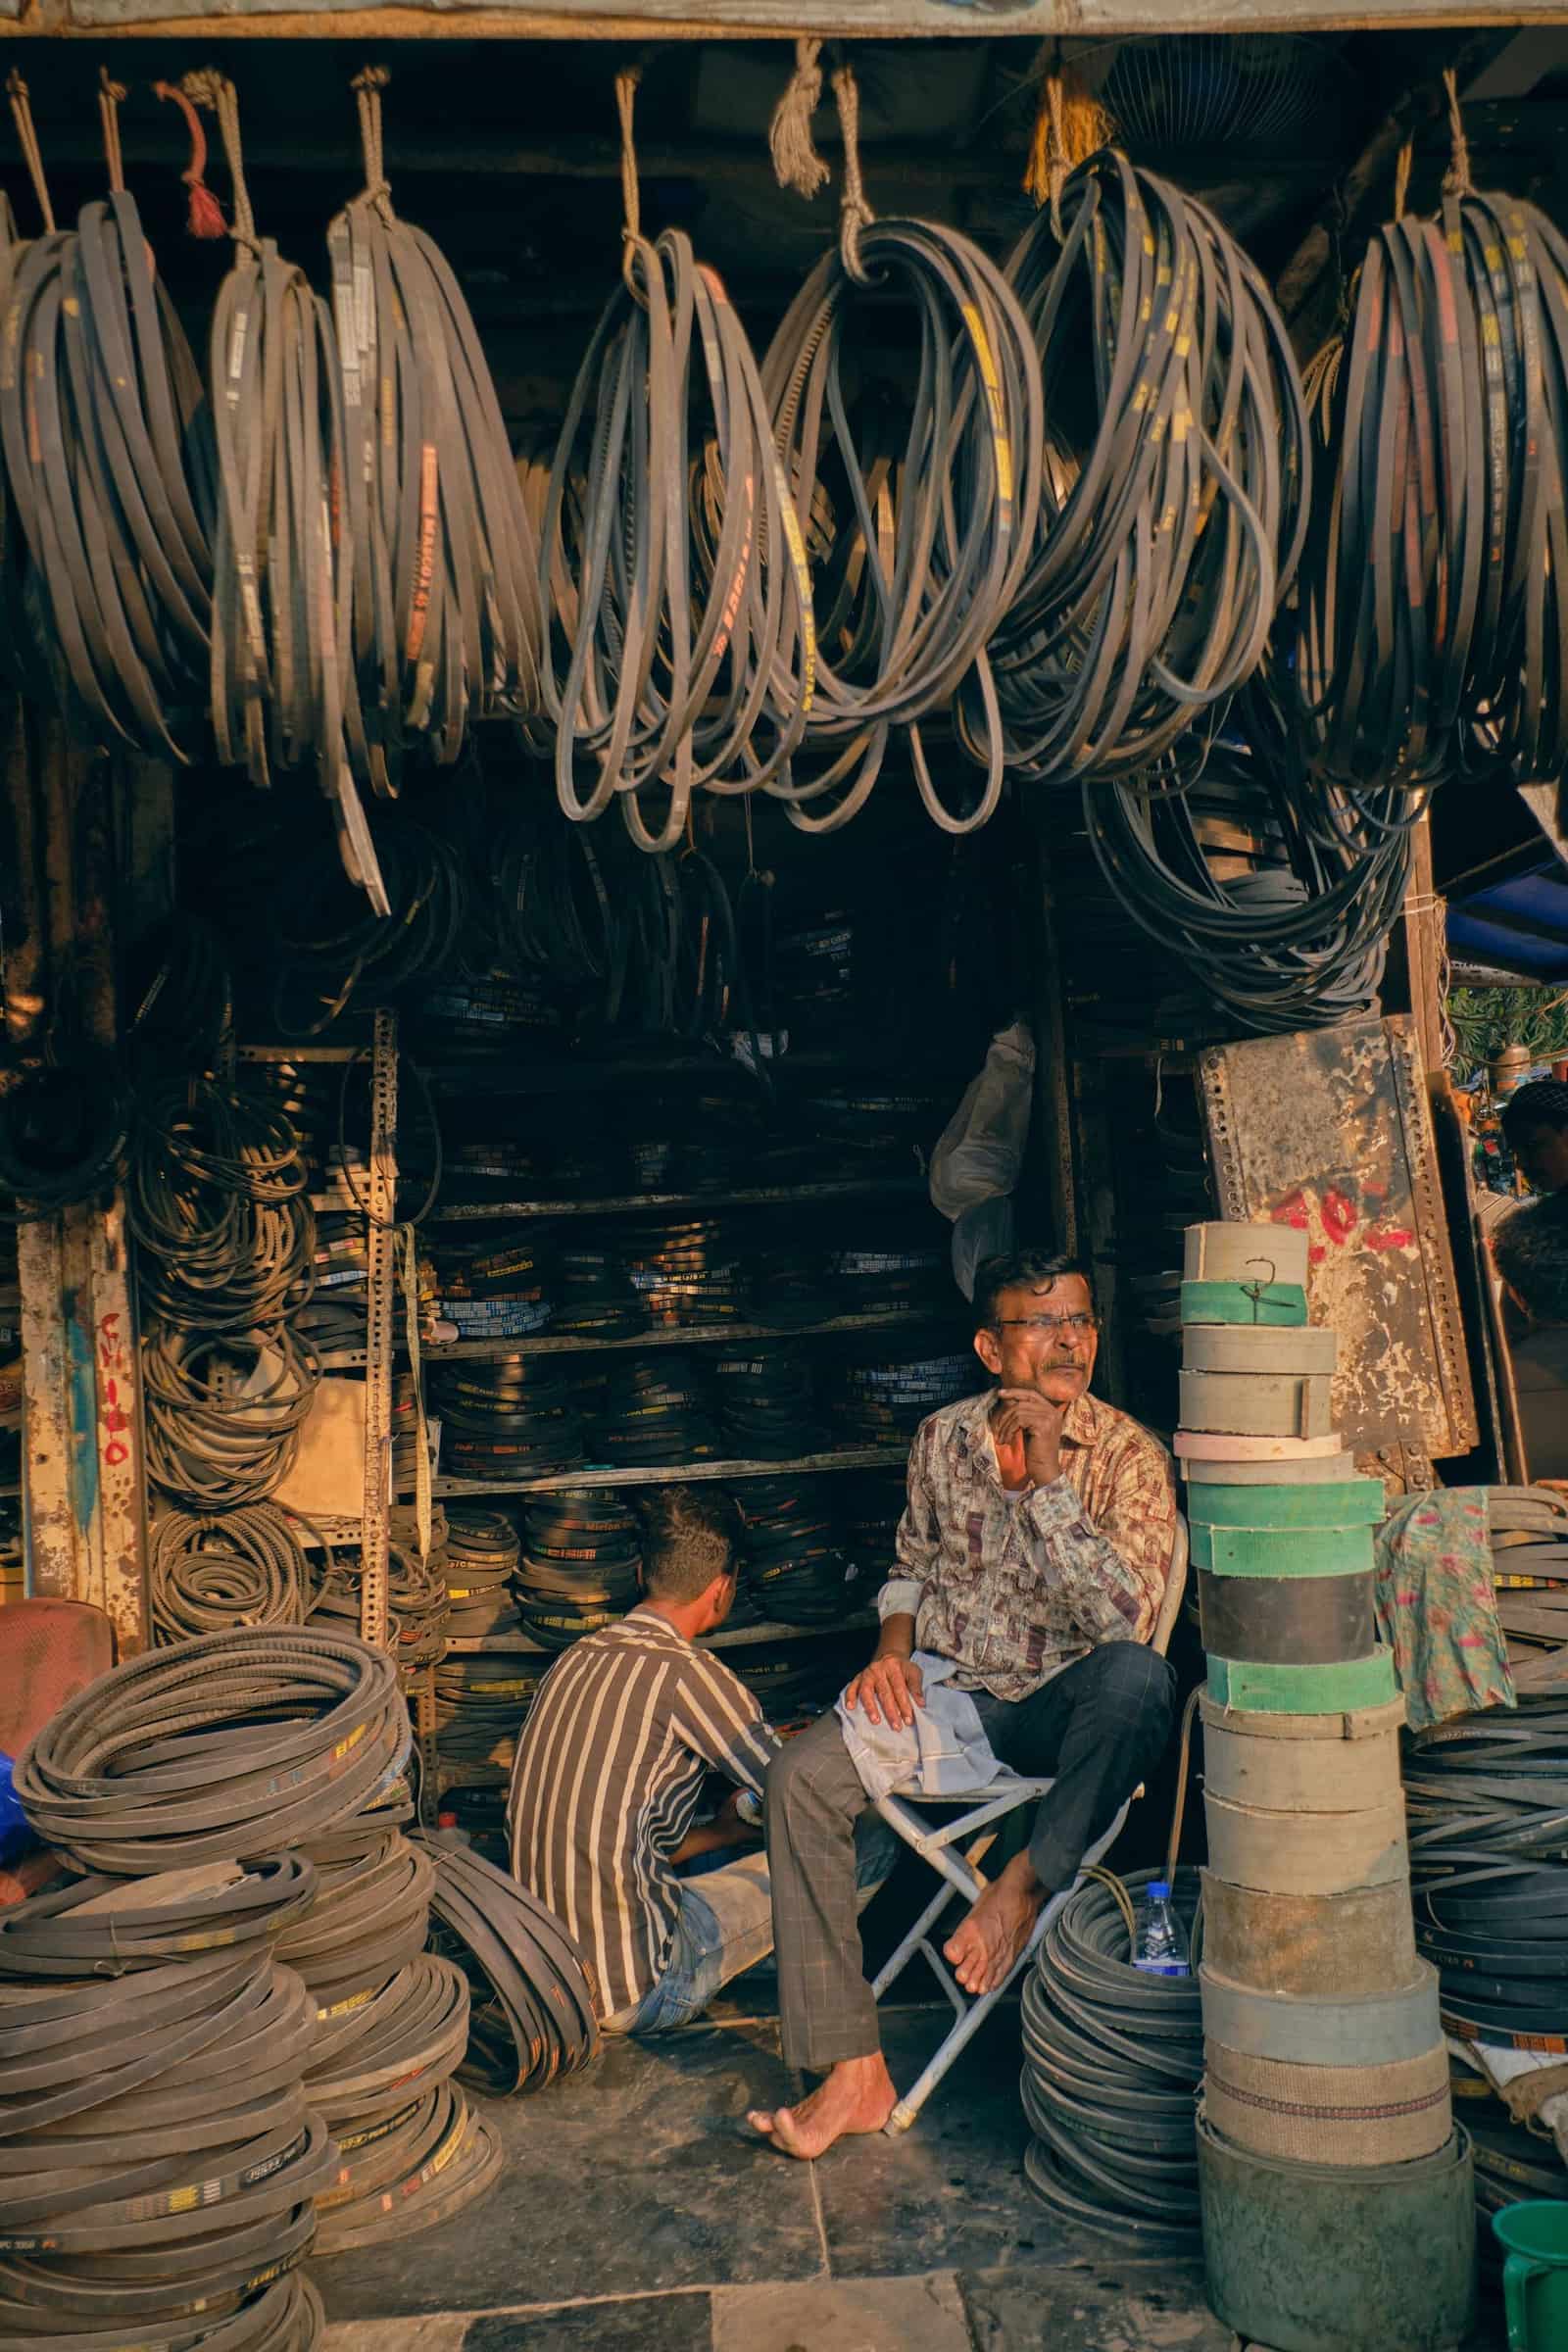
Varieties, grades and forms
- HosesHydraulic, automotive, garden, LPG and industrial hoses.
- BeltsV-belts, conveyor belts and transmission belts.
- Seals, gaskets and O-ringsMoulded and extruded sealing parts.
- Anti-vibration mounts and moulded partsBushes, mounts, rubber-to-metal bonded parts.
- Mats and sheetsFloor mats, rubber sheets and flooring.
Where it is grown or made
- KeralaKottayam, Kochi and Thrissur
- PunjabJalandhar and Ludhiana
- Gujarat and MaharashtraAhmedabad, Rajkot; Mumbai, Pune
- Tamil Nadu and West BengalChennai; Kolkata
The quality buyers ask for
- Compound
- Polymer (NBR, EPDM, SBR, CR, silicone, FKM) chosen for fluid, temperature and ozone exposure
- Hardness
- Shore A hardness with tolerance (for example 70 ± 5)
- Hoses
- Working and burst pressure, temperature range; standards such as EN 853/856 or SAE J517 for hydraulic hoses
- Belts
- Belt section and length (V-belts per ISO 4184); conveyor belt grade, ply and cover thickness per ISO 14890 or IS 1891
- Seals
- Dimensions per ISO 3601 (O-rings) or drawing; compression set and fluid-ageing tests
Certificates
- IATF 16949Often askedQuality system required by most automotive OEMs.
- ISO 9001Often askedBasic quality system for industrial buyers.
- REACH / RoHS declarationsOften askedEU buyers ask for declarations on restricted substances.
- Food-contact or drinking-water approvalOften askedFor seals and hoses that touch food or drinking water (EU, FDA 21 CFR 177.2600, WRAS).
Shipping, storage and shelf life
Mixed cartons and coils on pallets; conveyor belts on steel or wooden drums. A 20-ft container usually suffices for first orders.
Sea freight; air for urgent OEM parts.
Store below about 25 °C, away from sunlight and ozone (ISO 2230 gives storage guidance).
What goes on the pack and carton
- Part number, material, size, cure date (quarter/year) and maker on each bag or carton.
- Hoses: lay-line printing of standard, size, pressure and date.
- Country of origin on each package.
NABL-accredited rubber and polymer labs test hardness, tensile, ageing and fluid resistance (search 'rubber' in the NABL directory). The Rubber Board's laboratories in Kottayam also offer testing.
Benefits of exporting this product
- RoDTEP: 0.9% of FOB
Tariff item 4009 11 00 (rubber tubes and hoses without fittings) earns 0.9% of FOB value, with no rupee cap, as a duty credit scrip on ICEGATE. Belts (4010) and most 4016 articles such as gaskets (4016 93 40) also carry 0.9%; hoses reinforced with other materials (4009 41/42) carry 1.3%. These rates continue to 31 Dec 2026 (DGFT Notification 41/2026-27). Confirm your exact 8-digit line on the DGFT RoDTEP page before you price an order.
DGFT — Appendix 4R, RoDTEP schedule for DTA exports w.e.f. 10.10.2024 (Notification 32/2024-25); rates continued to 31.12.2026 by Notification 41/2026-27 ↗ - Duty drawback: 1.2% of FOB
Drawback item 400901 (rubber hose of different dimensions) has an All Industry Rate of 1.2% of FOB, paid into your bank account. It is not available on exports under Advance Authorisation or from EOU/SEZ units. Moulded, extruded or metal-fitted rubber articles (401601) have 2% capped at ₹17.8/kg; belts (4010) have 1.2%. Check the current schedule on the CBIC drawback page before shipping.
Gazette of India — Notification 77/2023-Customs (N.T.) dated 20.10.2023: All Industry Rates of duty drawback ↗
Where to register
- CAPEXIL"Rubber manufactured products" are listed under CAPEXIL in Appendix 2T. Makers of vehicle parts often hold an EEPC RCMC as well.capexil.org ↗
Quality and checks
- Drawing and material specification (NBR, EPDM, neoprene, silicone, FKM), hardness, tensile and compression-set tests to ISO or ASTM methods.
- EU REACH: restricted substances such as PAHs in rubber parts that touch the skin (Annex XVII); food-grade seals need food-contact compliance.
- Automotive buyers ask for IATF 16949 and PPAP documents.
Start with replacement hoses, V-belts or gaskets for aftermarket distributors in the Gulf and Africa, where part-number catalogues matter more than OEM approvals. Send samples cross-referenced to known part numbers.
Where new exporters go wrong
- Wrong compound for the fluid or temperature — swollen seals and burst hoses bring claims.
- Rubber ageing in hot warehouses; mark the cure date and rotate stock.
- Using brand names of OEMs on packing without permission.
Documents this product needs
Schemes that apply
- RoDTEP Remission of Duties and Taxes on Exported Products
- Drawback Duty Drawback (All Industry Rates)
- Advance Authorisation Advance Authorisation
- EPCG Export Promotion Capital Goods Scheme
- ECGC ECGC export credit insurance for small exporters
- LUT Letter of Undertaking for zero-rated exports under GST
- Status Holder Status Holder certificate (One to Five Star Export House)
Sources (5)
Trade data
Indian rubber products (belts, hoses, seals) exports in numbers
From the Department of Commerce’s TradeStat, country by country. US$, Indian financial years (April–March).
- Exports in 2025-26
- US$ 1.2 bn +10.9% a year on average, 2020-21 to 2025-26
- Change from 2024-25
- ↑ +5.7% US$ 1.13 bn → US$ 1.2 bn
- Buyer countries
- 165
- Average export price
- US$ 4.90 per kg · 2,44,114 tonnes shipped · US$ 4.72 the year before
The price cycle
India’s average export price per kg each year (total value ÷ total quantity). Highest in 2020-21, lowest in 2021-22 — a 12% swing between them. Keep this swing in mind when you quote.
What next: a projection from the trend
The past trend carried forward — not a forecast by any authority. Sudden changes in policy, prices or demand are not in it.
Likely range US$ 1.28 bn to US$ 1.72 bn.
- Trend
- +9% a year
- Fit (R²)
- 0.78
- Based on
- 6 years of official figures
Method: a straight line through the logarithm of yearly exports (log-linear regression); range = ±1 standard error.
Biggest buyer countries
By value in 2025-26. Change is against 2024-25.
Where demand is rising and falling
Only countries that buy at least US$ 1 million or 1% of India’s exports of this product. Change from 2024-25 to 2025-26.
↑ High demand
↓ Low demand
- RussiaUS$ 23 mn → US$ 20 mn↓-13.2%
- NetherlandsUS$ 54 mn → US$ 47.7 mn↓-11.7%
- South AfricaUS$ 17.4 mn → US$ 15.5 mn↓-11.1%
- BrazilUS$ 33.4 mn → US$ 29.9 mn↓-10.4%
Which forms sell, and at what price
India’s exports by 8-digit tariff line, 2025-26. Average price = total value ÷ total quantity (TradeStat): the average of every shipment on that line, not the price of any one deal.
| Tariff line | Value 2025-26 | Change | Quantity | Average price |
|---|---|---|---|---|
Others articles of vulcanised rubber excluding mats/gaskets and other inflatable articles4016 99 90 · Rubber, vulcanised, articles in heading no. 4016, of non-cellular rubber | US$ 220 mn | ↑+2.5% | 32,444 tonnes | US$ 6.78 per kgwas US$ 6.53 |
Other articles of gaskets washers and other seal4016 93 90 · Rubber, vulcanised, gaskets, washers and other seals, of non-cellular rubber | US$ 112 mn | ↑+4.9% | 13,653 tonnes | US$ 8.23 per kgwas US$ 7.56 |
Rubber, vulcanised, floor coverings and mats, of non-cellular rubber — floor coverings and mats4016 91 00 | US$ 102 mn | ↓-2.2% | 93,610 tonnes | US$ 1.09 per kgwas US$ 1.13 |
Trnsmsn blt/bltng other than flat blt/ply blt where ruby compd more than 25% by weight.4010 39 99 · Rubber, vulcanised, conveyor or transmission belts or belting in heading no. 4010 | US$ 86 mn | ↓-0.9% | 7,482 tonnes | US$ 11.49 per kgwas US$ 11.52 |
Tubes, pipes and hoses of vulcnsd rubr reinforced/othrwse cmbnd only with textile materials wthout fittings4009 31 00 · Rubber, vulcanised, tubing, piping and hoses, reinforced or otherwise combined only with textile materials… | US$ 79.2 mn | ↑+4.8% | 8,533 tonnes | US$ 9.28 per kgwas US$ 9.16 |
Rubber, vulcanised, articles in heading no. 4016, of non-cellular rubber — stoppers4016 99 80 | US$ 79.2 mn | ↑+14.3% | 8,640 tonnes | US$ 9.16 per kgwas US$ 9.12 |
(cnvyr blt/bltng)renfrcd with txtl mtrls where rubr compd content more than 25% by weight4010 12 90 · Rubber, vulcanised, conveyor belts or belting, reinforced only with textile materials | US$ 73.1 mn | ↓-19.2% | 24,740 tonnes | US$ 2.96 per kgwas US$ 3.27 |
Tubes,pipes and hoses of vulcnsd rubr reinforced/othrwse cmbnd only with metal materials without fittings4009 21 00 · Rubber, vulcanised, tubing, piping and hoses, reinforced or otherwise combined only with metal, without… | US$ 66.1 mn | ↓-1.2% | 14,434 tonnes | US$ 4.58 per kgwas US$ 4.69 |
Rubber seals(oil seals,etc.)4016 93 30 · Rubber, vulcanised, gaskets, washers and other seals, of non-cellular rubber | US$ 56.4 mn | ↑+9.2% | 2,082 tonnes | US$ 27.08 per kgwas US$ 26.97 |
Rubber, vulcanised, gaskets, washers and other seals, of non-cellular rubber — gaskets4016 93 40 | US$ 50.3 mn | ↑+19.5% | 4,617 tonnes | US$ 10.89 per kgwas US$ 10.60 |
Tubes,pipes and hoses of vulcnsd rubr reinforced/otherwse cmbnd only with textiles materials with fittings4009 32 00 · Rubber, vulcanised, tubing, piping and hoses, reinforced or otherwise combined only with textile materials… | US$ 39.5 mn | ↑+12.7% | 5,966 tonnes | US$ 6.62 per kgwas US$ 6.39 |
Tubes,pipes and hoses of vulcnsd rubr not reinforced/othrwse combined with other materials without fittings4009 11 00 · Rubber, vulcanised, tubing, piping and hoses, not reinforced or otherwise combined with other materials… | US$ 28.5 mn | ↑+24.7% | 2,233 tonnes | US$ 12.77 per kgwas US$ 12.65 |
Tubes,pipes and hoses of vulcnsd rubr reinforced/otherwse cmbnd only with metal with fittings4009 22 00 · Rubber, vulcanised, tubing, piping and hoses, reinforced or otherwise combined only with metal, with fittings | US$ 20.1 mn | ↑+57.6% | 1,470 tonnes | US$ 13.68 per kgwas US$ 13.47 |
Rubber, vulcanised, articles in heading no. 4016, of non-cellular rubber — rubber bush4016 99 60 | US$ 16.3 mn | ↑+20.1% | 2,519 tonnes | US$ 6.45 per kgwas US$ 5.59 |
The world market
Each country’s own recorded exports and imports in UN Comtrade, 2023 (the latest year nearly every country has reported).
- World imports
- US$ 53.2 bn 2023
- India among exporters
- #13 of 159 countries
- India’s share of world exports
- 2% US$ 1.04 bn
- Left for others to win
- US$ 50.3 bn exported by other countries
Top exporters — your competitors
- 1GermanyUS$ 6.92 bn 13.5%
- 2ChinaUS$ 6.91 bn 13.5%
- 3USAUS$ 5.04 bn 9.8%
- 4PolandUS$ 2.8 bn 5.4%
- 5ItalyUS$ 2.57 bn 5%
- 6MexicoUS$ 2.11 bn 4.1%
- 7JapanUS$ 2.1 bn 4.1%
- 8FranceUS$ 1.92 bn 3.7%
- 9TürkiyeUS$ 1.56 bn 3%
- 10ThailandUS$ 1.24 bn 2.4%
Biggest buyers in the world
- 1USAUS$ 8.13 bn 15.3%
- 2GermanyUS$ 5.16 bn 9.7%
- 3MexicoUS$ 2.81 bn 5.3%
- 4ChinaUS$ 2.73 bn 5.1%
- 5CanadaUS$ 2.06 bn 3.9%
- 6FranceUS$ 1.89 bn 3.6%
- 7United KingdomUS$ 1.43 bn 2.7%
- 8PolandUS$ 1.43 bn 2.7%
- 9ItalyUS$ 1.34 bn 2.5%
- 10JapanUS$ 1.19 bn 2.2%
Opportunity: what these countries buy from the world, and from India
Each country’s own recorded imports in UN Comtrade, latest year it has reported. The long light part of each bar is demand other countries are filling today.
TradeStat’s 2023-24 quantities are double-counted, so that year is left out of the price. Sources: TradeStat — Export Import Data Bank, Department of Commerce · UN Comtrade database (United Nations Statistics Division) · Figures taken 29 October 2026.
Step by step
How to export rubber products (belts, hoses, seals)
India has a broad rubber-products industry built on domestic natural rubber and a large vehicle and machinery base, and it exports hoses, belts, seals and moulded parts mainly to the USA and Europe. Germany, China, the USA, Japan and Thailand lead world trade in technical rubber goods. Demand comes from vehicles, mining and cement conveyors, hydraulics, oil and gas, and buyers diversifying away from China. Openings are in aftermarket parts, conveyor belting for Africa and the Middle East, and OEM supply for firms with IATF 16949 systems.
- 01Choose a niche
Aftermarket hoses, belts, seals or conveyor belting.
- 02Build a cross-reference
Map your parts to OEM and competitor part numbers.
- 03Test
Hardness, tensile, ageing and pressure tests at an NABL lab.
- 04Sample
Send samples to distributors; get feedback on fit.
- 05Produce and pack
Bag by part number; protect from light and heat.
- 06Ship and claim
File the shipping bill; claim RoDTEP and drawback.
- 07Payment
LC or advance for distributors; OEMs often pay on 60–90 day terms — use ECGC cover.
Meet buyers
Trade fairs
- October, every three years (next: October 2028)K — plastics and rubber trade fairDüsseldorf, Germanyk-online.com ↗
- September, every two years — check the next editionAutomechanika FrankfurtFrankfurt, Germanyautomechanika.messefrankfurt.com ↗
- April, every year — check datesHannover MesseHannover, Germanyhannovermesse.de ↗
- Usually November — check datesBig 5 GlobalDubai, UAEbig5global.com ↗
Questions
Questions about exporting rubber products (belts, hoses, seals)
Which council covers rubber products?
What drawback applies to moulded parts?
Do I need IATF 16949?
How long do rubber parts last in storage?
What RoDTEP applies?
Sources (6)
- CAPEXIL — official site
- Rubber Board, Ministry of Commerce & Industry — official site
- ECHA — Understanding REACH
- NABL — search for accredited testing laboratories
- DGFT — Appendix 4R, RoDTEP schedule for DTA exports w.e.f. 10.10.2024 (Notification 32/2024-25); rates continued to 31.12.2026 by Notification 41/2026-27
- Gazette of India — Notification 77/2023-Customs (N.T.) dated 20.10.2023: All Industry Rates of duty drawback
Who buys Indian rubber products (belts, hoses, seals)
All countries → USDWashington, D.C.United States of AmericaIndia's largest single-country export market. Strict FDA rules for food; extra 10% US duty on most goods since July 2026.From India 2025-26US$ 87.3 bn
 EURBerlinGermanyEurope's largest economy and India's biggest EU partner. Values quality, certificates and supply-chain transparency.From India 2025-26US$ 11.5 bn
 CETAGBPLondonUnited KingdomNew CETA in force since July 2026 — most Indian goods now enter duty-free. Strong market for garments, food and engineering.From India 2025-26US$ 13.4 bn
 EURAmsterdamNetherlandsEurope's main gateway: Rotterdam handles goods for the whole EU. EU food-safety and residue rules apply.From India 2025-26US$ 17.5 bn
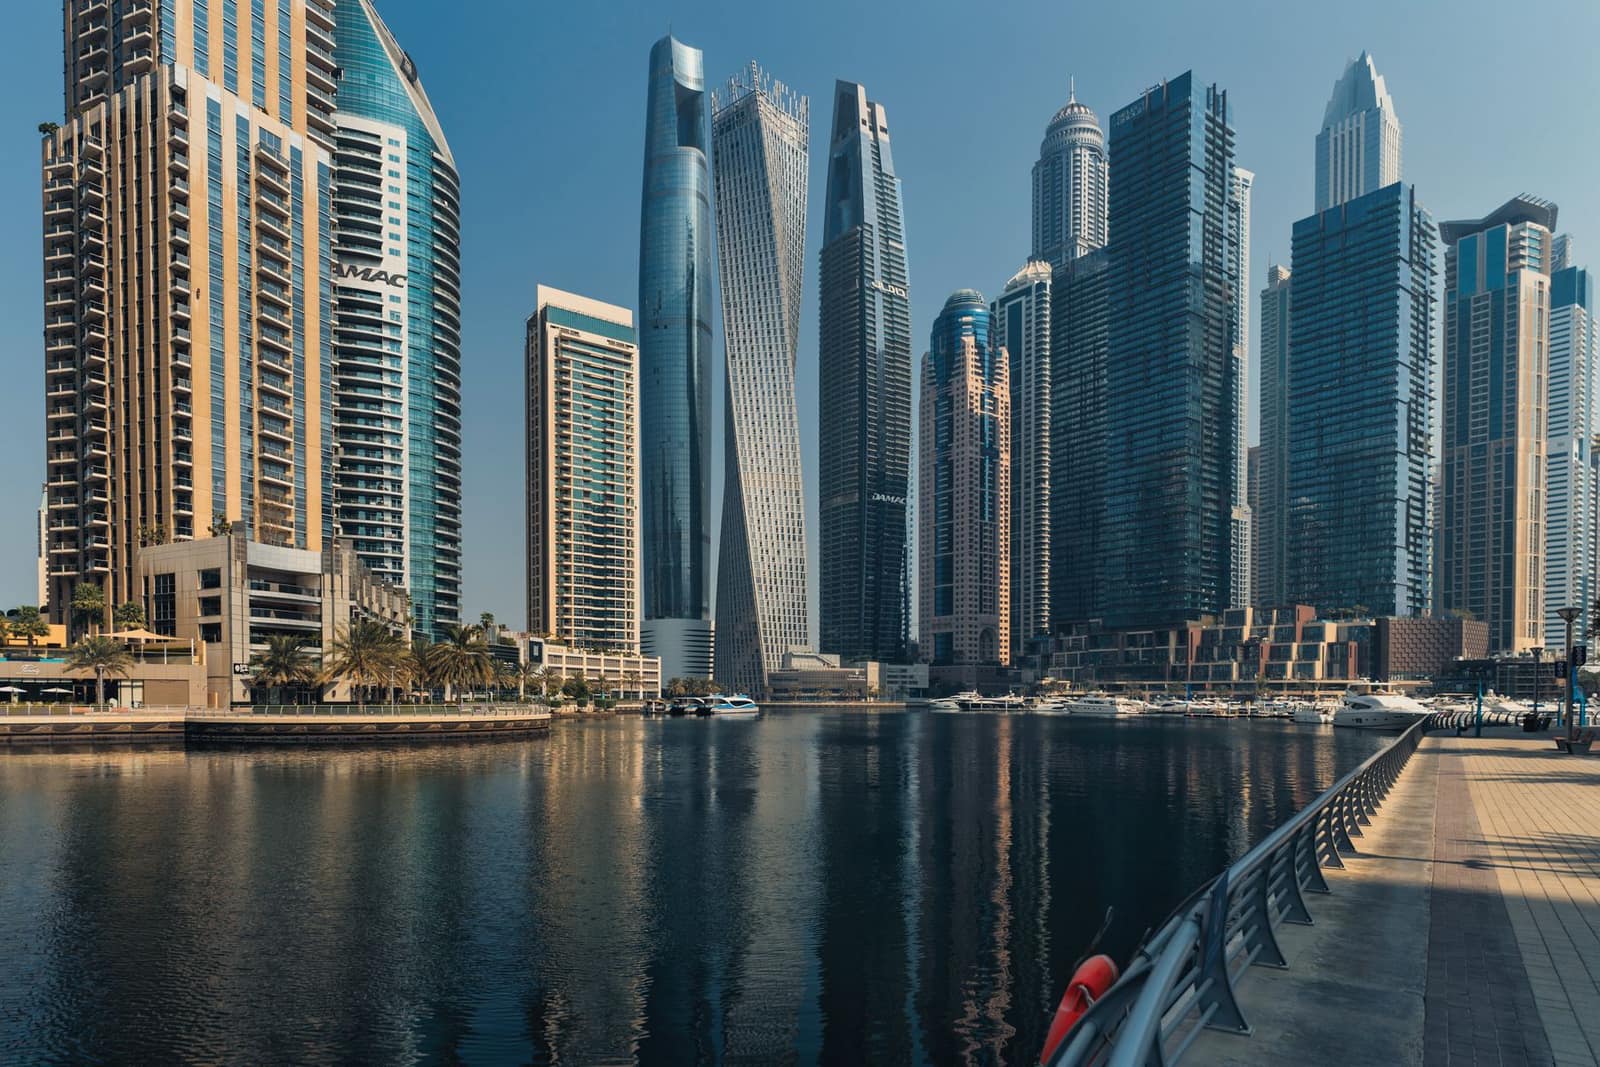 CEPAAEDAbu DhabiUnited Arab EmiratesIndia's biggest Gulf buyer and a re-export hub for the Middle East and Africa. CEPA in force since 2022.From India 2025-26US$ 37.4 bn
 ECTAAUDCanberraAustraliaZero duty on all Indian goods since Jan 2026 — but some of the world's strictest biosecurity rules.From India 2025-26US$ 7.28 bn
 EURParisFranceFashion, food and design market. EU rules plus French-language labels; SIAL Paris is a key food fair.From India 2025-26US$ 7.1 bn
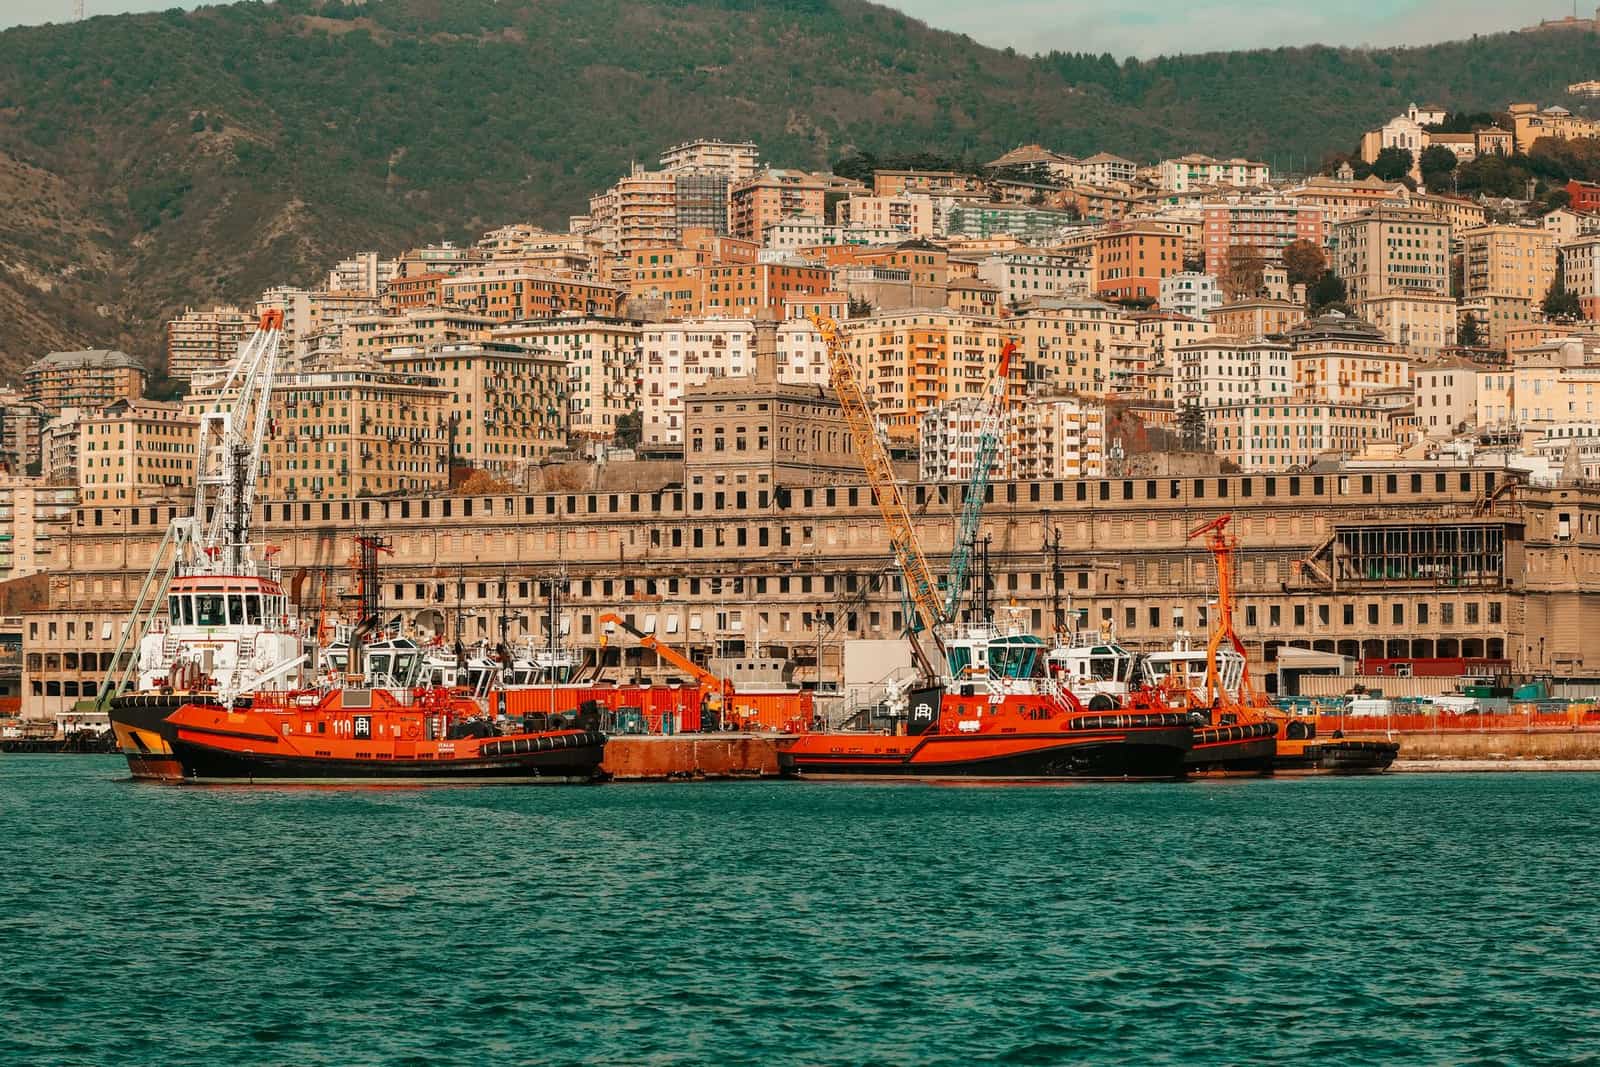 EURRomeItalyManufacturing buyer of Indian leather, yarn, castings, chemicals and seafood. EU rules apply.From India 2025-26US$ 7.79 bn
More in other goods
All products → Free to exportOther goodsCeramic and vitrified tilesMorbi-made wall, floor and vitrified tiles shipped by container; the UAE, Russia, USA and UK lead.HS6907Exports 2025-26US$ 2.12 bn ↓0.5%
 Free to exportOther goodsGranite and natural stonePolished granite slabs, monuments and sandstone from South India and Rajasthan; the USA leads.HS6802Exports 2025-26US$ 1.17 bn ↑0.7%
 Free to exportOther goodsToysWooden, plastic and board-game toys; child-safety testing decides access to the USA and EU.HS9503Exports 2025-26US$ 201 mn ↑18.5%
 Free to exportOther goodsPaper and paperboard packagingPaper bags, cartons and food packaging as plastic is phased out; the USA leads, then the UK and UAE.HS4819Exports 2025-26US$ 353 mn ↑6.1%